In all the last lock stretches we saw a lot of very loud glitches, clearly visible as large drops in the range. See reports from Sheila and Lisa.
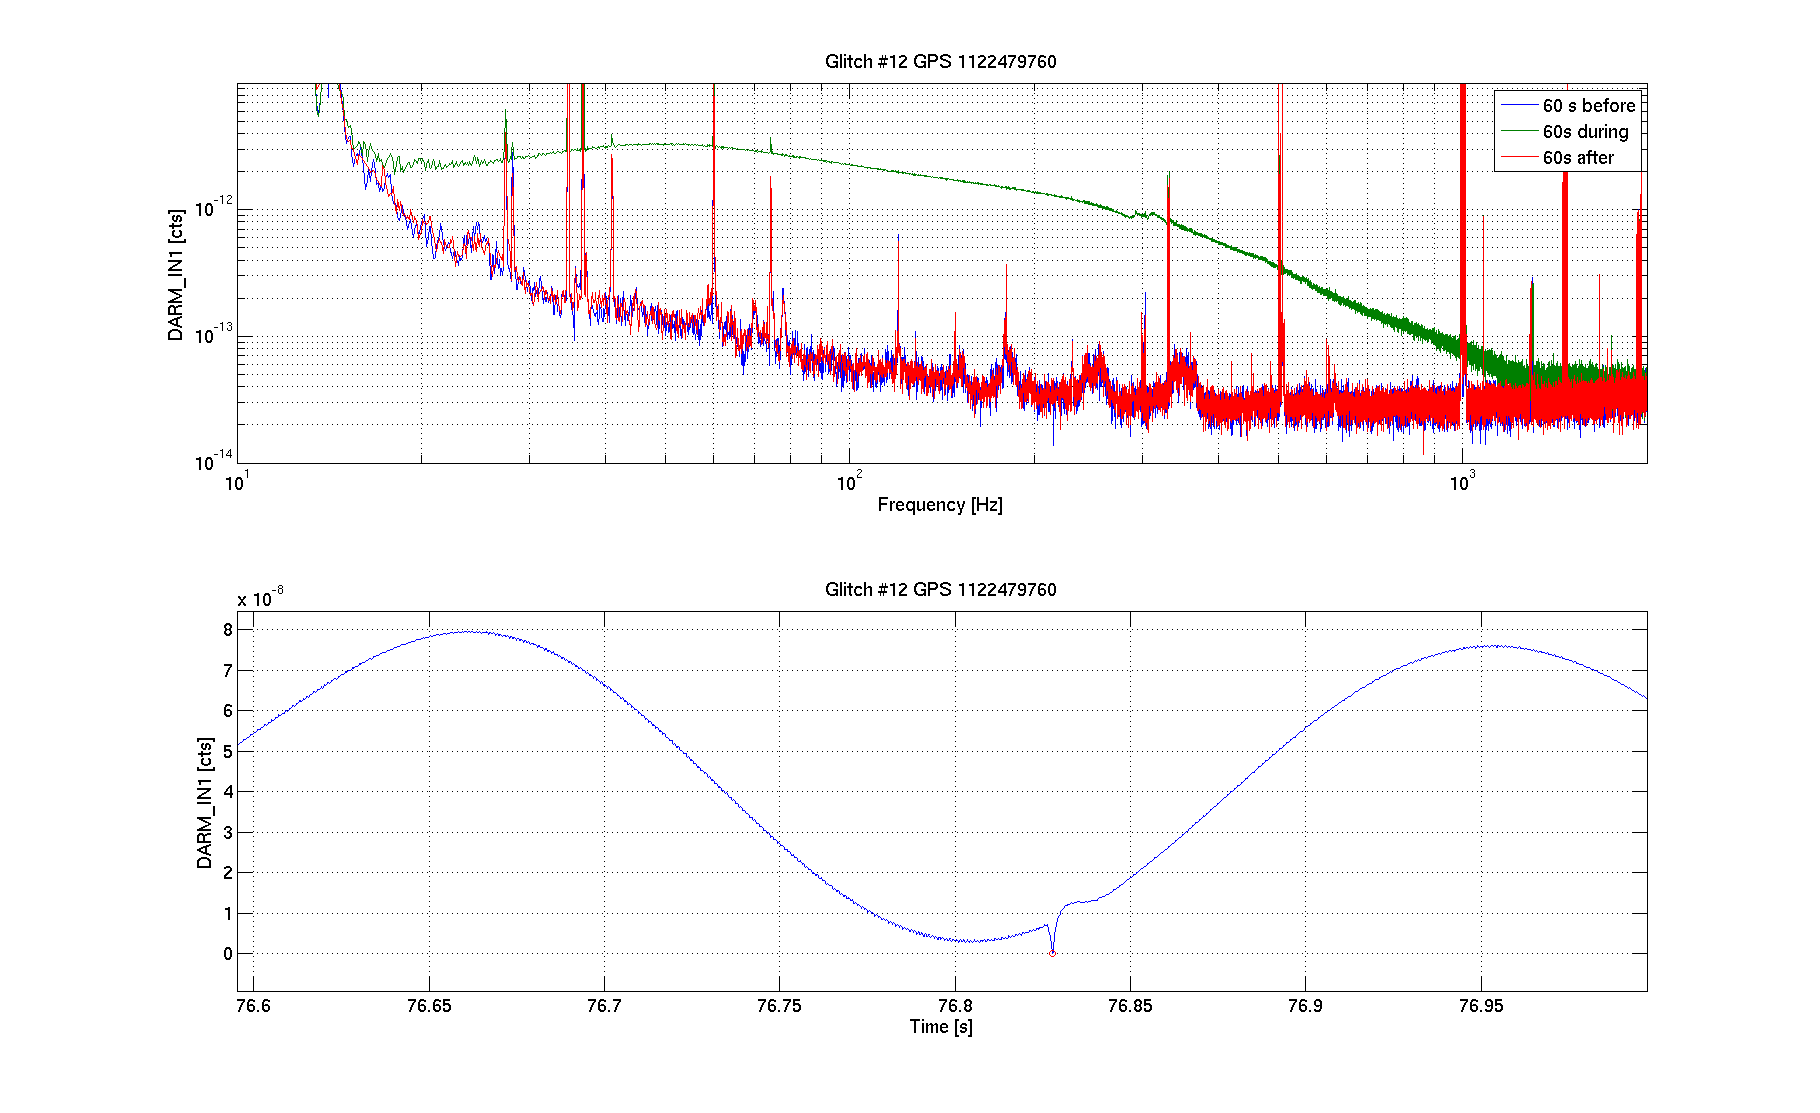
I had a look at the time period pointed out by Lisa (1122456180 - 1122486360). I wrote a MATLAB script (attached) that load the range and select the glitch times looking at the large drops. Since the range is sampled once per minute, I then look at the DARM error point and search for an excess of noise in the 30 to 300 Hz region. In this way, 16 loud glitches were selected.
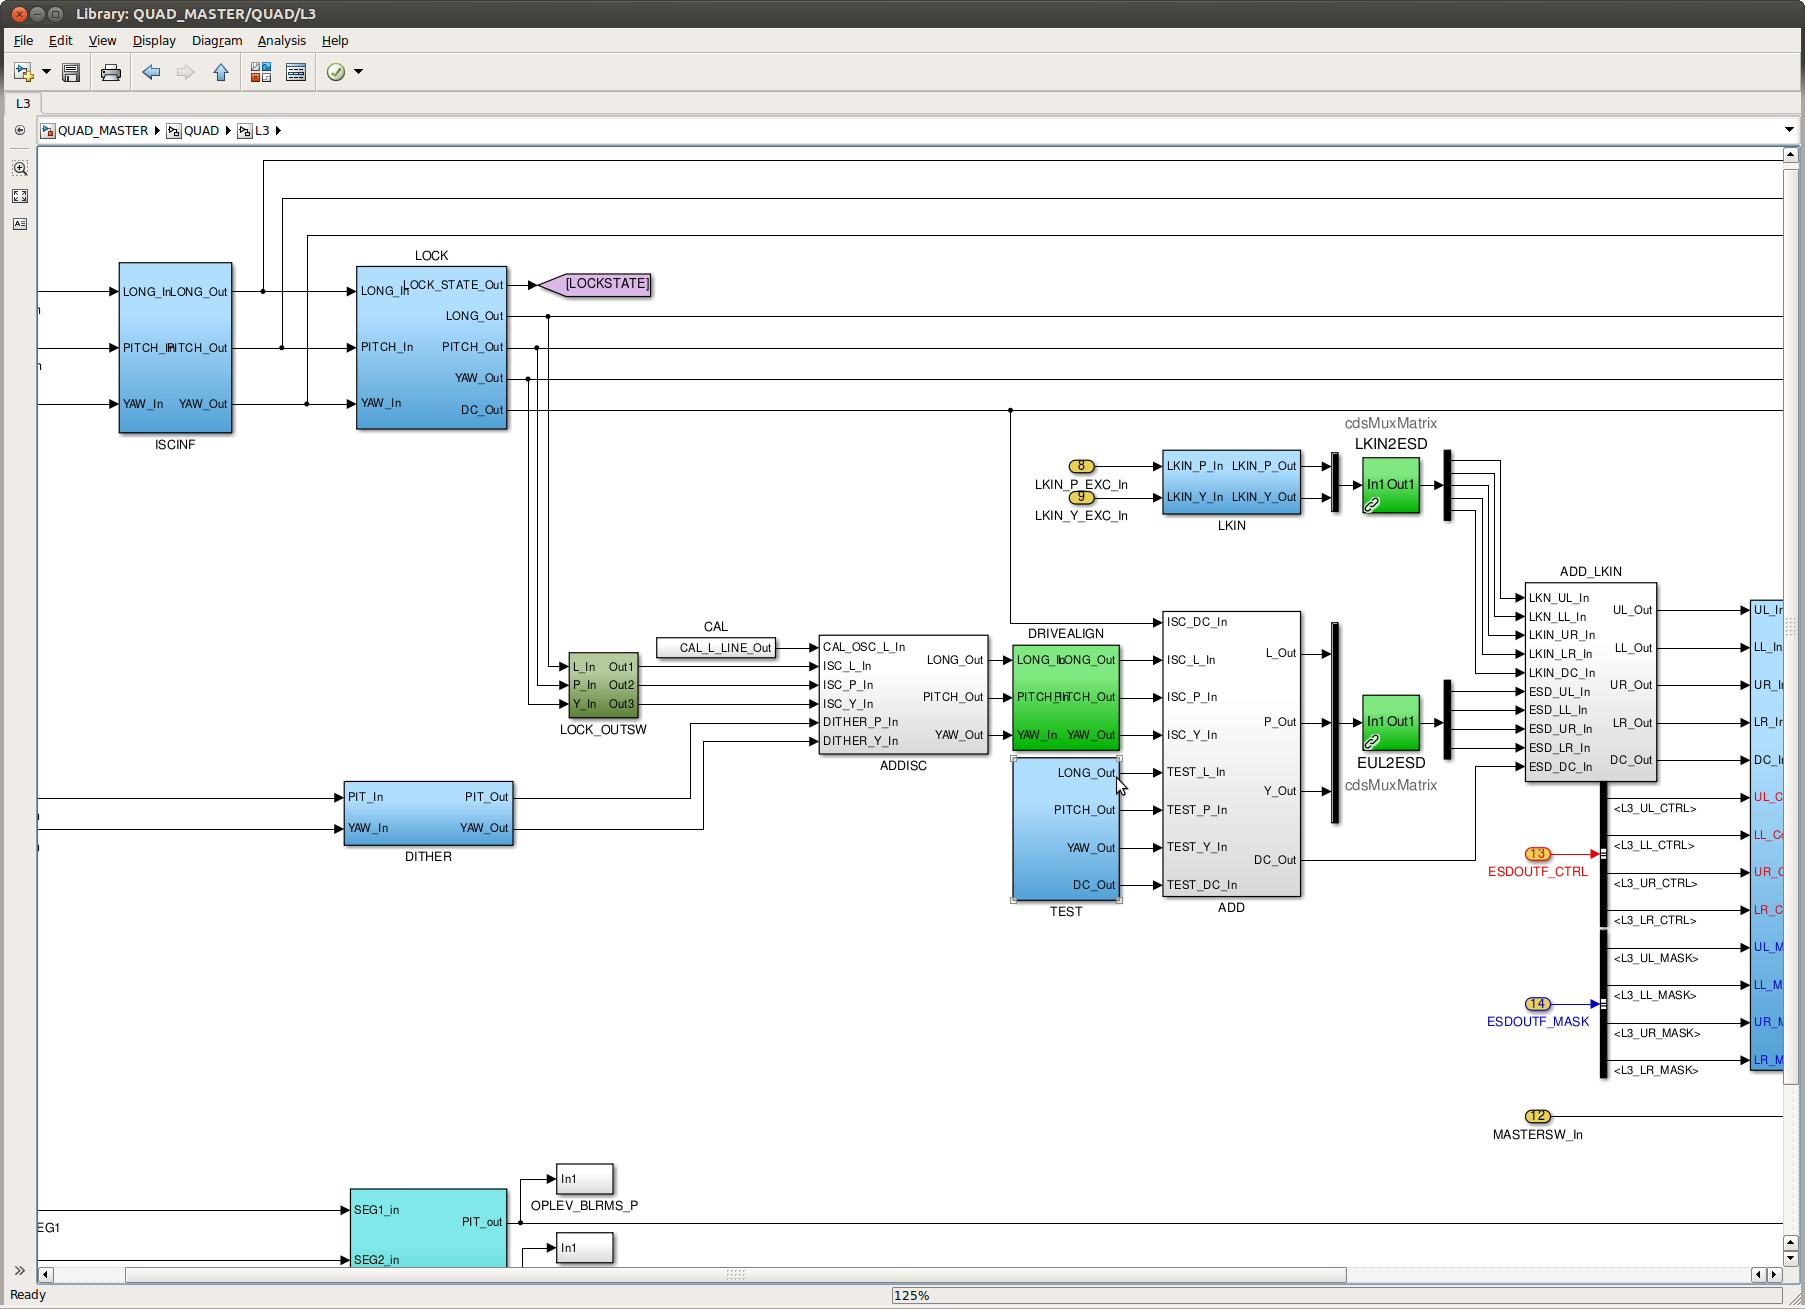
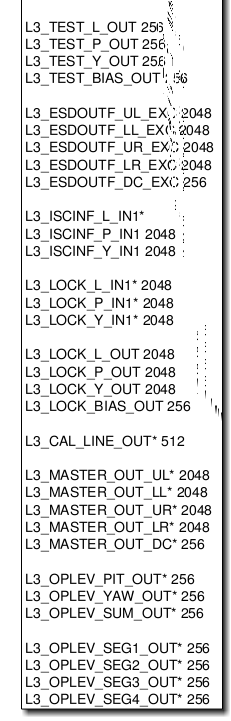
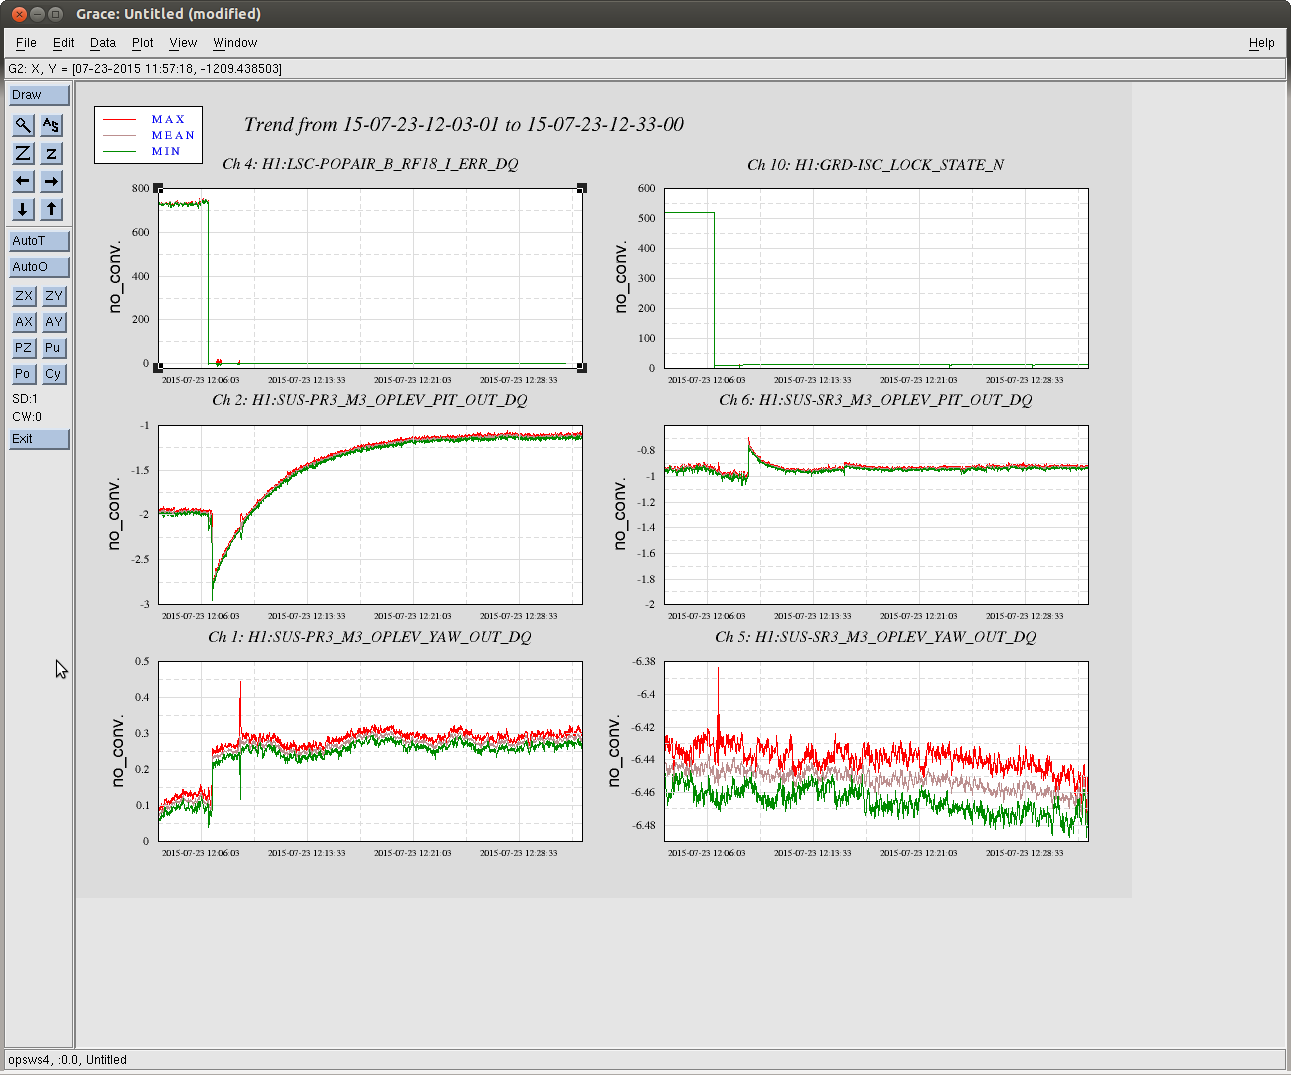
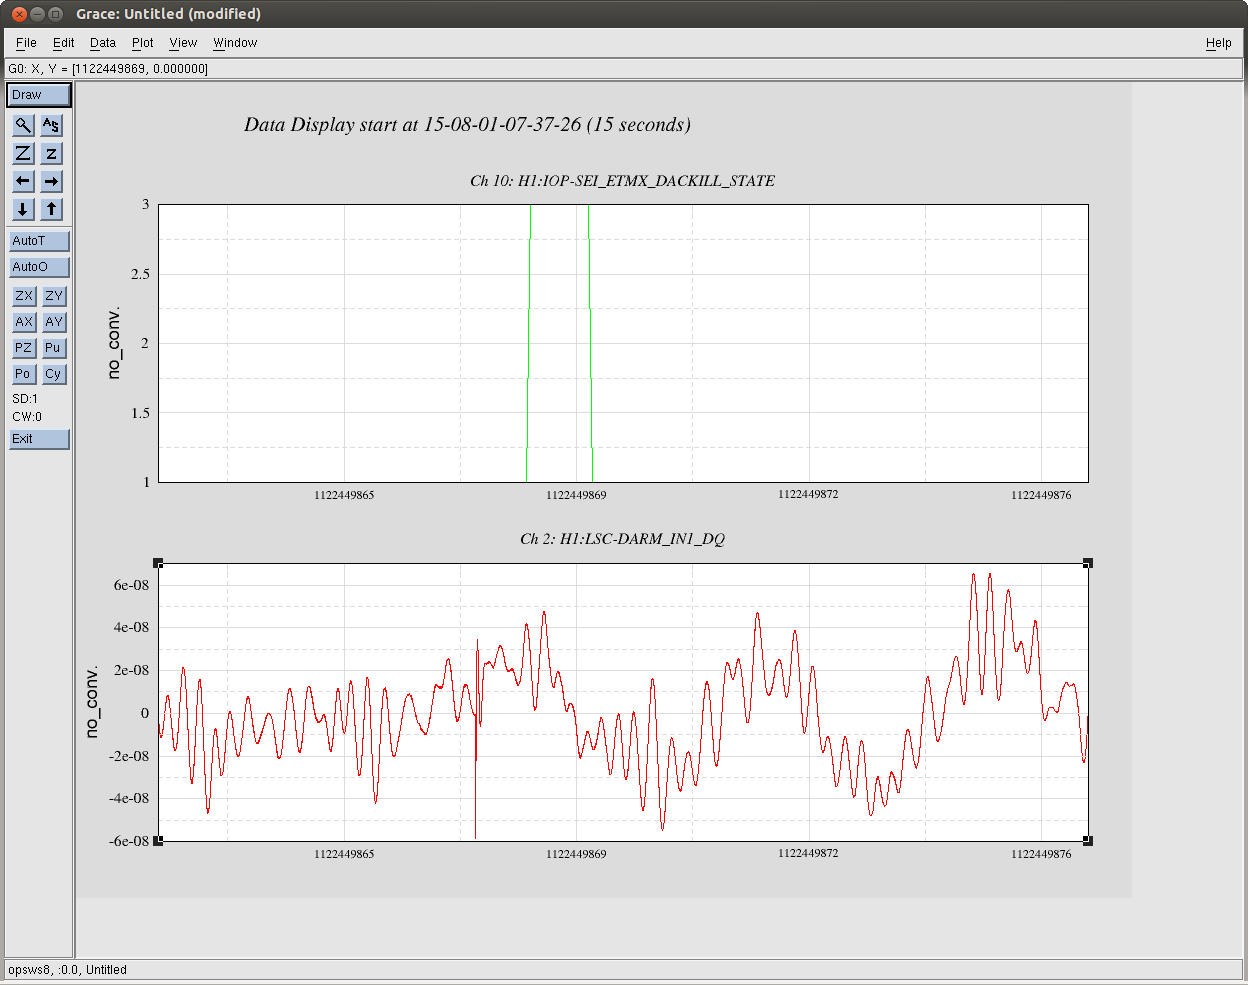
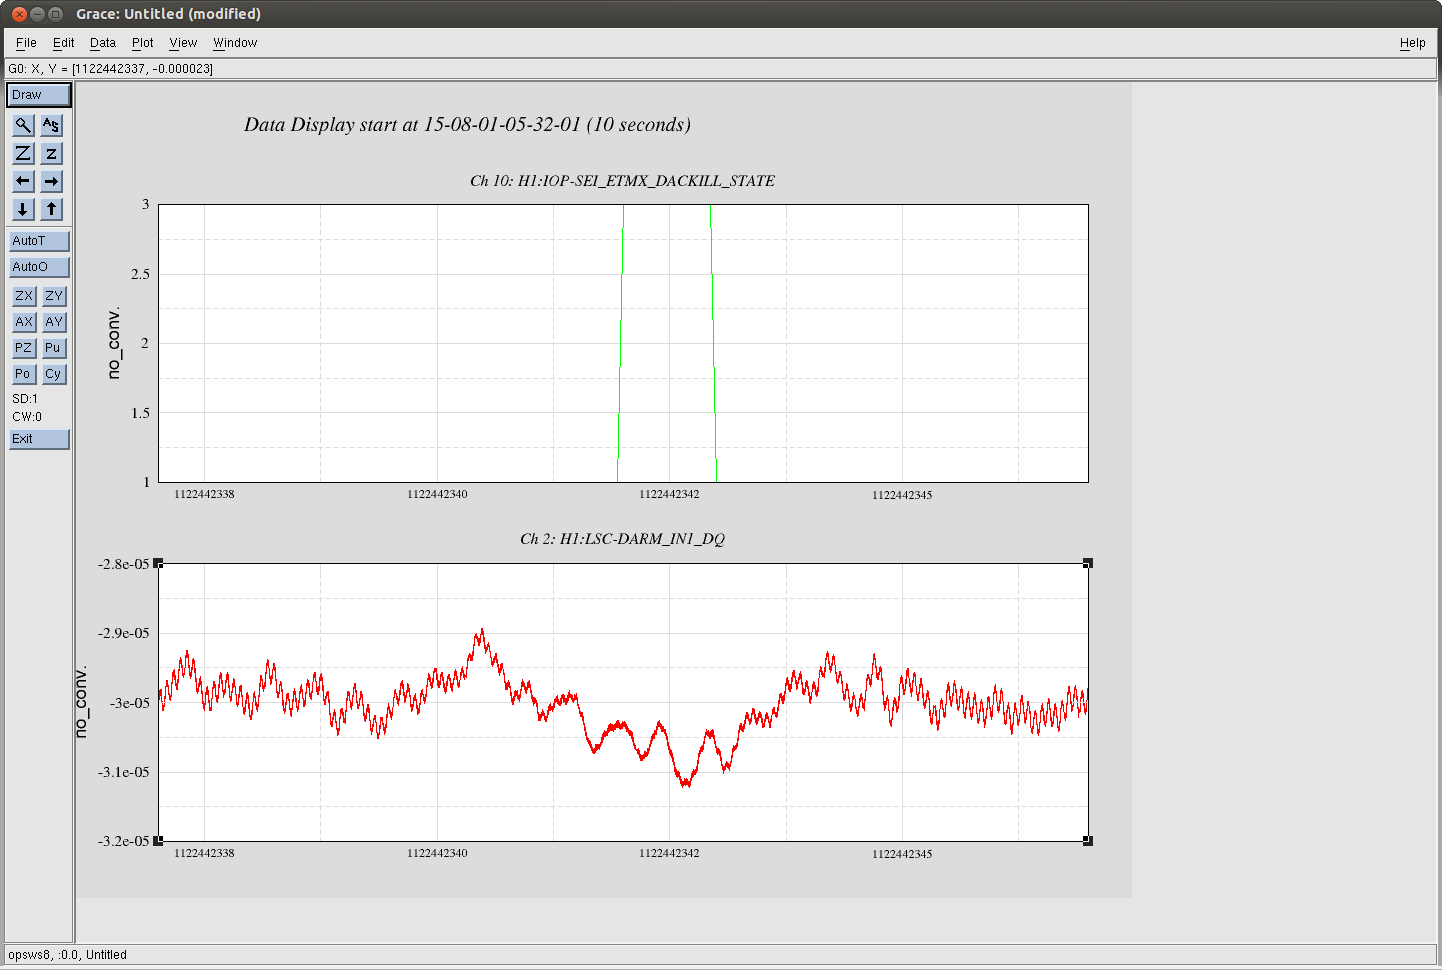
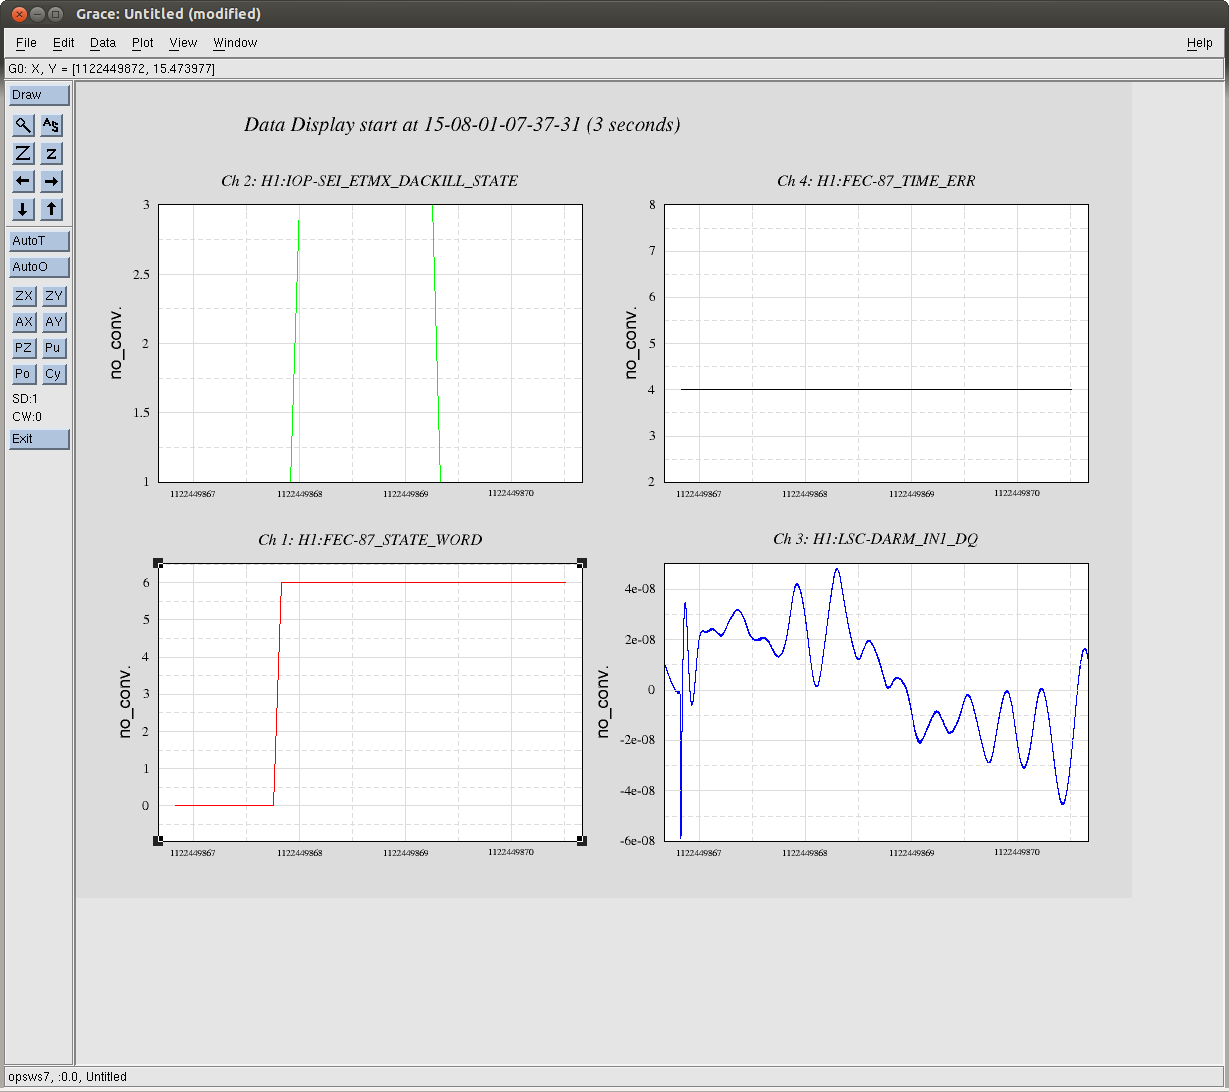
Most of them are similar, see the first figure. I checked with the MATLAB script the value of all suspension actuation signal, using the MASTER channels. No saturation or unusual behavior is visible.
I also checked that there is no drop or change in the IFO powers. Then, as suggested by Sheila, I checked the DACKILL signals as well as the CPU_METER signals. Nothing there.
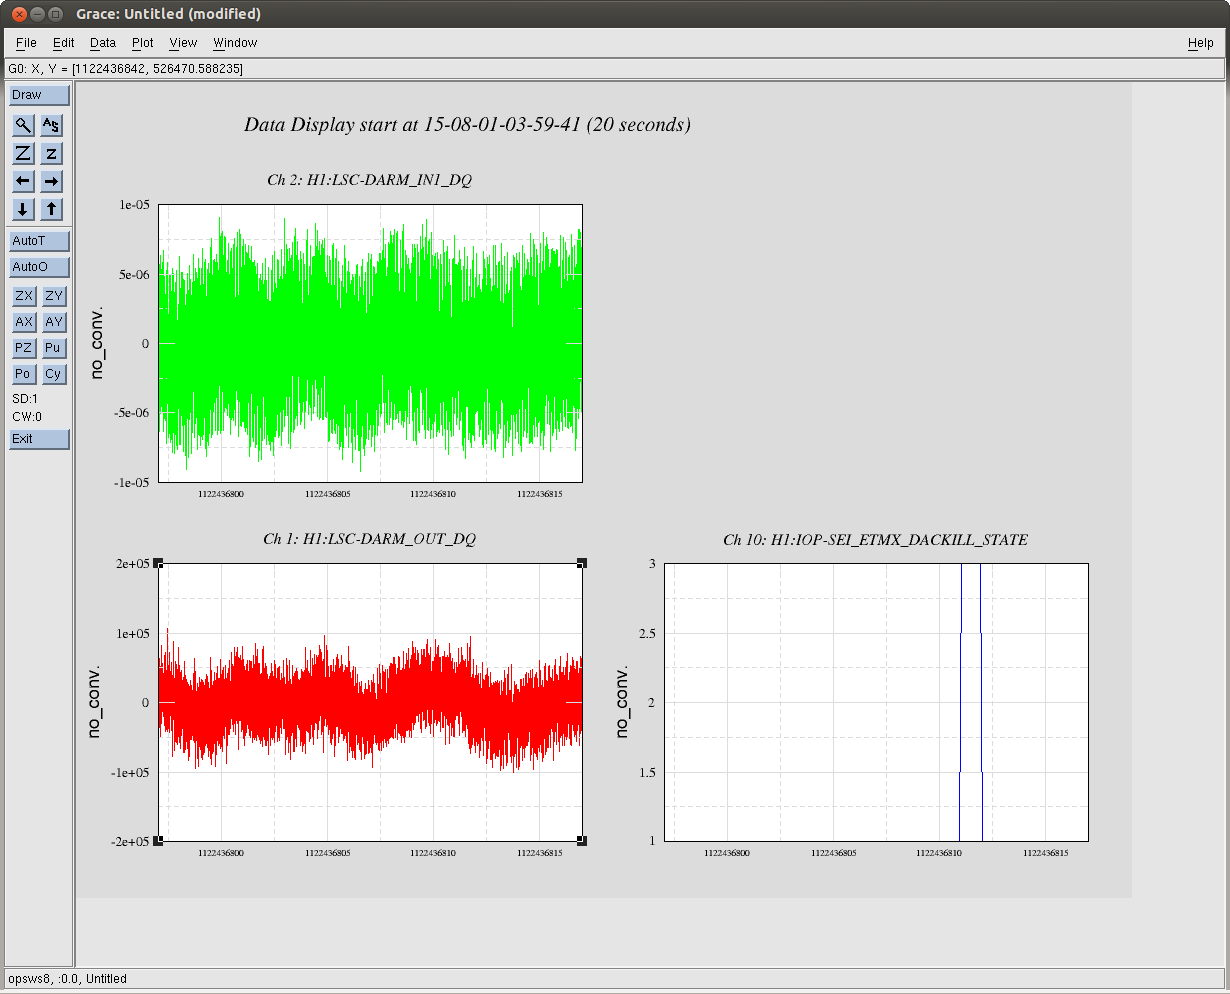
Finally, I selected the loudest glitch (1122479776) and looked at all (literally) *_DQ channels. I couldn't find any interesting correlation, except for signals that are known to be related to the DARM loop, like for example ETM* and ITM* control signals. For this glitch and a couple of the loudest ones I could see a similar glitch in H1:LSC-ASAIR_A_RF45_Q_ERR_DQ, H1:ASC-AS_A_RF45_I_YAW_OUT_DQ, H1:ASC-X_TR_A_NSUM_OUT_DQ, H1:ASC-Y_TR_A_NSUM_OUT_DQ. All these are signals somehow sensitive to DARM.
In conclusion, I couldn't find any channel, except DARM ones, that are correlated with those glitches.

In addition to what reported above, I can add that the glitches are not correlated to any clear level crossing of any of the control signals (MASTER*)
I also checked that there is no overflow on any of the FEM-*_CPU_METER signals.
Here is the list of time of the glitches in this period.
1122457875.48352 **
1122458467.51526 **
1122464968.42584
1122466633.18567
1122467932.76263 **
1122470377.97369
1122470958.48877
1122471214.02692 **
1122474562.14758
1122478259.22369 **
1122479126.35669
1122479776.82788
1122481918.12170 **
1122483108.98047
1122484101.65674
1122485013.84241
Those marked with ** look somwhat different in the spectral shape, so they may be uncorellated with the others.
The loudest glitches on the 26th were ETMY L3 DAC overflows (alog), as were the ones on the 28th. That's not the case in this lock; there were no overflows in the ETM L2 or L3 DACs, or in the OMC DCPDs.
Here is the working script, the previous one had some copy and paste mistakes...