J. Kissel
---------
Executive Summary: The INJ group has identified a problem with the H1 hardwar injection path, see LHO aLOG 19435 and HWInjER7CheckSGs. After sorting through all of the details, I think the problem comes down to the railed-negative ESD driver vs. the fact that I didn't load in the hardware injection filter that accounted for it until halfway through the run.
This hypothesis needs follow-up questions asked of the analysis folks (Pitkin, Shawhan):
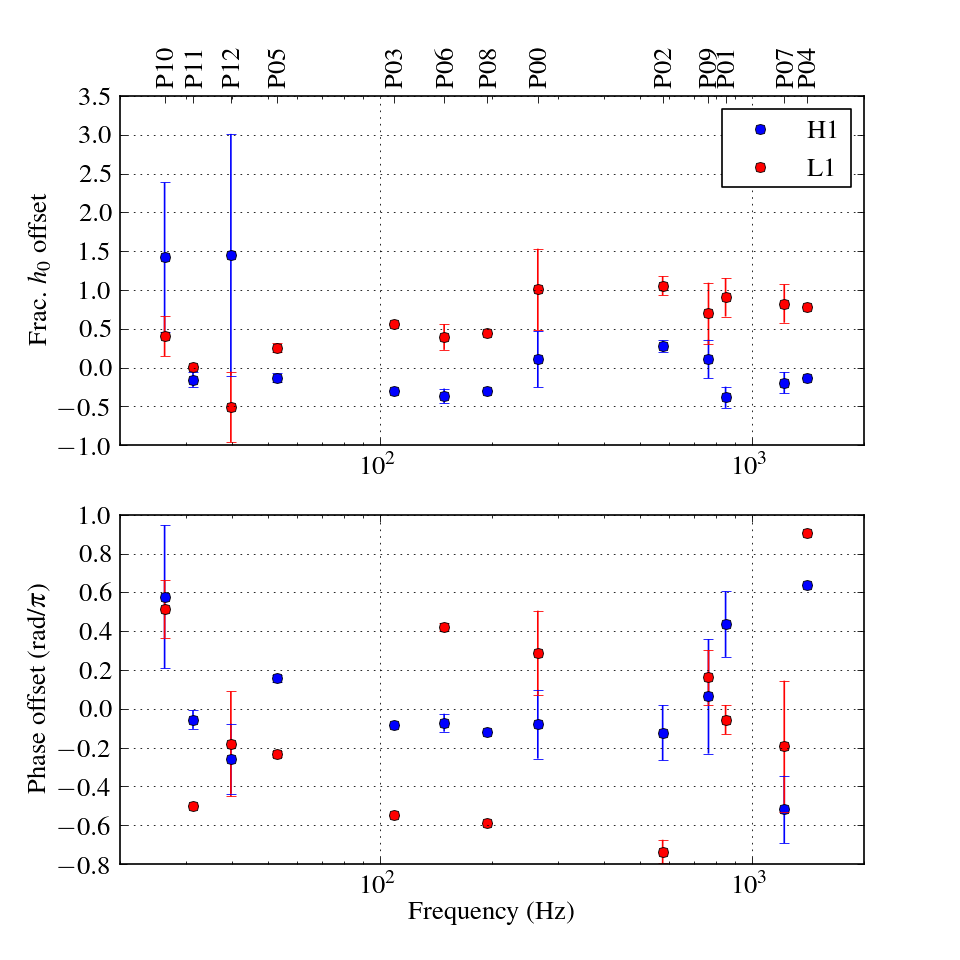
(1) When where the hardware injections made that were used for the analysis in the sine-guassian sign checks?
(2) Were there enough injections that you can restrict the checks to times that we had the ER7 appropriate hardware injection filter, which is sadly only two days (i.e. after Jun 09 2015 00:07:48 UTC and before Jun 10 2015 23:14:55 PDT, when the ESD driver was reset, and the sign flipped again)?
---------
Details -- the full check of the ER7 filters:
After ER7, the hardware injection team and the search groups had identified a potential issue with the H1 hardware injection path. Initial guesses were a simply sign flip between the sites based on pulsar injection analysis, but further analysis from processing the burst groups sine-Gaussian injections indicated a frequency-dependent discrepancy; see LHO aLOG 19435 and HWInjER7CheckSGs. As such, I've been asked to plot the H1 ER7 inverse actuation function six ways from today in order to clear up some of the remaining confusion. See LHO aLOG 18997 for original documentation.
Attached are plots, which are captioned below.
Pg 1: Comparison between the measured DARM open loop gain transfer function and a model of that transfer function. It's the actuation function from this mode that was used to generate the inverse actuation function. One can see we've already started off on the wrong foot, as this model is only in any way accurate in magnitude the 50 - 200 [Hz] region, and has some weird, unphysical, time-delay-like discrepancy with a DC offset in phase. See LHO aLOG 18769 for all the gory details and flaws of this model.
Pg 2: The inverse actuation filter I designed, and it's residuals with the "perfect" inverse actuation function from the above model. Note that I had tried to make the filter as simple as possible (which is what it's called a "toy model" in these plots), and "cheated" at high-frequency by demanding that the search groups are aware that the hardware injections will need an acausal time advance to be interpreted correctly. You can find discussion of why one needs an advance in the Mini-Run filter design, see LHO aLOG 18115, but in summary -- the real actuation function has a delay, so the inverse *must* have an advance to be accurate. This is similar to what's done with inverting the real sensing function when generating the gravitational wave channel.
Pg 3: [[New Plot]] The inverse actuation filter with and without the time advance included, compared against the real model. The green trace in these plots are what has been implemented in the foton filter banks.
Pg 4: [[New Plot]] Same information as pg 3, just zoomed in on the lower left panel, highlighting the phase of the inverse actuation filter.
Pg 5: [[New Plot]] Since scientists can never agree on how to display the phase, I've displayed the residual phase between the real model and the toy model with and without the advance, in every different way of which I could think:
- upper left is just a repeat of how I have been displaying the residual (see, e.g. the bottom right panels of pgs 2 and 3).
- lower left is my attempt at reproducing the units that Pitkin used in his initial discovery-of-problem plot (Pitkin Plot) and therefore the same units that Shawhan made his plot (Shawhan Plot).
- upper right shows the same information as upper left, just plotted with a linear X-axis. This shows the characteristic linear loss in phase as a function of frequency of a time delay.
- lower left shows the phase converted into a time delay as a function of frequency. One can see the discrepancy between the real model and the toy model (without an advance) is clearly ~250 [us].
Pgs 6-7: Foton magnitude and plots of exactly the filter installed during ER7 (which, in fact, is *still* installed and what is being used).
Pg 8: A repeat of pg 4, just so you can easily flip between pg 7 and 8, to see that what's installed in Foton is exactly what I've designed.
Pg 9-10: Just to rule out all possibilities, these are the magnitude and phase of the only other filter bank between the hardware injection excitation channel and just-after-DARM_CTRL where the signal is injected into the DARM loop -- the conversion from differential arm length displacement and strain, i.e. the mean length of the arms.
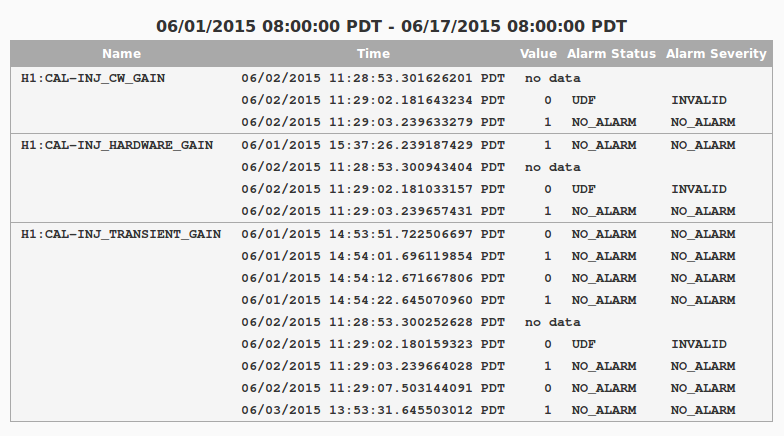
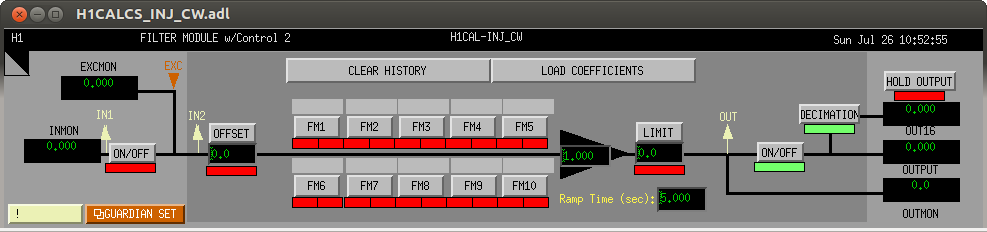
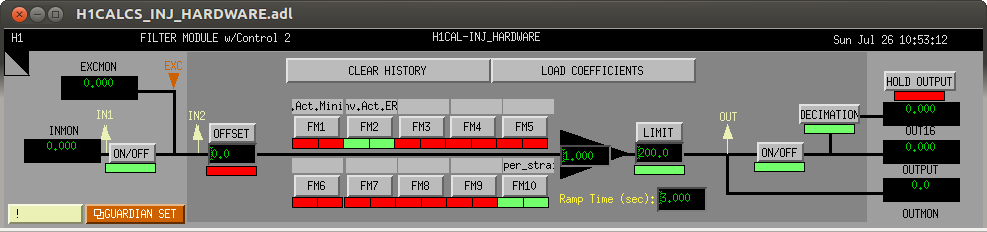
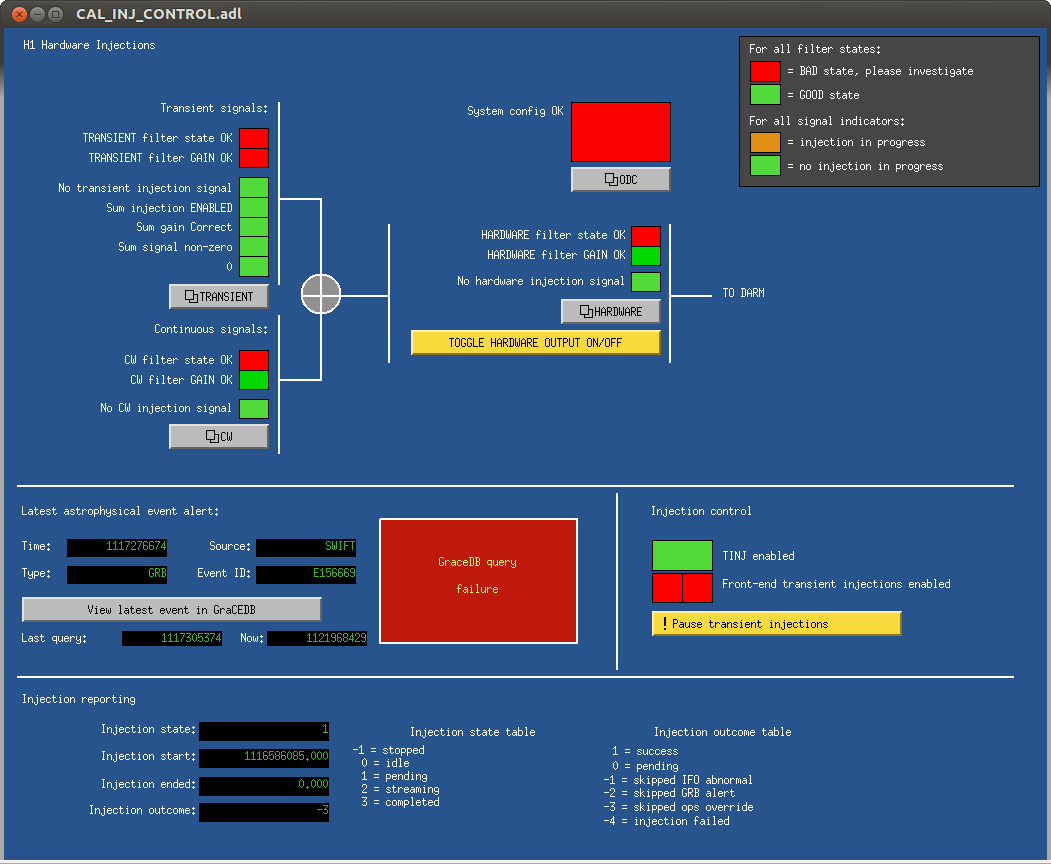
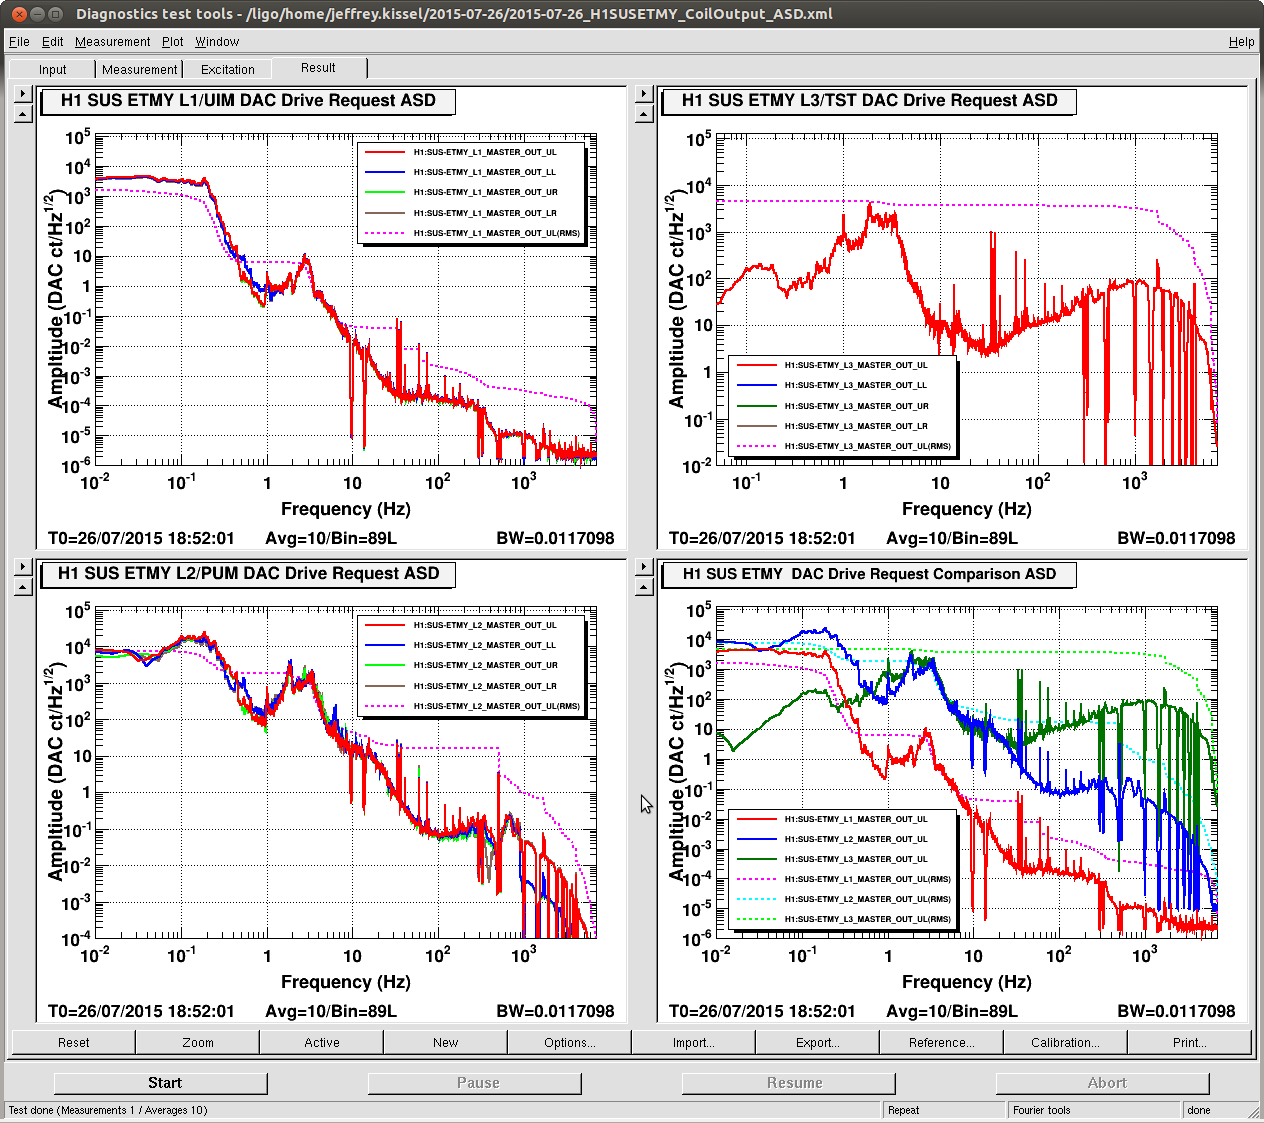
Further, I attach screenshots of the MEDM screens, showing the configuration that they've been in since ER7 started, and to prove that the *gain* was +1.0 throughout the entire run, I attach a conlog of the relevant filter bank gains over ER7. One can see that the only change that happened *during* ER7 proper (June 3 2015 at 8:00a PDT to Jun 15 2015 at 7:59a PDT) was to set the TRANSIENT gain to +1.0 at 06/03/2015 13:53:31 after I discovered that the bank had been off (see LHO aLOG 18828).
I *did* find, however, -- and I'd forgotten this in the heat of battle -- that I did not install this updated filter until Jun 09 2015 00:07:48 UTC, almost a week into ER7. Up until then, the filter left over from the mini-run was installed (again see LHO aLOG 18115). Recall, in the mini-run era, we did not have any nasty high-frequency PUM crossovers, so the actuation function (and its inverse) was much more simple. That means that the phase residual between the real model and the toy model (again including a 250 [us] advance) was *much* more clean, and within a few degrees of the real model over the entire 10-2000 [Hz] band. Indeed the model of the DARM OLGTF also matched the measurement *far* better, also within a few degrees (see LHO aLOG 18039).
*sheesh* The things you think about when writing it all down slowly. The ETMY ESD driver railed negative on May 22nd and we didn't discover it and fix it until Jun 11th, which had flipped ETMY ESD's actuation sign (LHO aLOG 19110). Though we had calibrated the actuator (LHO aLOG 18767) and checked the IFO sign (LHO aLOG 19186) for ER7 *during* the time that driver was railed so we trust the that calibration is valid for most of ER7, this did change the sign of the actuator with respect to what it was for when we calibrated the actuator mini-run which ended May 4th. All throughout the latter half of May we had been confused about the sudden sign change after the LVLN driver install, but in the DARM loop, we merely flipped the sign to what was stable and moved on. Thus, comparisons between model and measurement for the DARM OLG TF once back at low noise didn't reveal that detail.
Could this be the problem? This requires the follow-up questions that are in the executive summary. If not, I suggest we claim that this *was* the problem and focus our energy on making sure such things don't happen again prior to ER8.


