8:52 Sudarshan work on ISS
Fil to EX (run cables)
9:16 Jordan to HAM6 checking on PEM sensors
9:44 Kyle to HAM6
10:01 Kyle grab He bottle at EY
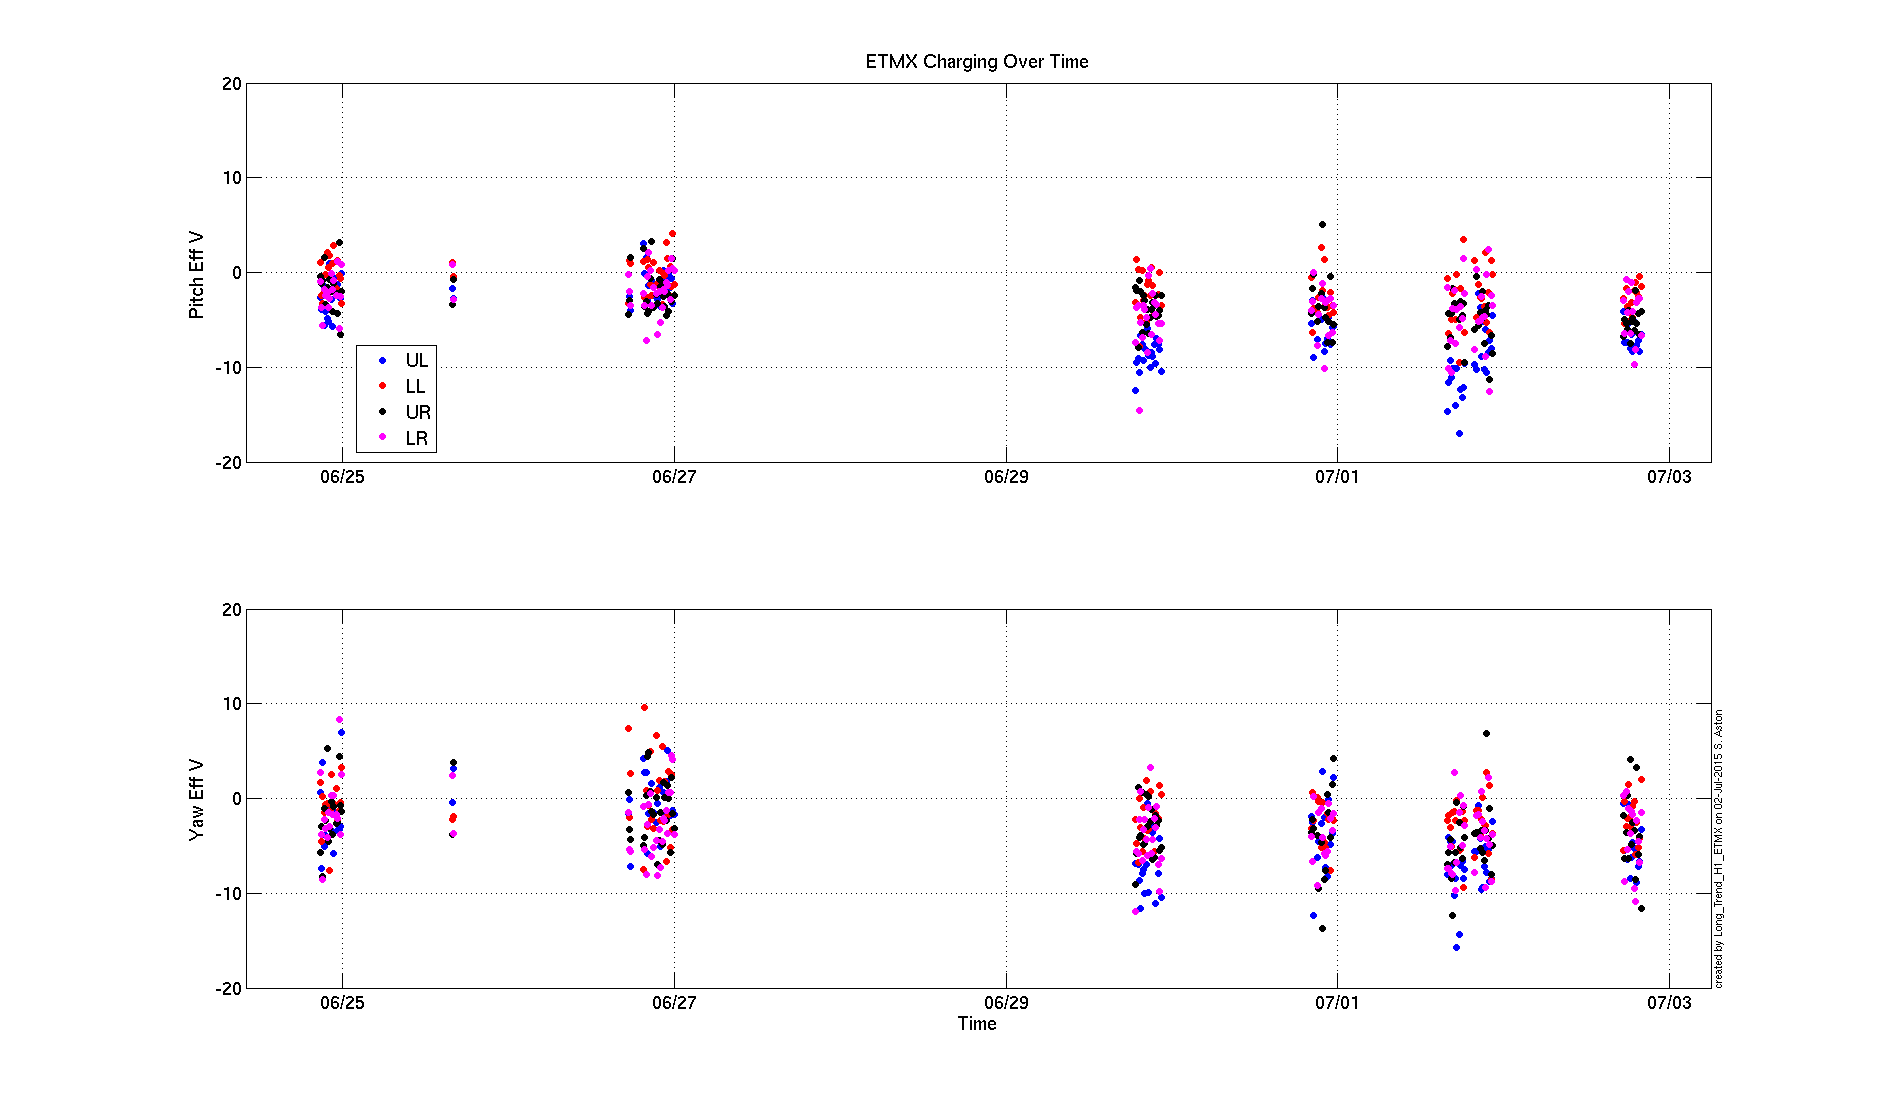
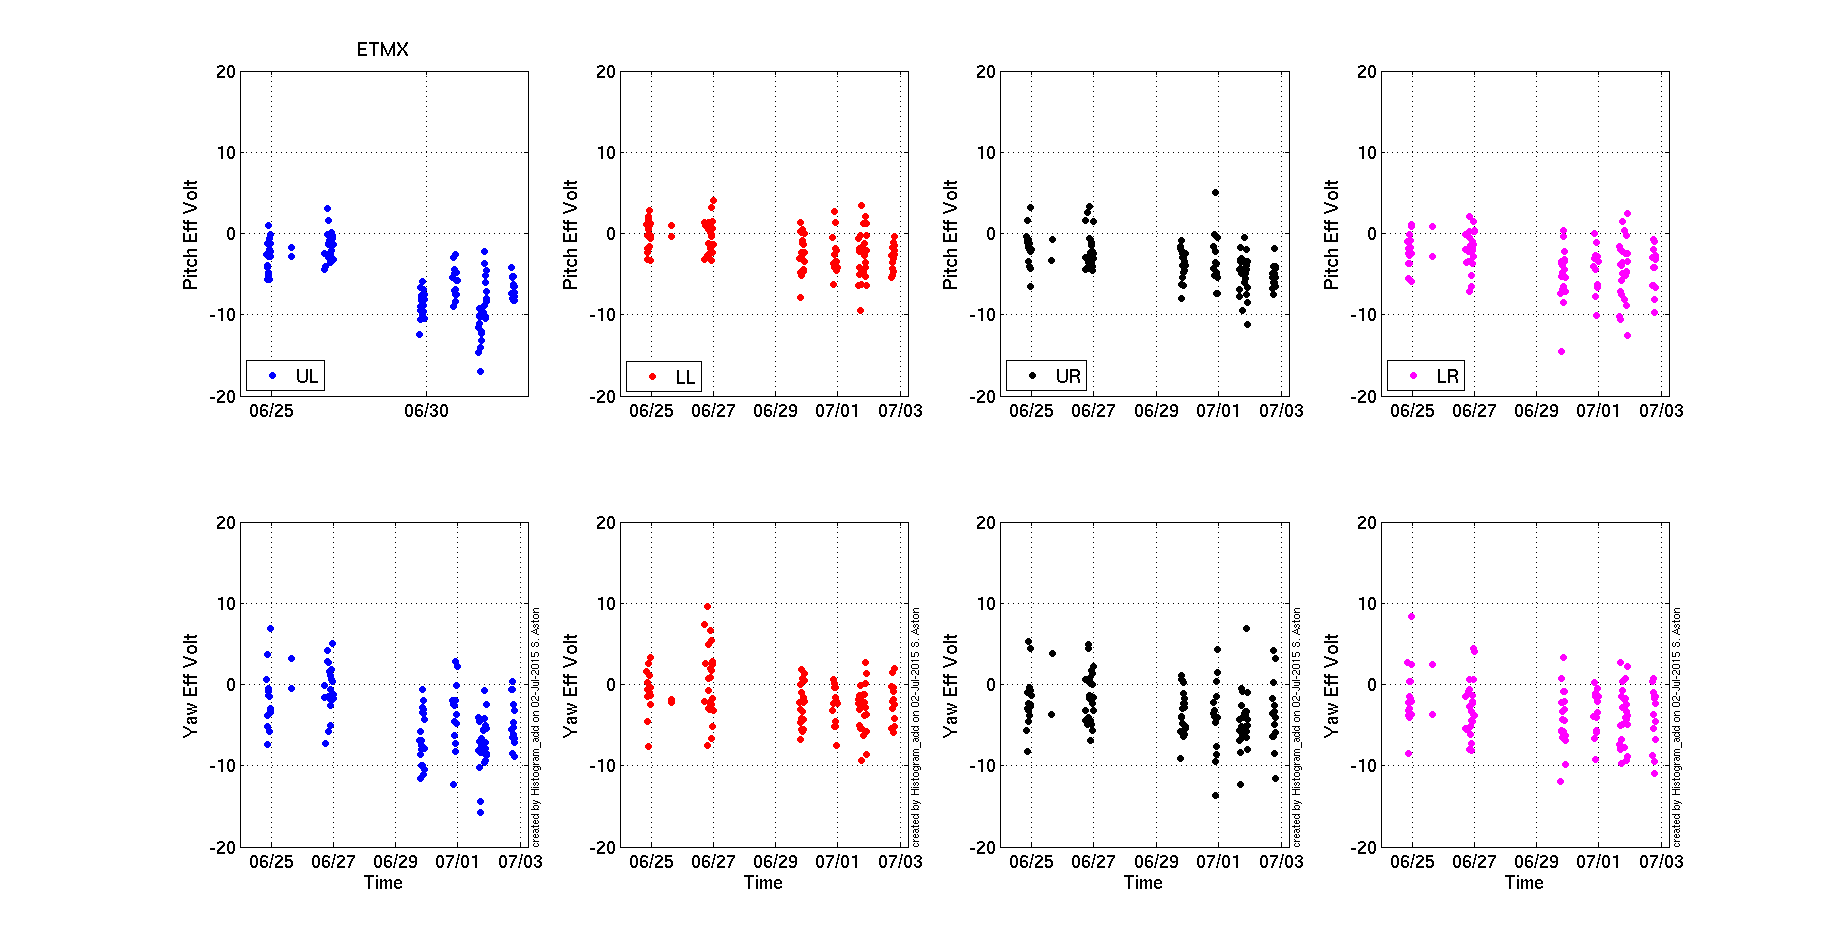
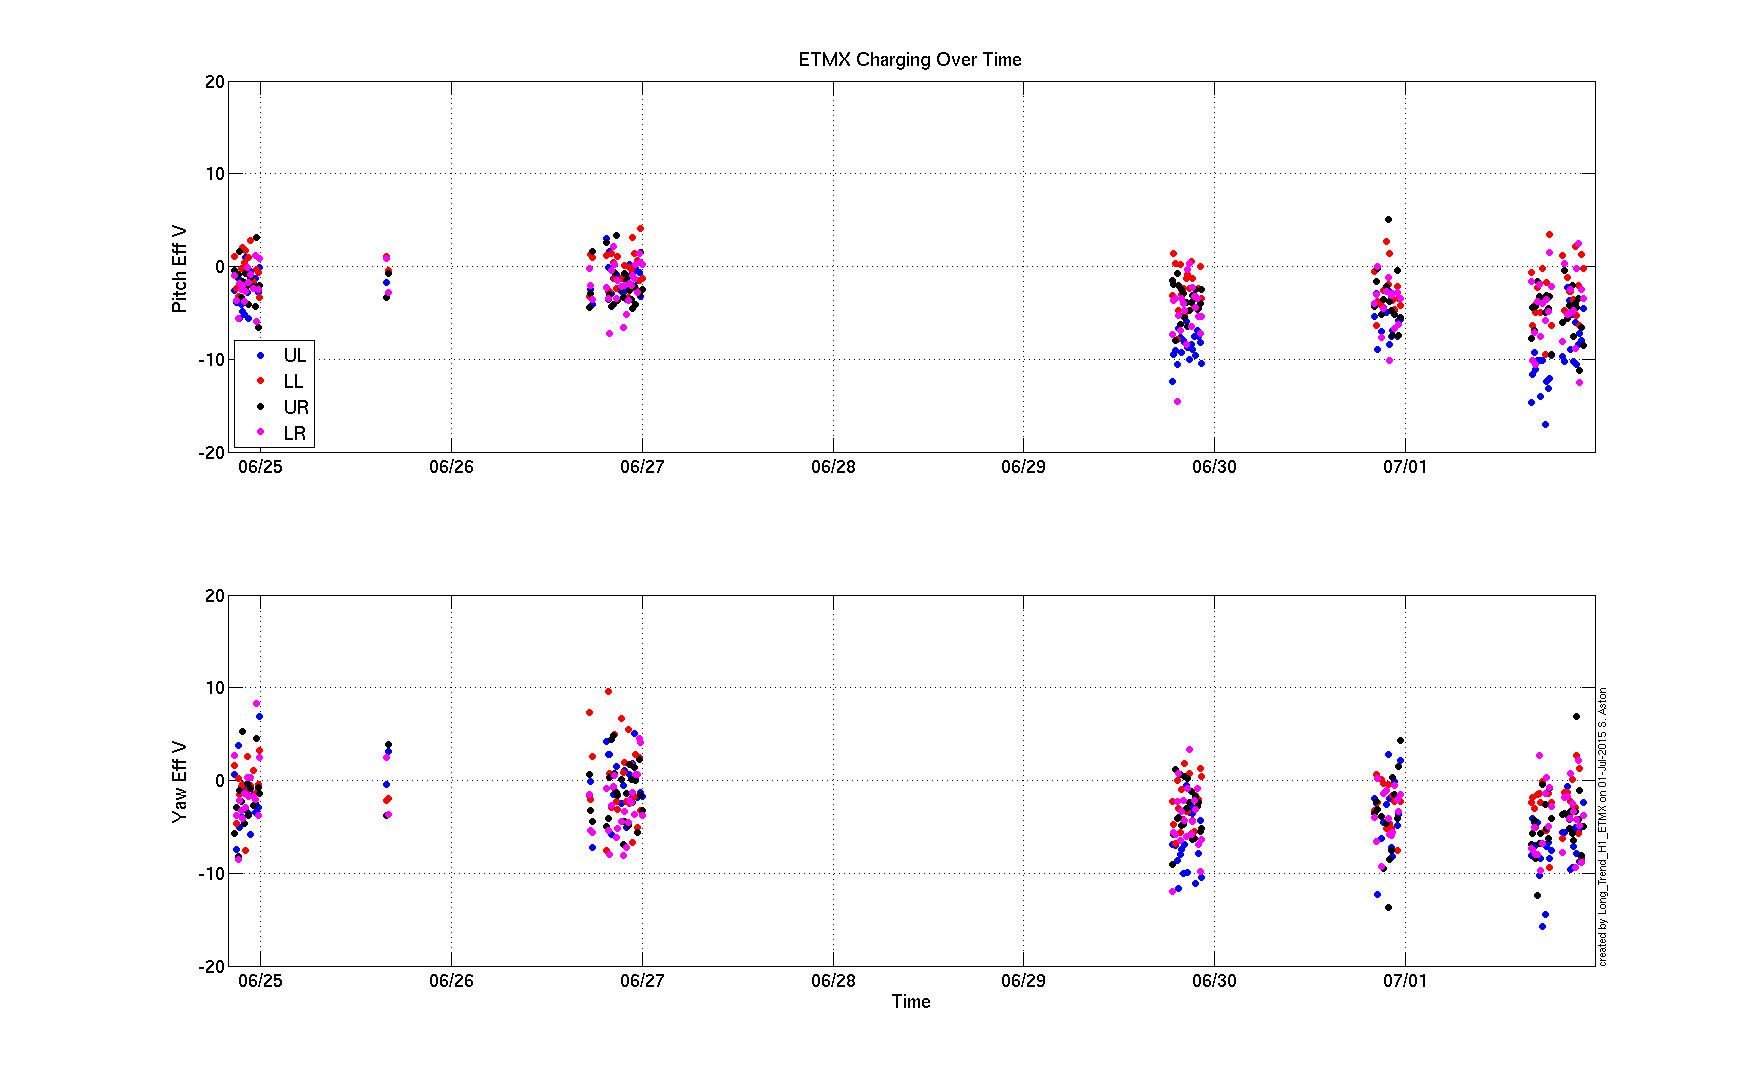
10:15 Leo - EX ESD measurement
10:20 Kyle out of EY
11:25 Dave and Stefan to EY - Hook up GPS receiver
11:32 Fil & Andrea back from EY
11:50 Jordan to LVEA testing PEM accelerometer
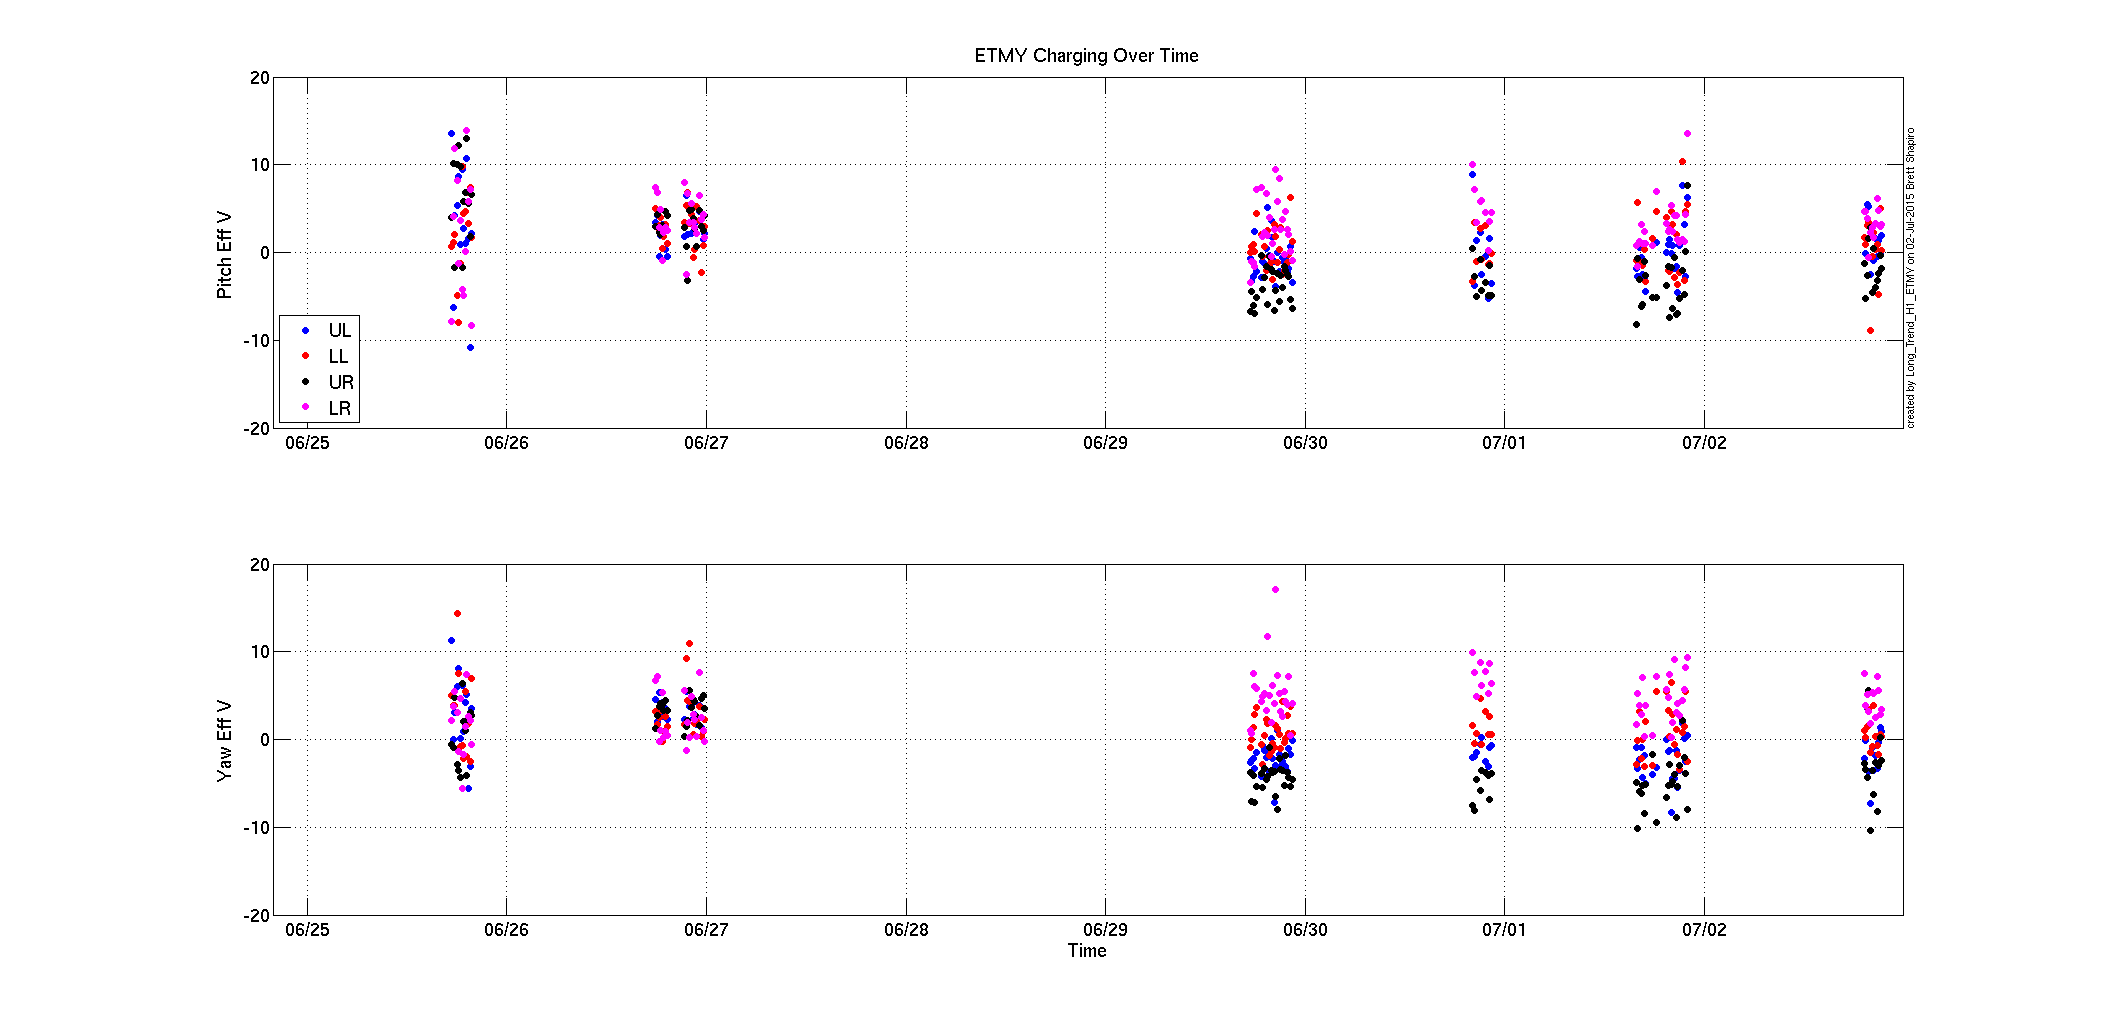
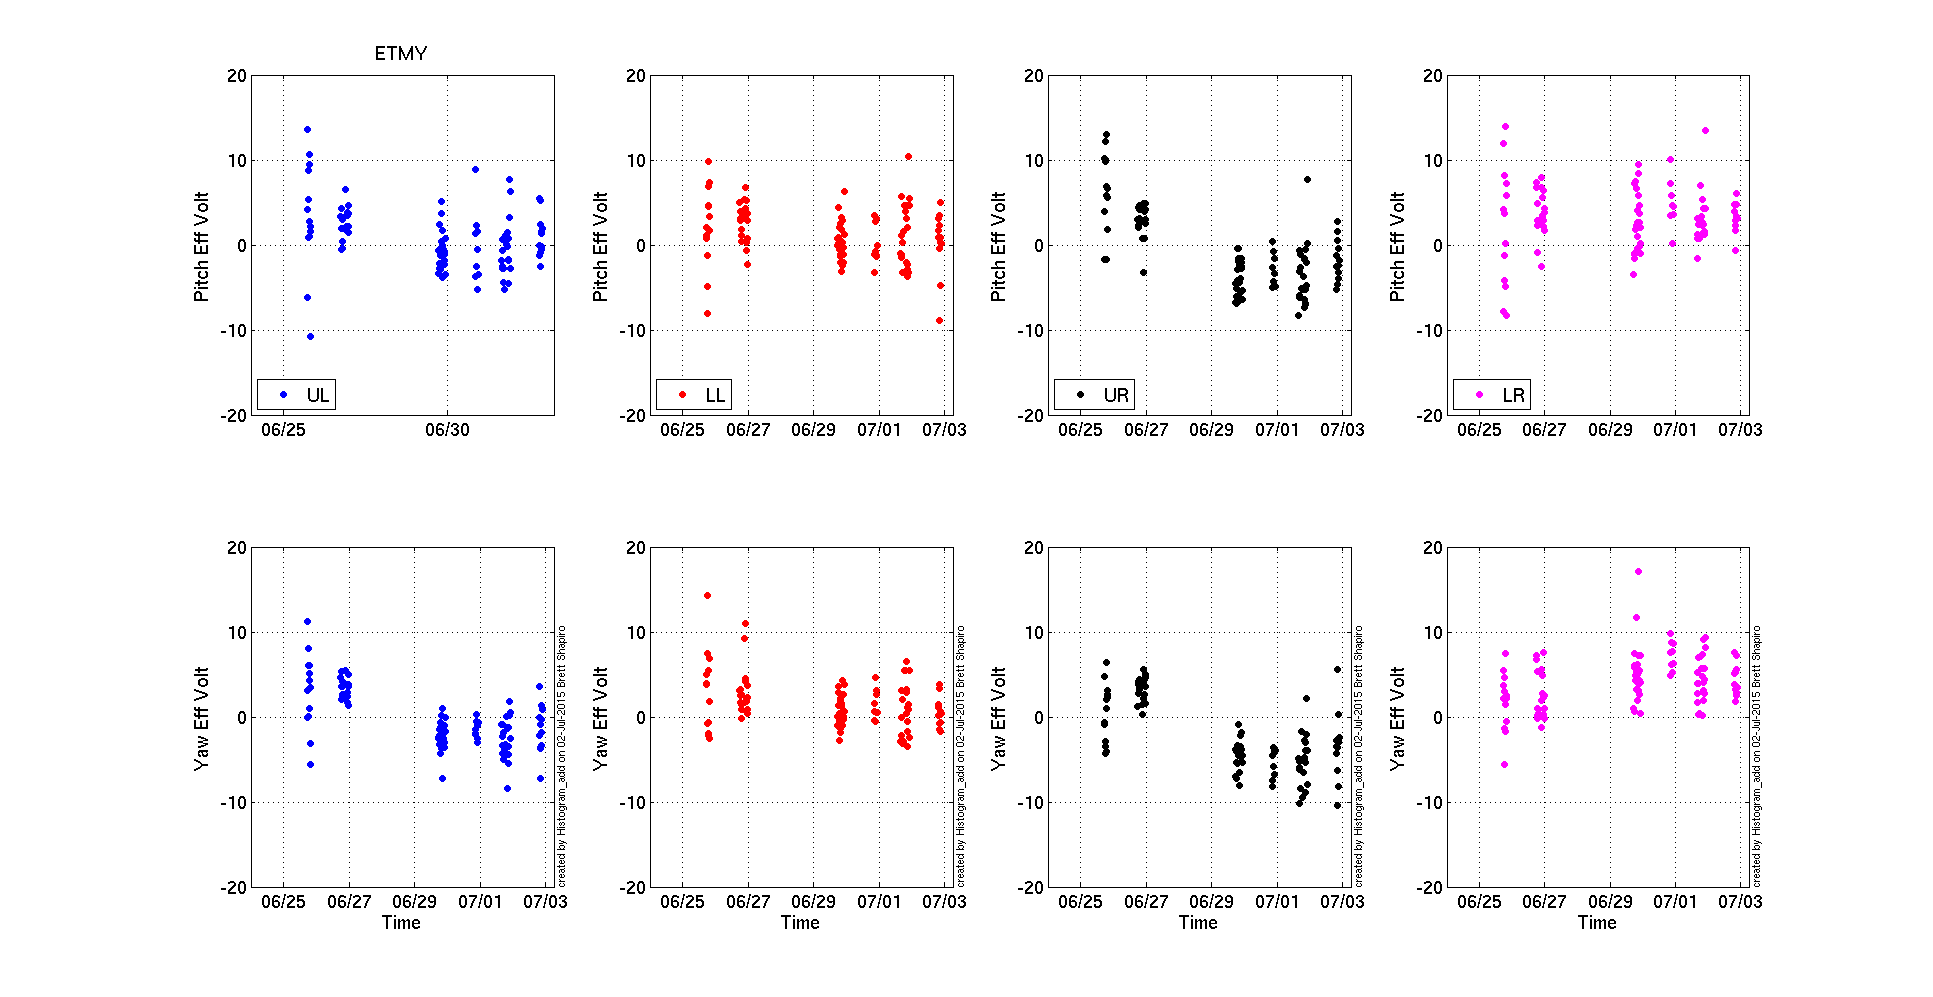
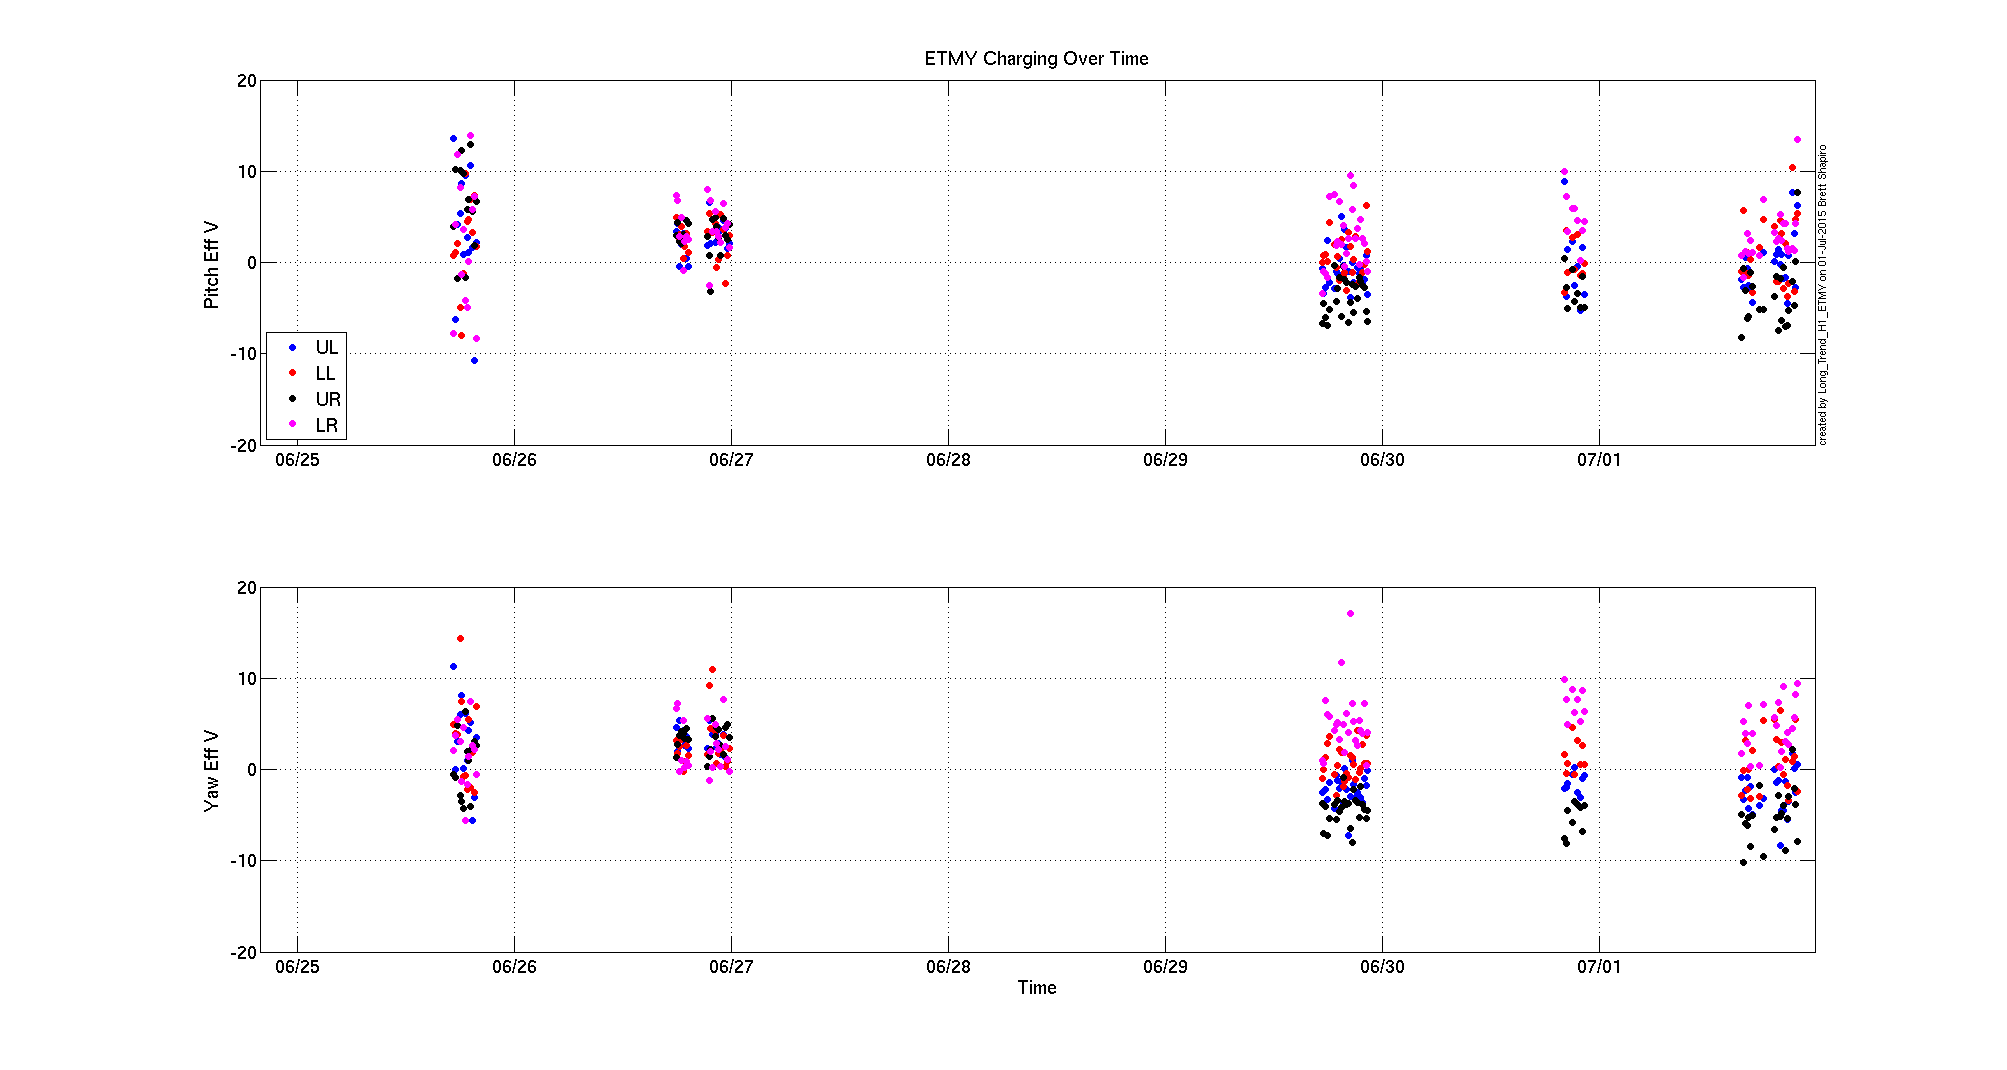
12:04 Leo done with EX ESD measurement. Starting EY ESD measurement.
12:47 Jordan back
13:00 Kyle to EX
12:42 ISI HAM5 tripped
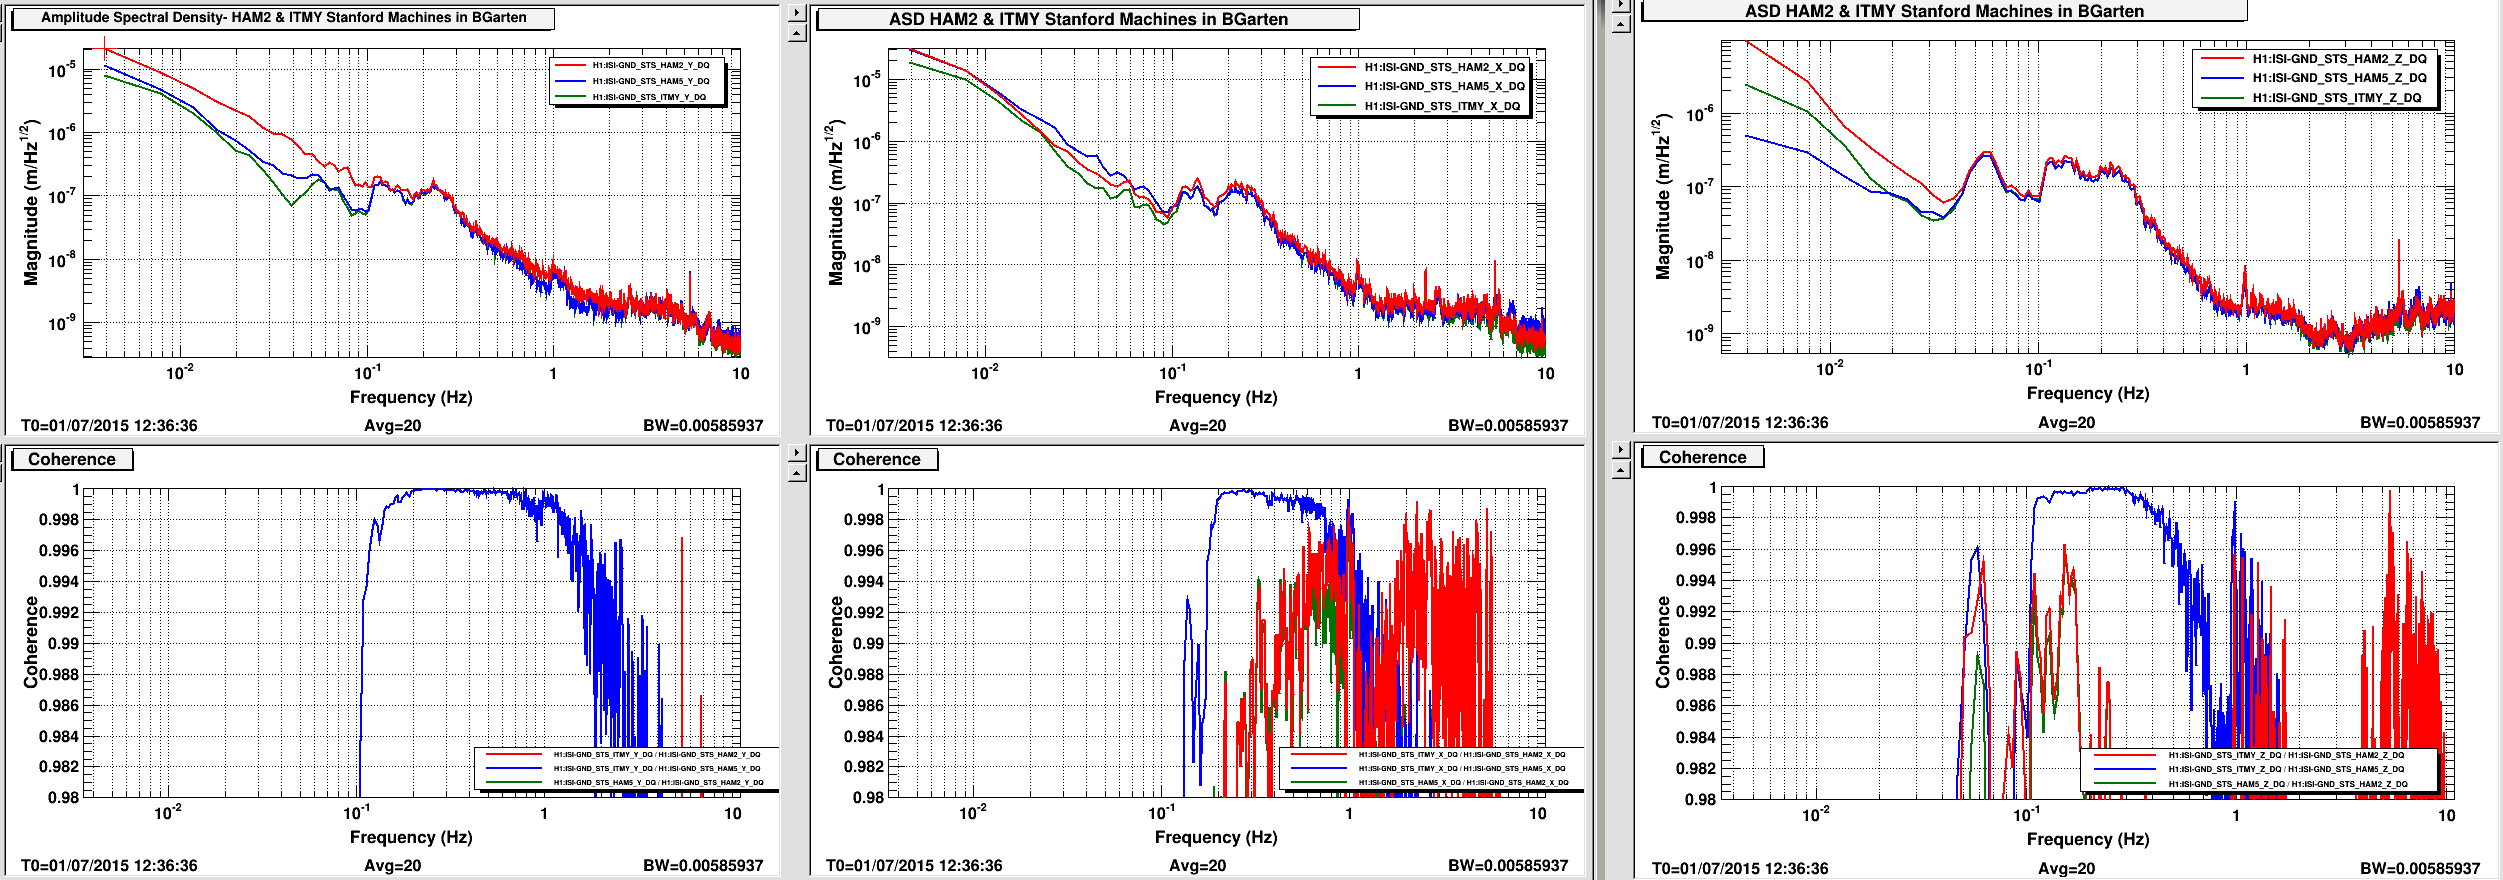
-No correlation with PEM acc. sensors. Not sure what happened. Coincides with sharp peak on 1-3 Hz ground motion plot. Suspect electronics issue.
13:42 Fil and Stefan to EX by the rack
13:53 Jordan to EX
14:12 Leo finished EY ESD measurement
14:24 Rick and Sudarshan to LVEA - ISS work by PSL enc.
Kyle back
14:37 Jordan to EY
15:00 Fil & Stefan back
15:10 Rick & Sudarshan back
15:19 Sudarshan & Jordan to IOT2R table
15:27 Kyle to HAM6
15:41 Kyle back. Shutdown HAM5, HAM6 annulus pump.
Other notes:
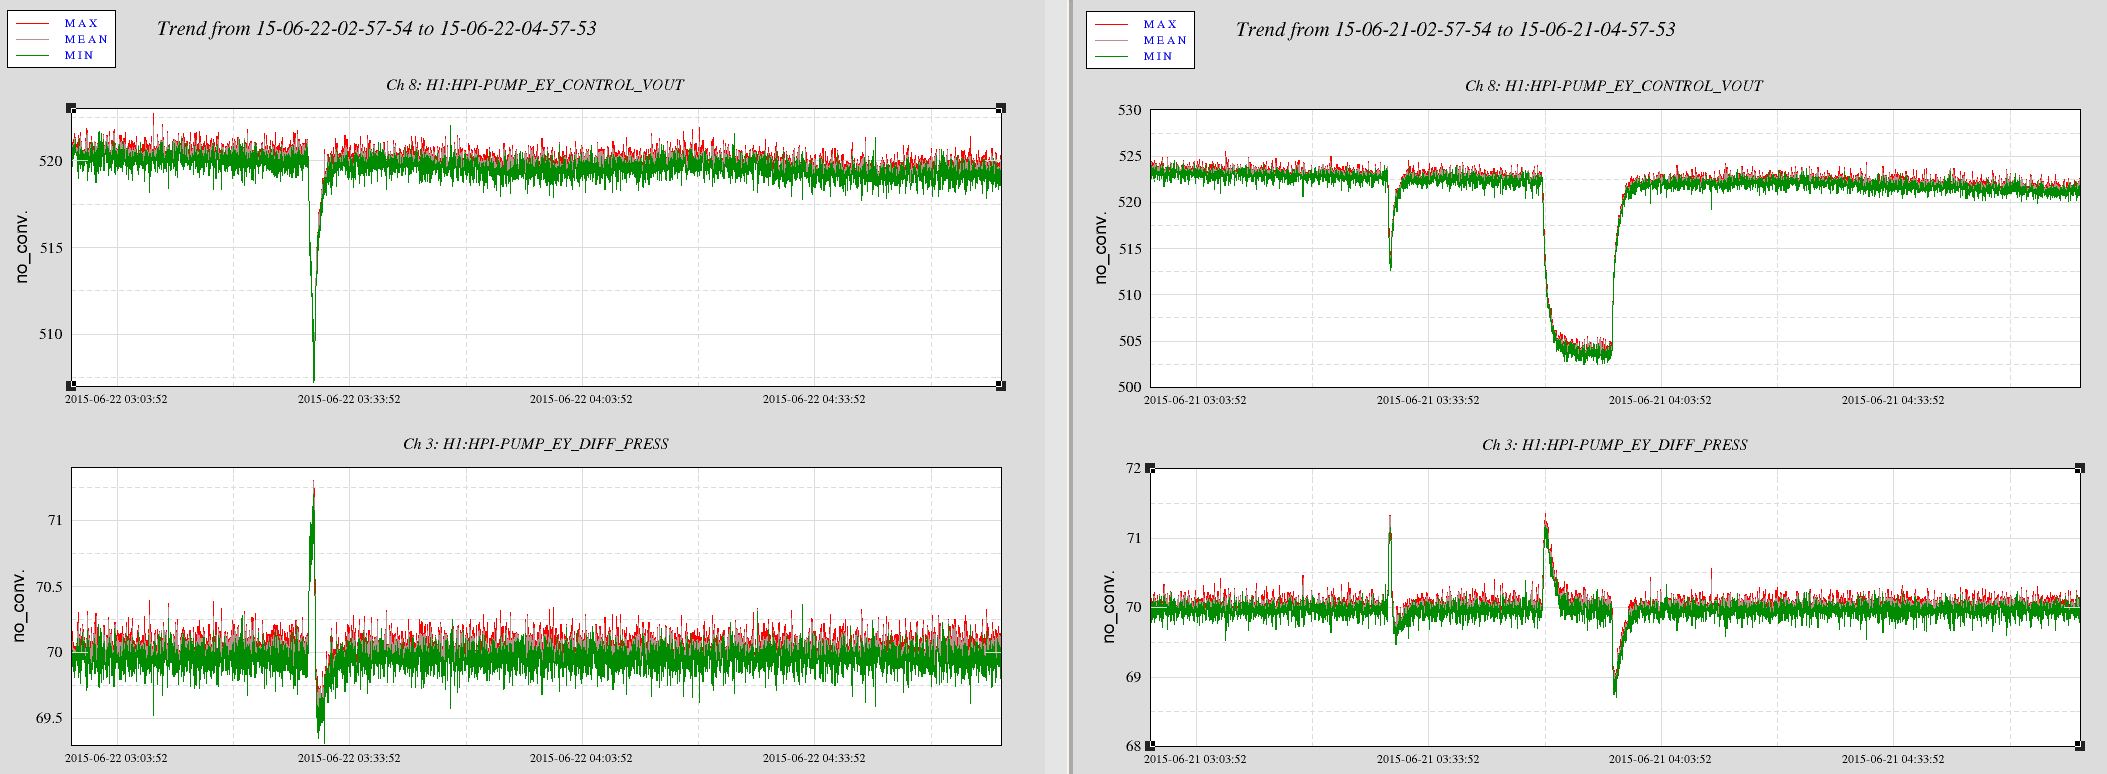
- Jordan discovered magnetometer at EY rack output straight line since June 22nd.
- Laser Hazard notifications added to Ops Overview.
HAPPY HOLIDAY!!!!


