This is a follow up entry of LHO ALOG 17601.
A couple of days ago, the discrepancy of the response for DCPDA and DCPDB were found. This was basically caused by misadjusted filter modules for the anti-whitening filters. Some of them were using design values (like Z10:P1) and some others were just left as they had been imported from the LLO setup.
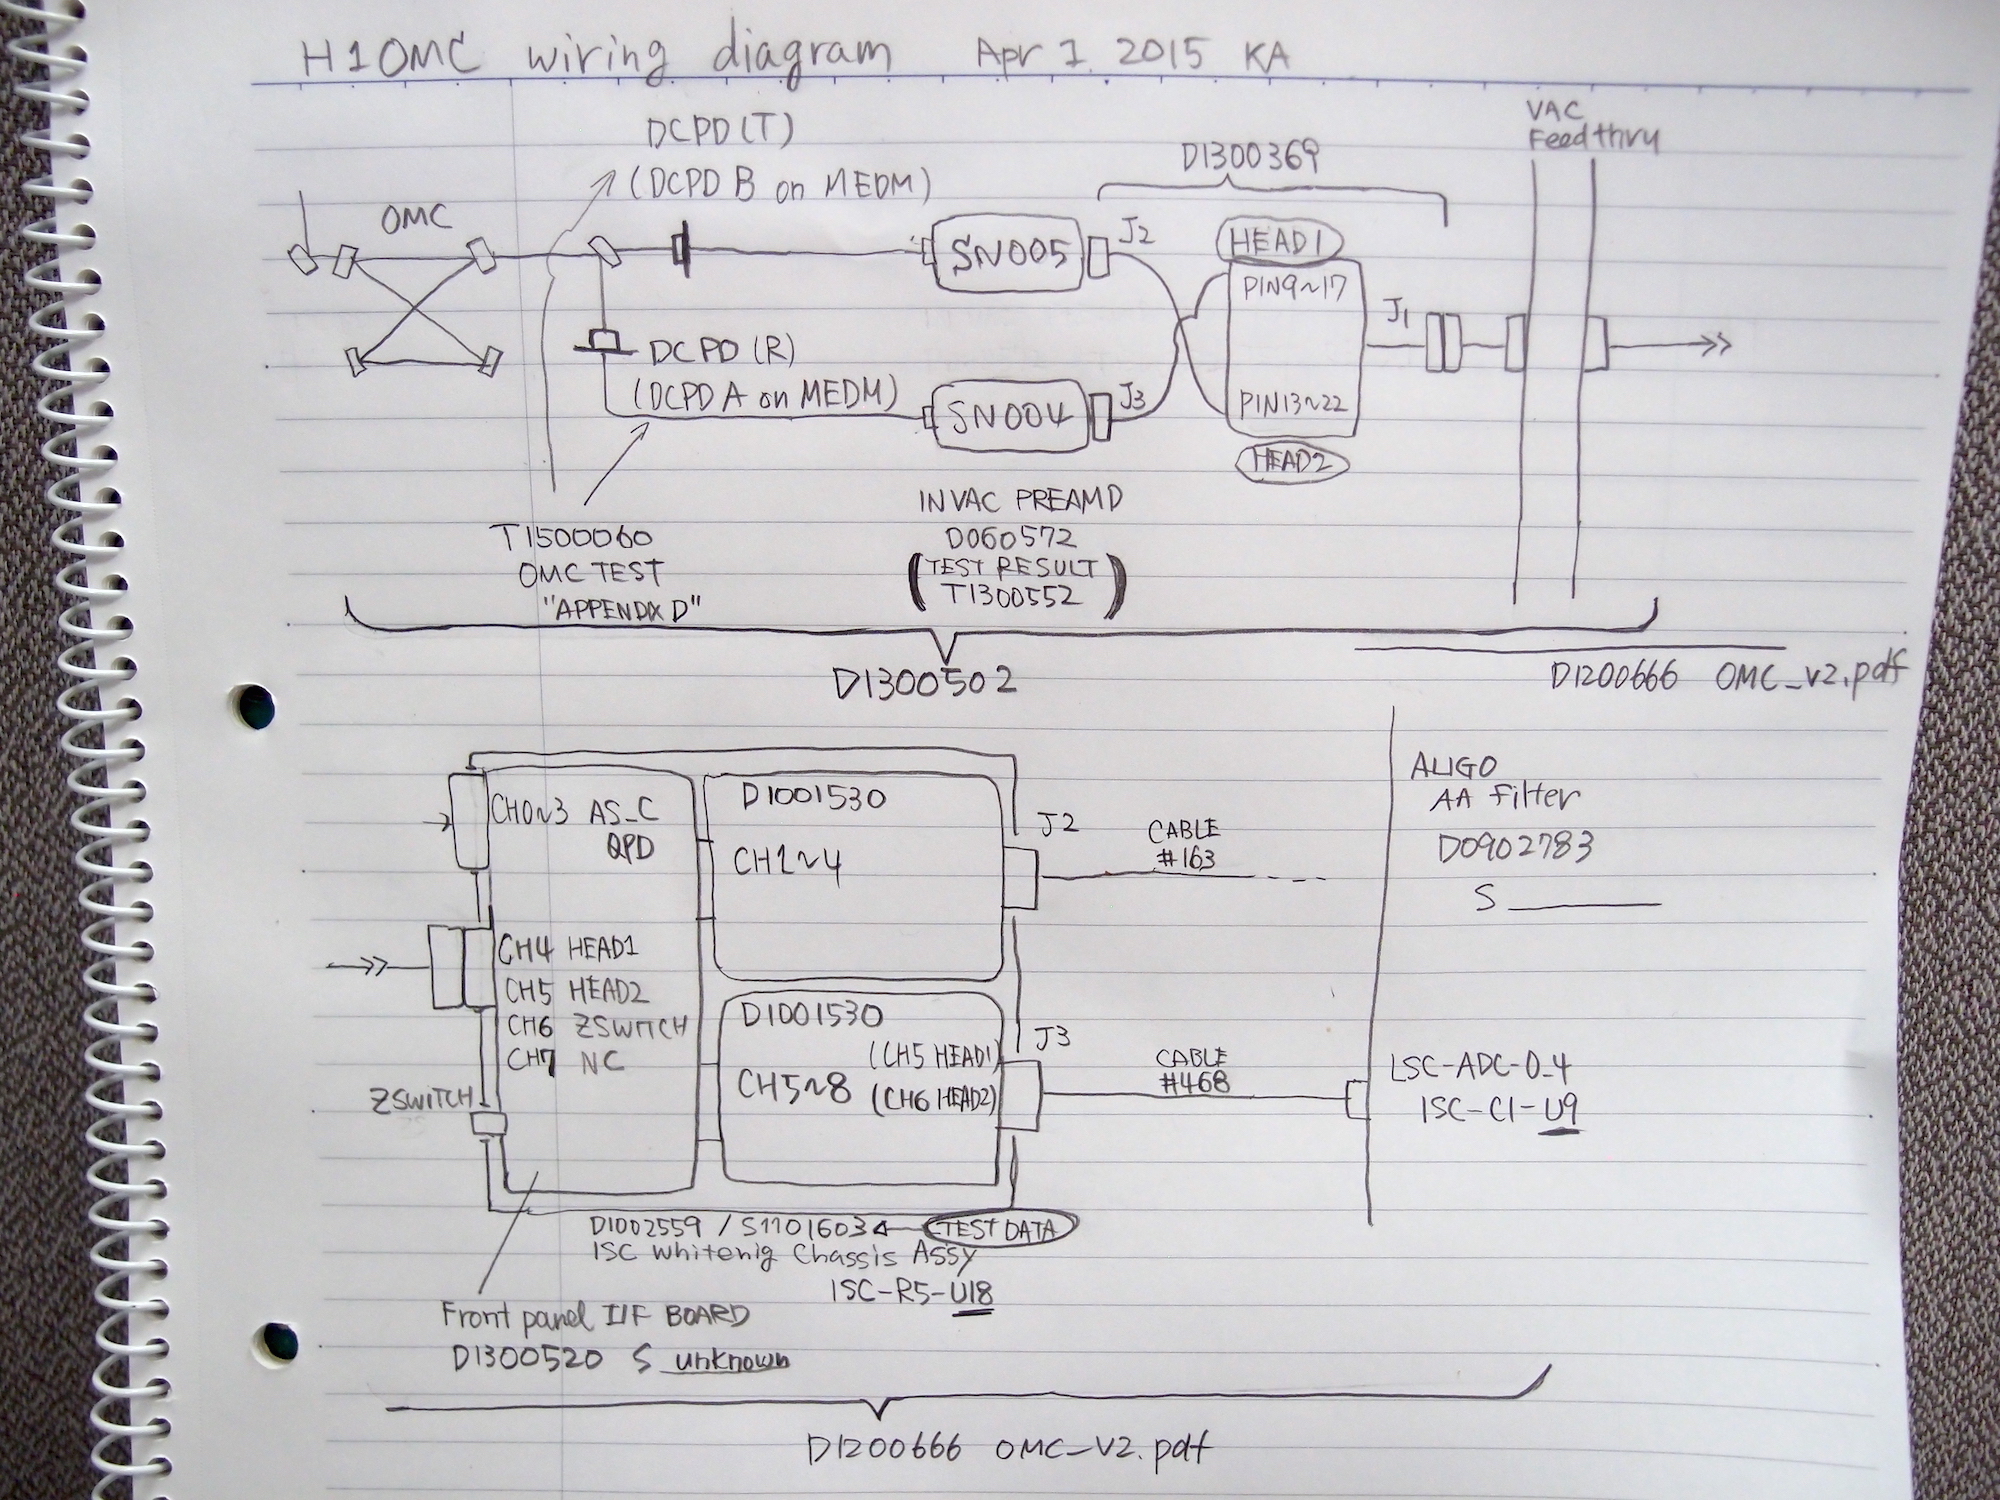
In order to correctly take the whitening transfer functions into account, the wiring of the in-vacuum and in-air connections were necessary to be tracked down. The 1st attachment shows the sufficiently detailed wiring chain for this task. Using the test data (links indicated in the diagram), we can reconstruct what the correct anti-whitening filters should be. The summary can be found below.
[Trivia for Rich: DCPD1 (Transmission side of the OMC BS) is connected to HEAD2, and DCPD2 (Relfection side of the OMC BS) is connected to HEAD1. This is because of twisted D1300369. This cable has J2 for HEAD2 and J3 for HEAD1. This twist exists in LLO and LHO consistently, as far as I know]
=======
Characteristics of the DCPD electronics chain
Complex poles/zeros are expressed by f0 and Q
DCPD A
(DCPD at the transmission side of the OMC DCPD BS)
- Preamp D060572 SN005
Transimpedance: Z_LO = 100.2, Z_HI = 400.0
Voltage amplification ZPK: zeros: 7.094, 7.094, (204.44 k, 0.426), poles: 73.131, 83.167, 13.71k, 17.80k, gain: 1.984
- Whitening filter D1002559 S1101603
(This document defines the gain not at the DC but at a high frequency. The gain below is defined as a DC gain.)
CH5 Whitening
Filter 1: zero 0.87, pole 10.07, DC gain 10.36/(10.07/0.87)
Filter 2: zero 0.88, pole 10.15, DC gain 10.36/(10.15/0.88)
Filter 3: zero 0.88, pole 10.20, DC gain 10.36/(10.20/0.88)
Gain: “0dB”: -0.051dB (nominal), “3dB”: 2.944dB, “6dB”: 5.963dB, “12dB”: 11.84dB, “24dB”: 24.04dB
DCPD B
(DCPD at the reflection side of the OMC DCPD BS)
- Preamp D060572 SN004
Transimpedance: Z_LO = 100.8, Z_HI = 400.9
Voltage amplification ZPK: zeros: 7.689, 7.689, (203.90 k, 0.429), poles: 78.912, 90.642, 13.69k, 17.80k, gain: 1.983
- Whitening filter D1002559 S1101603
CH6 Whitening
Filter 1: zero 0.88, pole 10.13, DC gain 10.41/(10.13/0.88)
Filter 2: zero 0.87, pole 9.96, DC gain 10.40/( 9.96/0.87)
Filter 3: zero 0.88, pole 10.15, DC gain 10.41/(10.15/0.88)
Gain: “0dB”: -0.012dB (nominal), “3dB”: 2.982dB, “6dB”: 6.007dB, “12dB”: 11.87dB, “24dB”: 24.04dB
=======
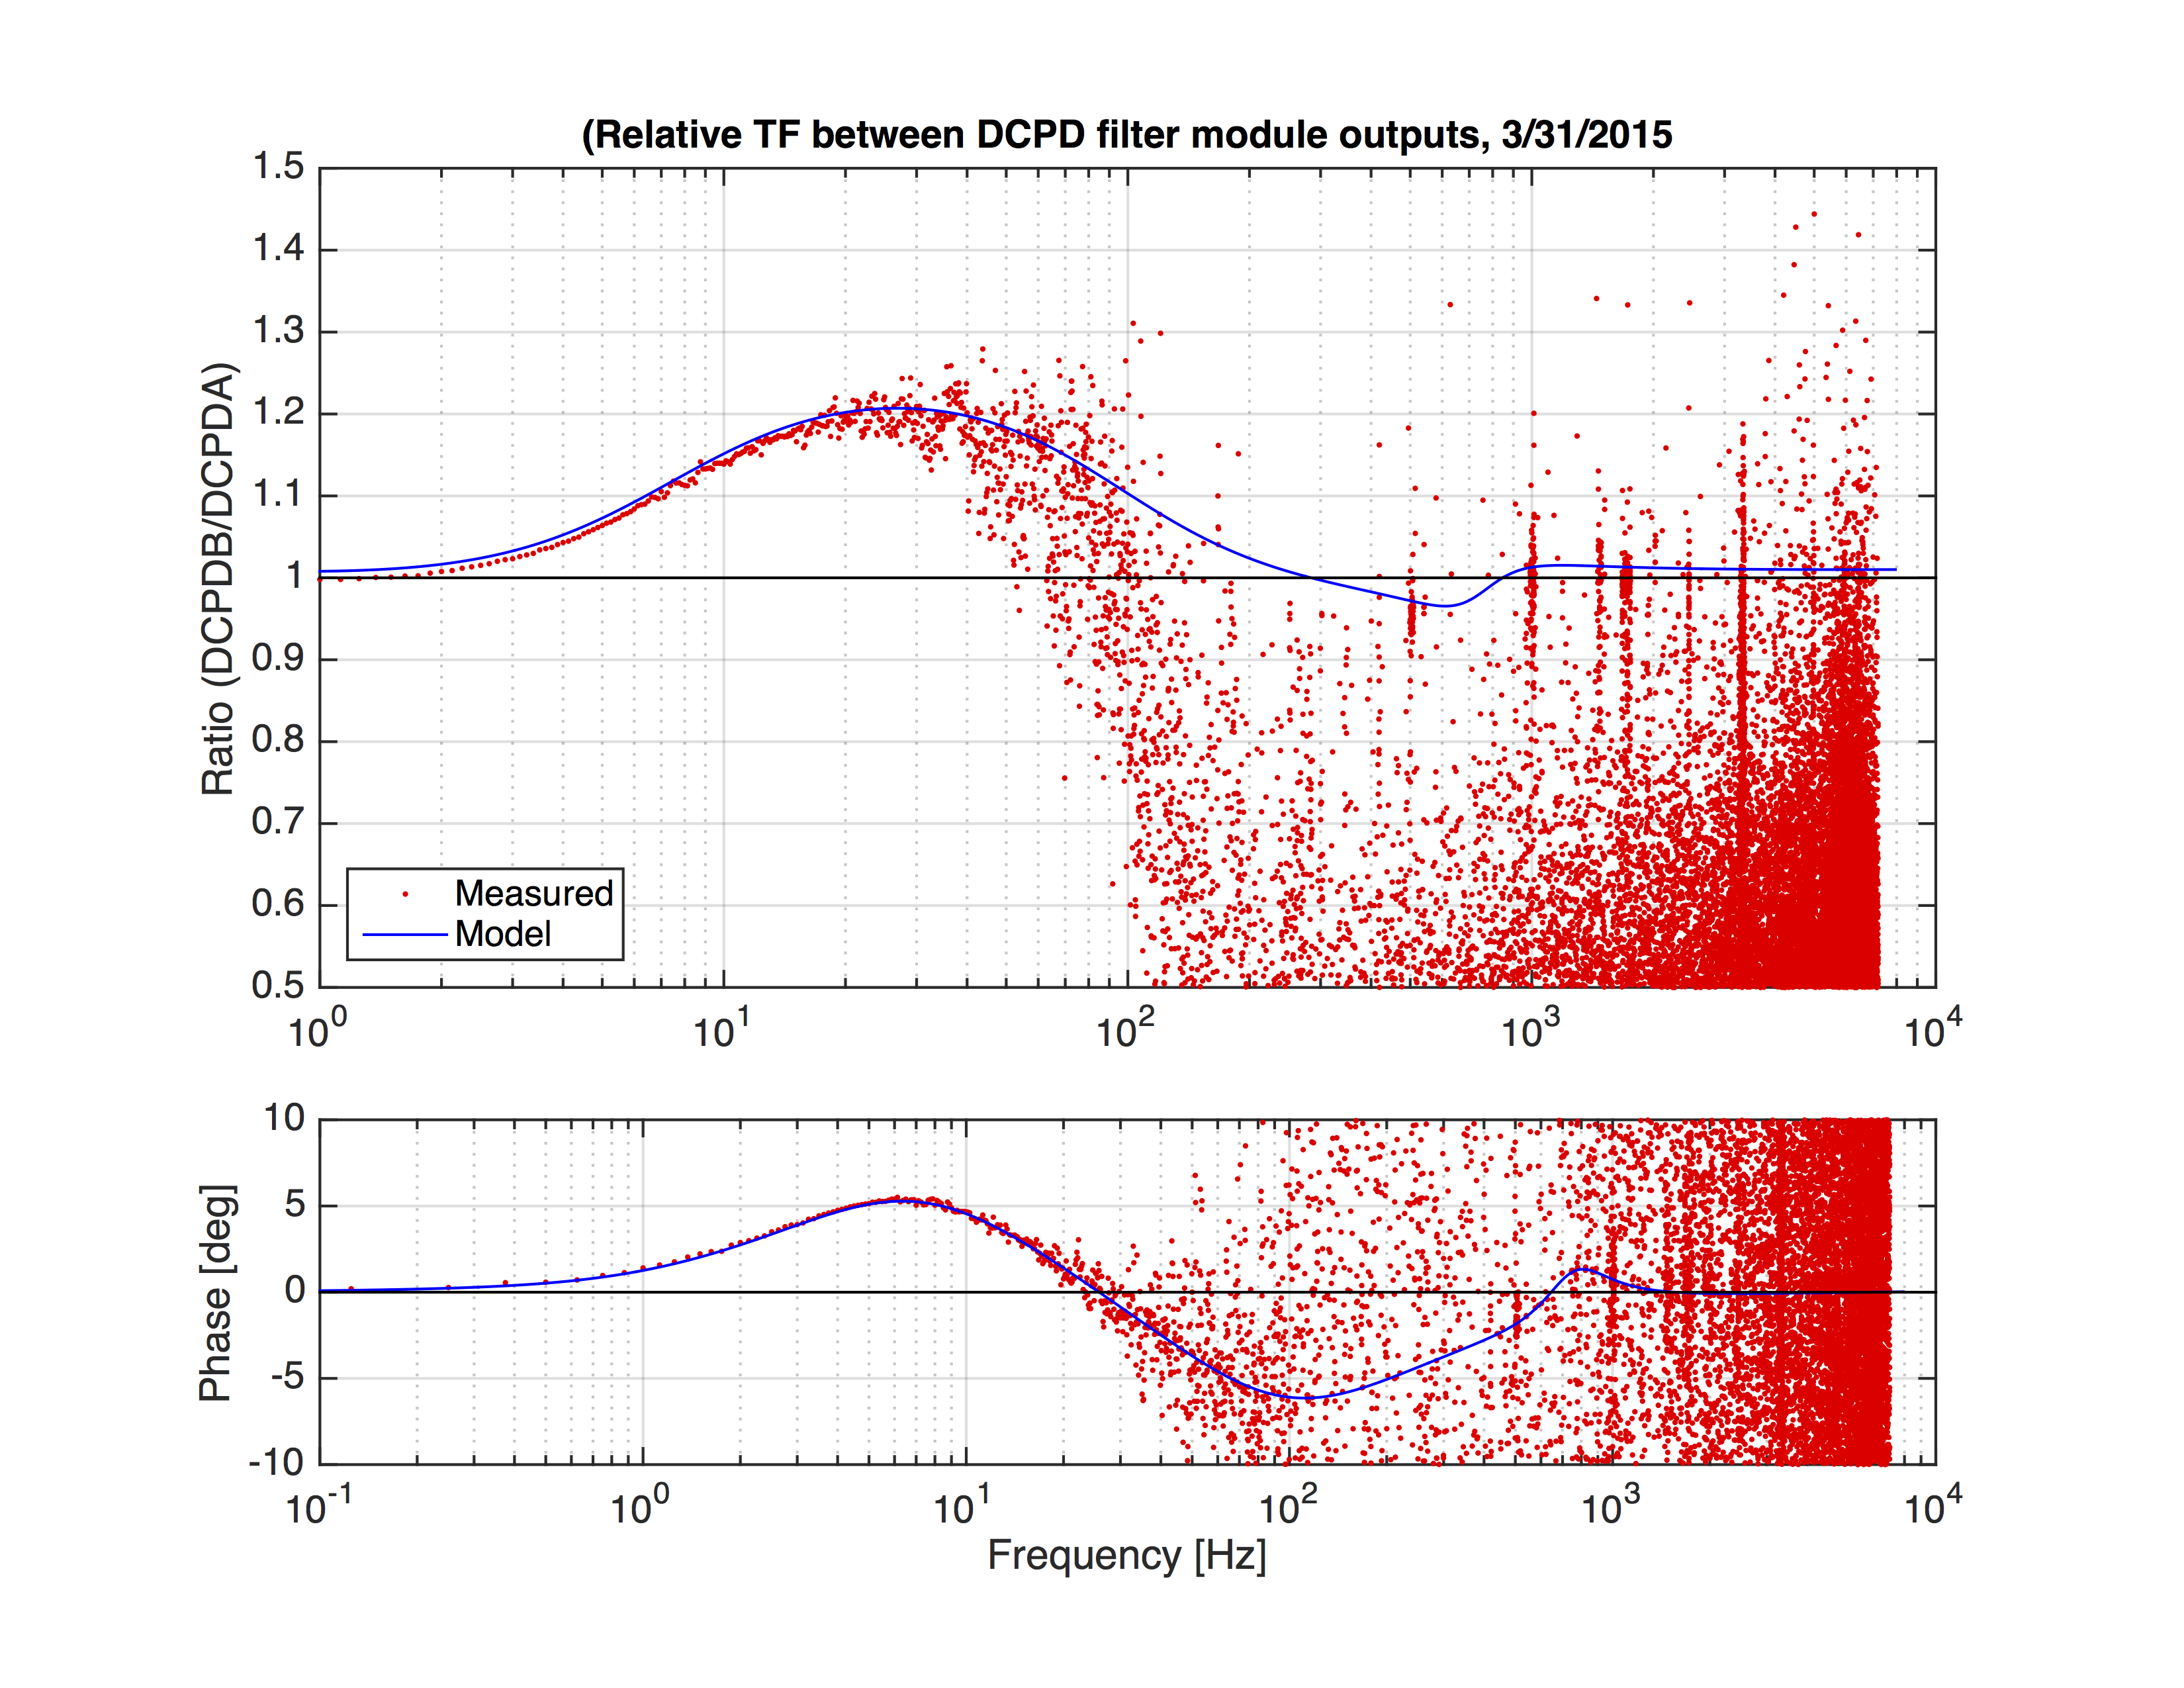
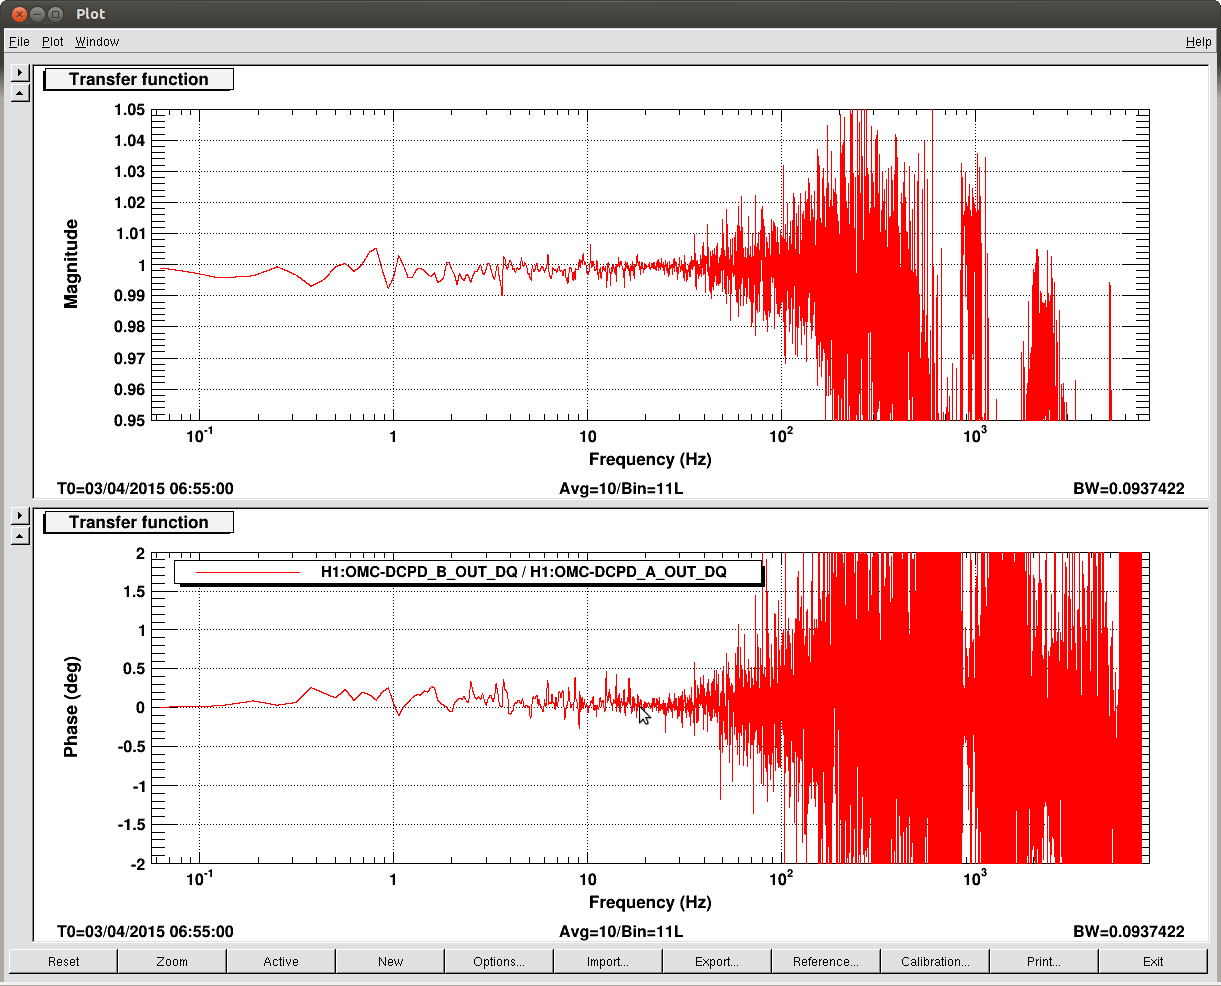
Now we put these transfer functions into the model and check if we can reproduce the observed relative difference (Attachment 2). In deed, the measurement is well explained by the model below 30Hz where the measurement S/N was good. As we saw in the previous entry, the difference of the DCPDA and DCPDB after the whtening compensation is 20% max. Note that further inspection revealed that this 20% difference is, in fact, mostly coming from the difference of the preamp transfer functions rather than the miscompensation.
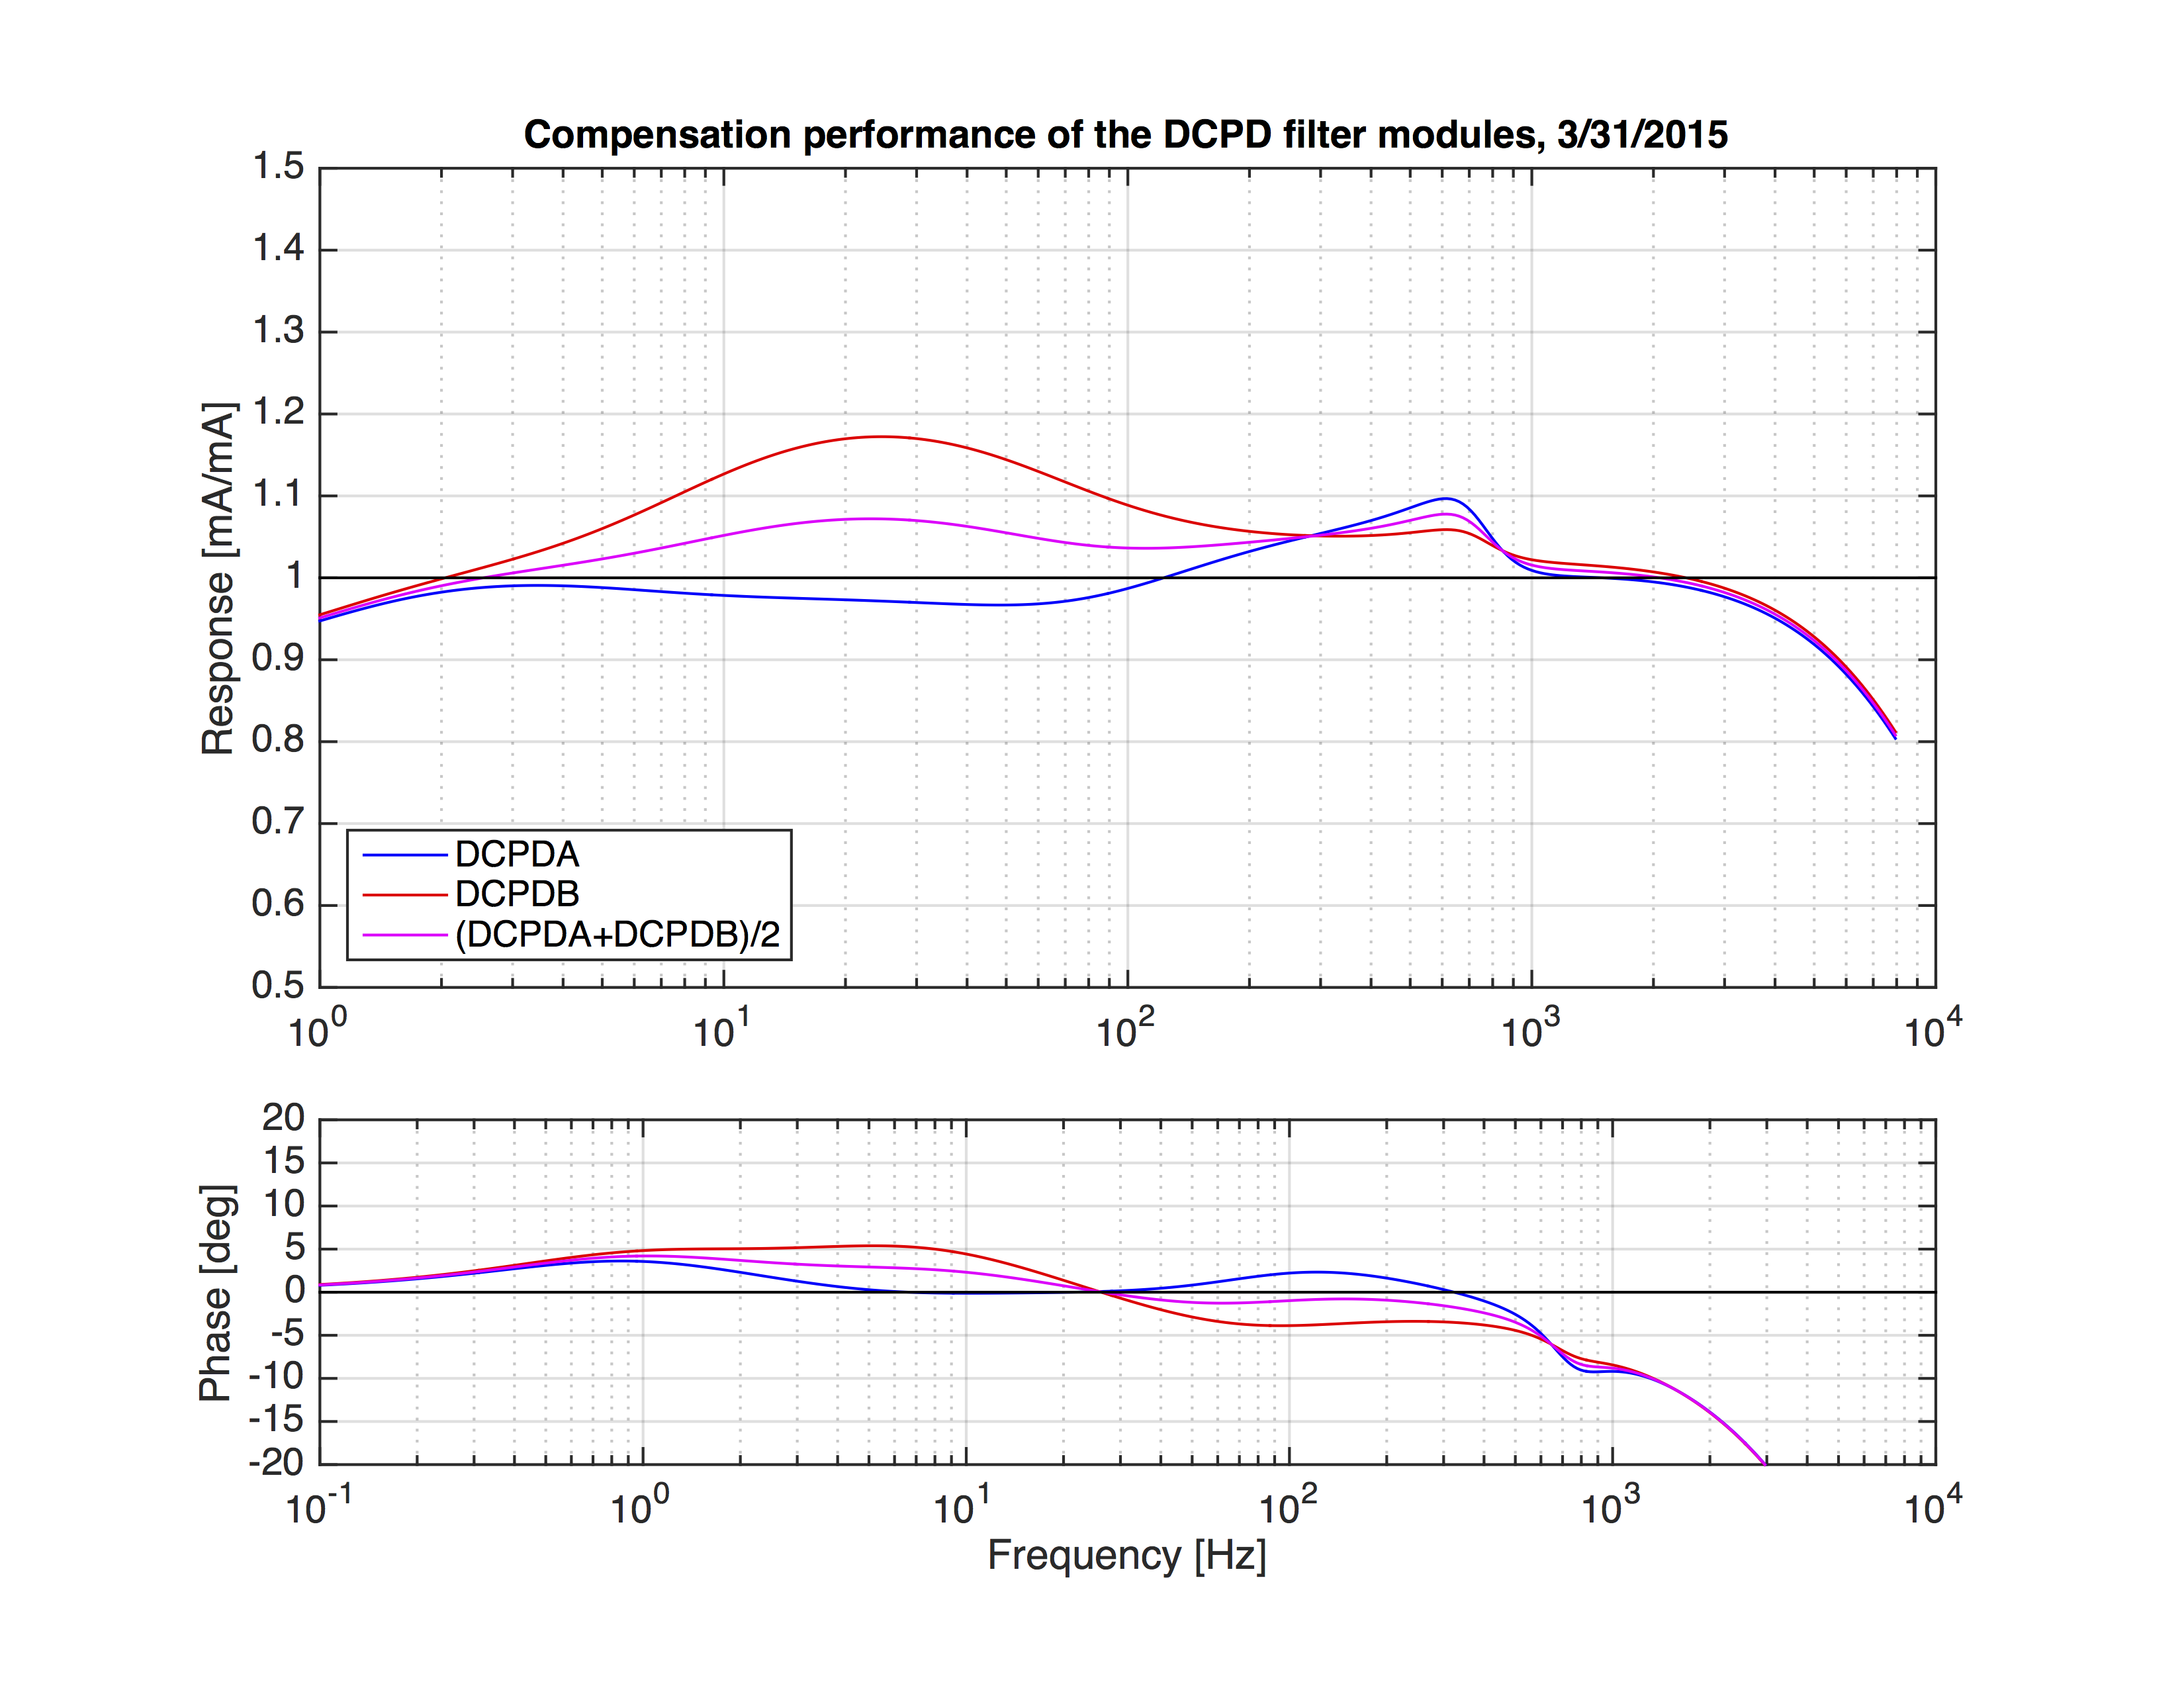
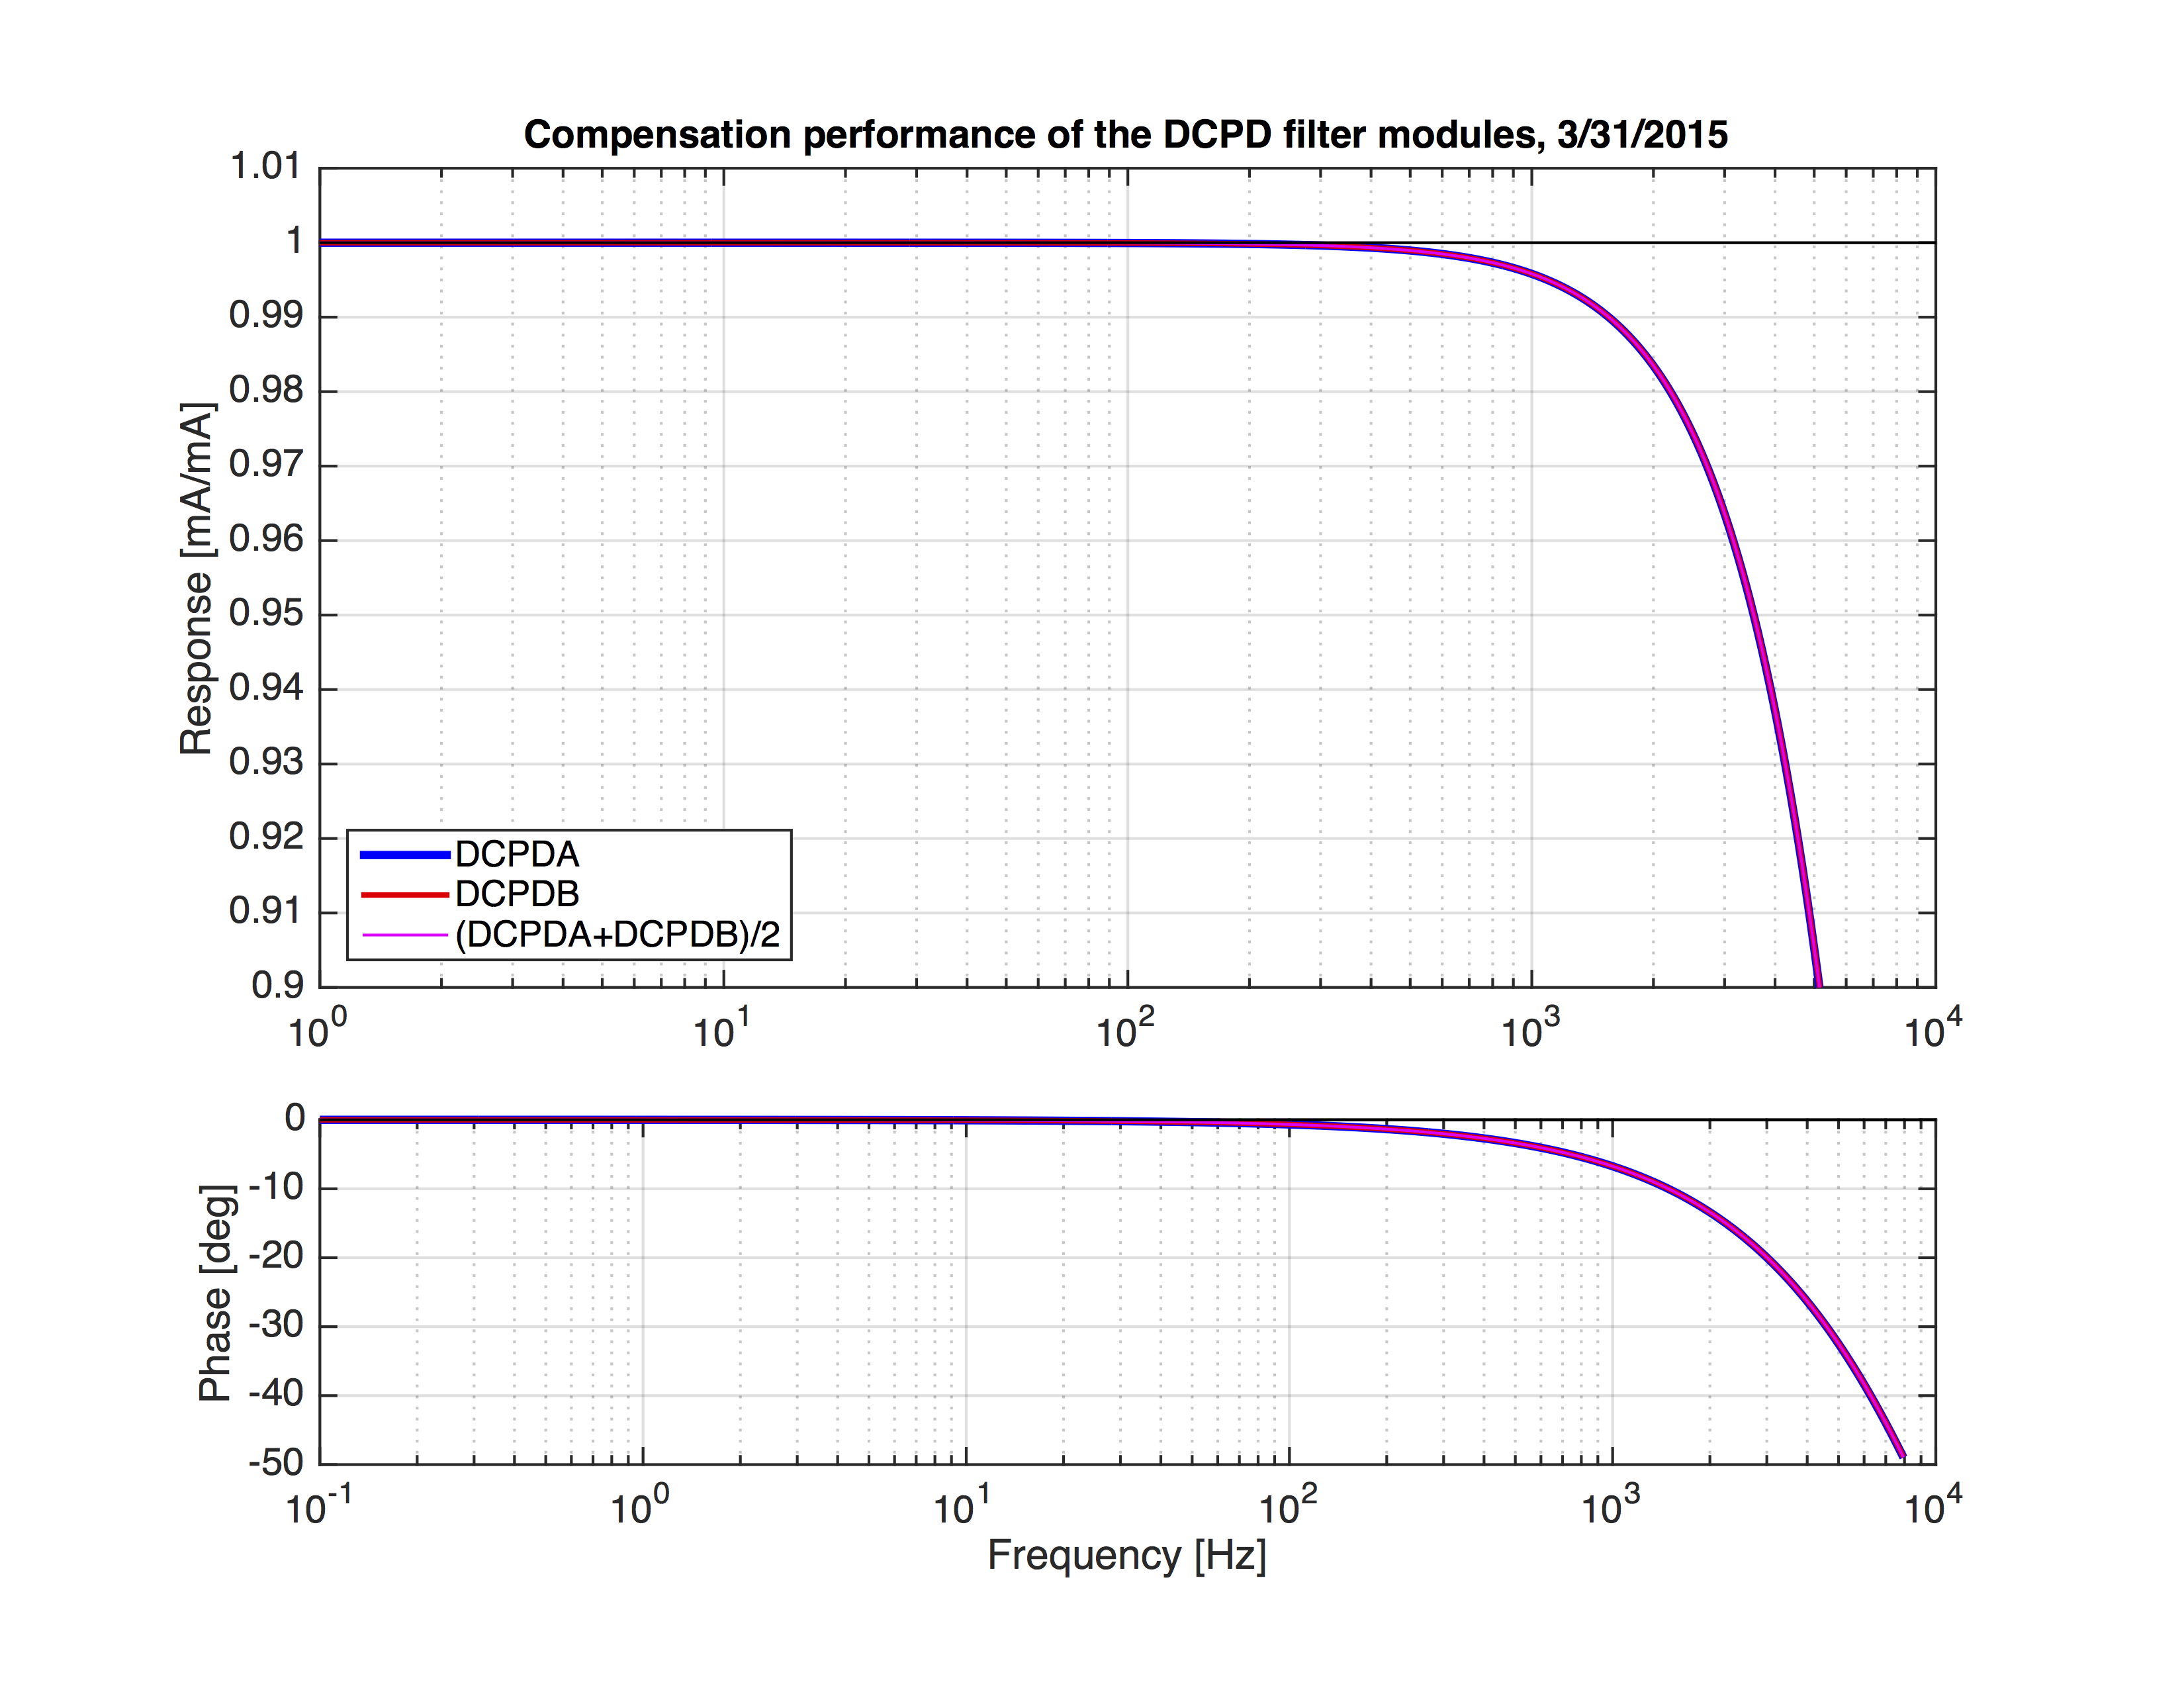
So this was the relative calibration between DCPDA and DCPDB. How is the compensation performance of each one? The 3rd attachment shows how much of current we get at the output as H1:OMC-DCPD_A_OUT, H1:OMC-DCPD_B_OUT, and H1:OMC-DCPD_SUM_OUT, if we give 1mA of photocurrent to DCPD_A, DCPD_B, or both (half and half). Ideally, this should be the unity. The plot shows how they have not been adjusted. For the our main GW channel we take sum of two DCPDs. The individual deviations were averaged and thus the sum channel has max 10% deviation from the ideal compensation. This shows up in the GW channel.
=======
So let’s implement correct compensation. Basically we can place the inverse filter of the each filters. The preamplifier, however, includes some poles and zeros whose frequency are higher than the nyquist frequency. Here we just ignore them and assess how the impact is.
The result is shown as the 4th attachment. Upto 1kHz, the gain error is less than 1%. This increases to 5% above 3kHz. The phase error is 7deg at 1kHz. This increases to 20deg above 3kHz. These are the effect of the ignored pole/zeros. Note that these are static error. In fact, the phase error is quite linear to the frequency. Thus this behaves as a time delay of ~18.5us. Since the phase delay at 100Hz is small, the impact to the DARM feedback servo is minimal. For the feedforward subtraction, however, this might cause some limitation of the subtraction performance. In practice, we measure the coupling transfer function in order to adjust the subtraction, in any case. Therefore this delay would not be a serious problem.
The filter bank to implement the new compensation was already configured. The filter file is attached as foton_DCPDfilters.txt.
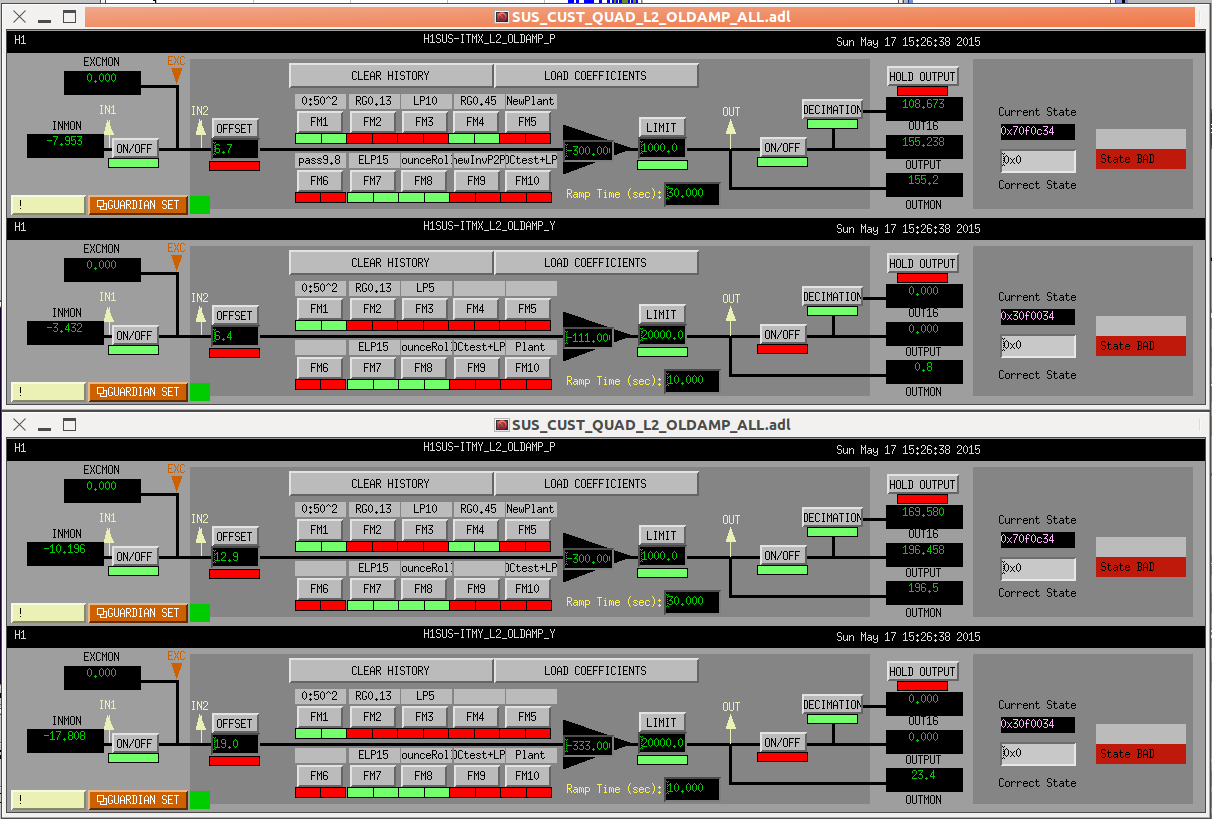


ITM pitch oplev damping can be left on the whole time.
Occasionally after a lockloss the loops may ring for a while, but I decreased the output limiting from 20 000 to 1000 ct to (hopefully) prevent this.