The HAM-ISI models, scripts and screens were successfully updated.
The update was tested on HAM2-ISI, before being ported to the other platforms. Test performed are:
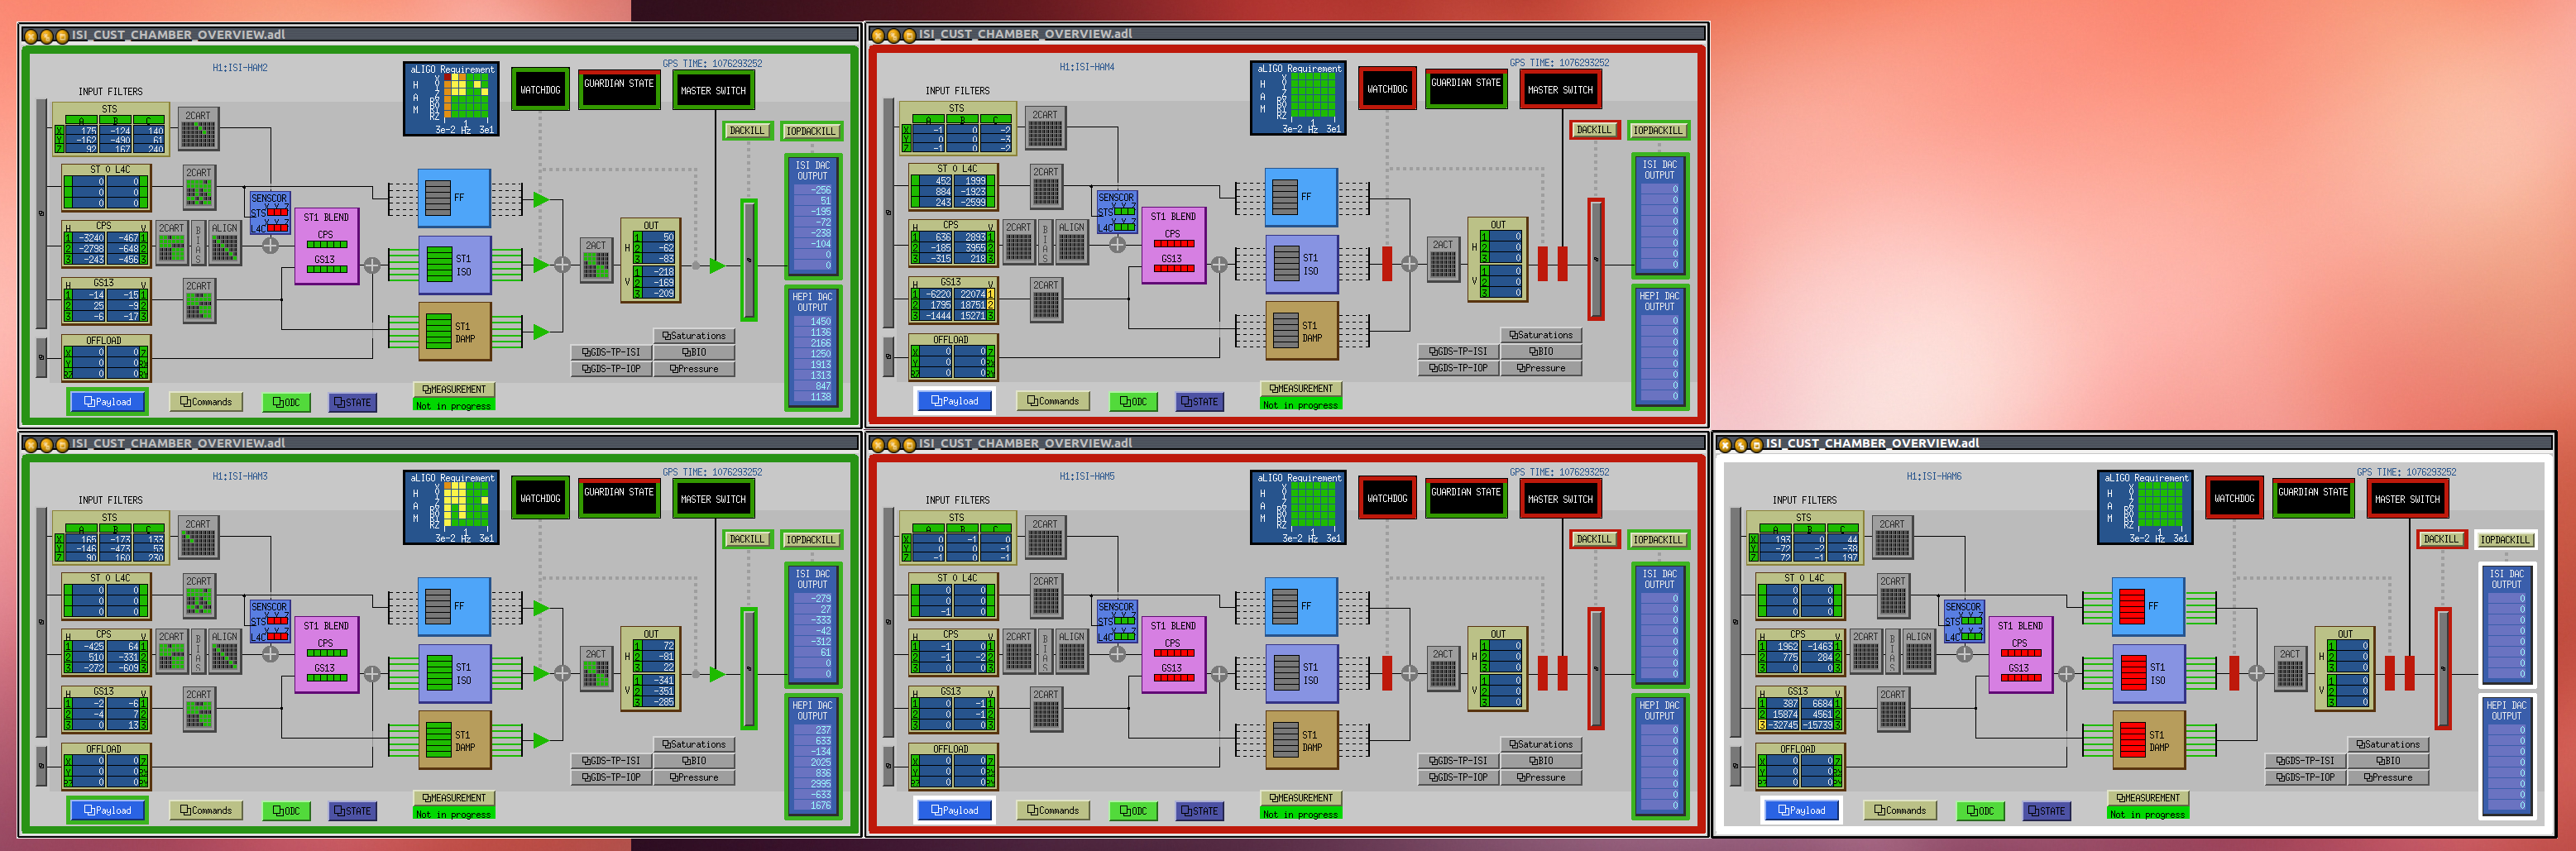
1- Make sure that Overview & WD screen got updated: No white lines
2- Trun on damp and ISO Lv3 and see it isolate, and confirm that terminal window pops up (gets closed when pushing key)
3- FF blocks are grey (no filter loaded)
4- Tripped the ISI by lowering Threshold on CPSs.
5- Made sure that CPSs get recorded as the last group of sensors that tripped the ISI.
6- Made sure that Last WD trip time gets recorded
7- Confirmed that "reset threshold levels" buton resets the watchdog threshold to the safe values
8- Made sure that "Reset all" button resets both the user WD and the dackill
9- Repeated 4-8 with GS13 and ACT
1- Make sure that Overview & WD screen got updated: No white lines
2- Turn on DAMP and ISO Lv3 and see it isolate. Confirm that terminal window pops up to describe what the command scripts do (gets closed when pushing key)
3- Made sure that the FF blocks are grey when no filter is is engaged, and that it is expected.
4- Tripped the ISI by lowering Threshold on CPSs.
5- Made sure that CPSs get recorded as the last group of sensors that tripped the ISI.
6- Made sure that Last WD trip time gets recorded
7- Confirmed that "reset threshold levels" buton resets the watchdog threshold to the safe values
8- Made sure that "Reset all" button resets both the user WD and the dackill
9- Repeated 4-8 with GS13 and ACT
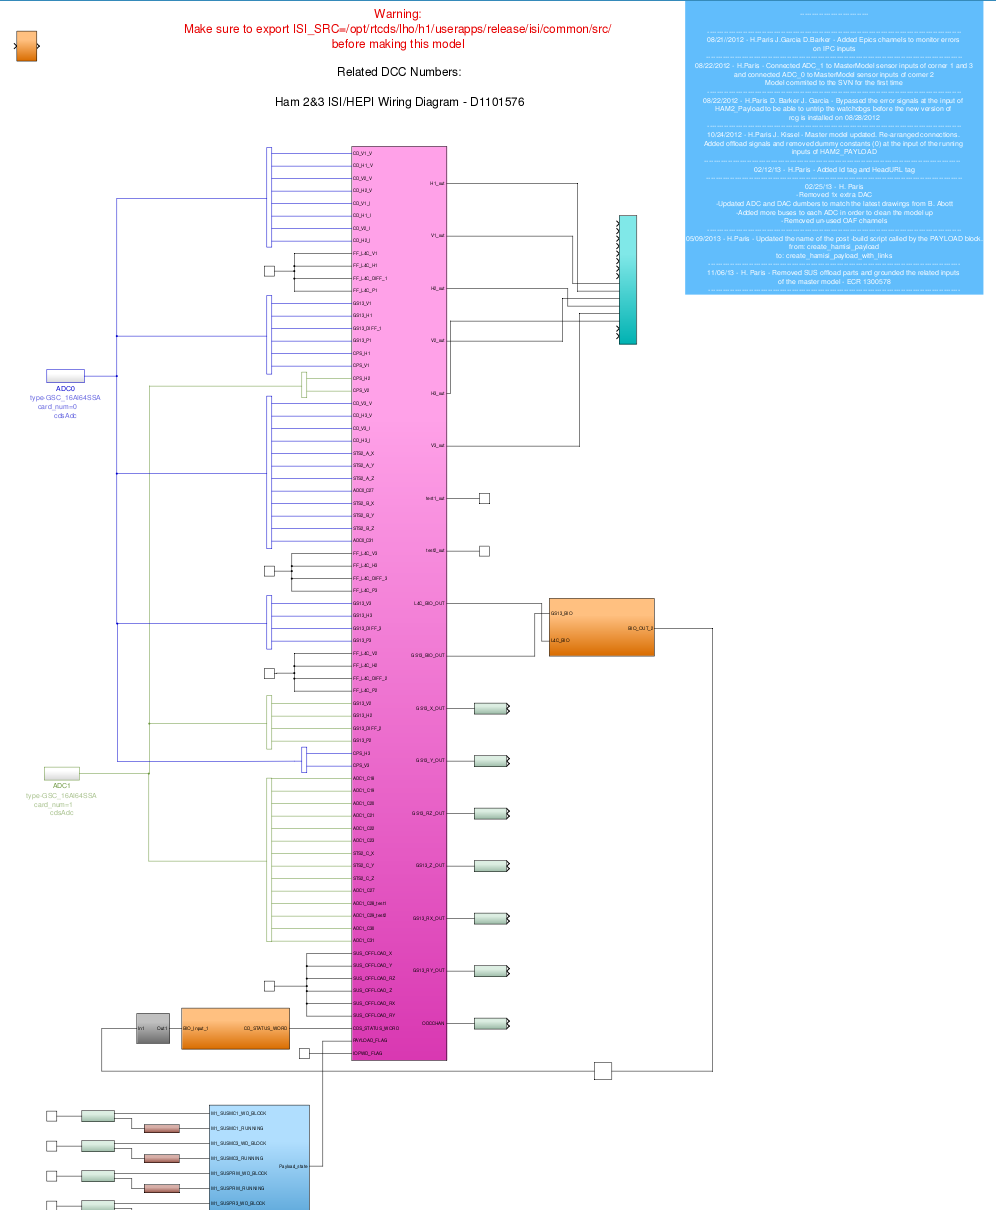
Every HAM-ISI top-level model of H1 was updated and recompiled. The new top-level models were commited under the SVN
-
h1isiham2.mdl -r7102
-
h1isiham3.mdl -r7104
Foton files had to be updated on HAM2 and HAM3 so the level 3 controllers would be in the correct filter banks for the updated command scripts to work. Filters were not modifed.
The content of the update is detailed in DCC T140012. See the attached Update_Log.txt For more details about the sequence of the update at LHO.
Work was performed under WP #4434, which is now closed