patrick.thomas@LIGO.ORG - posted 10:19, Thursday 23 January 2014 - last comment - 15:30, Thursday 23 January 2014(9482)
Keita transitioning end Y to laser HAZARD
Comments related to this report
The h1nds0 daqd will be shut down for up to 10 minutes to build RCG 2.8.2 versions of daqd to support longer frames. Longer frame collection should be implemented about 11:00 PST for h1fw0. Following about an hour of testing, and assuming testing is successful, longer frame writing will be implemented on h1fw1 about 12:00 PST.
Due to frame writer 0 crashing 35 minutes after starting while writing longer frames, we are delaying the change to framewriter 1 until 13:00 PST at the earliest.
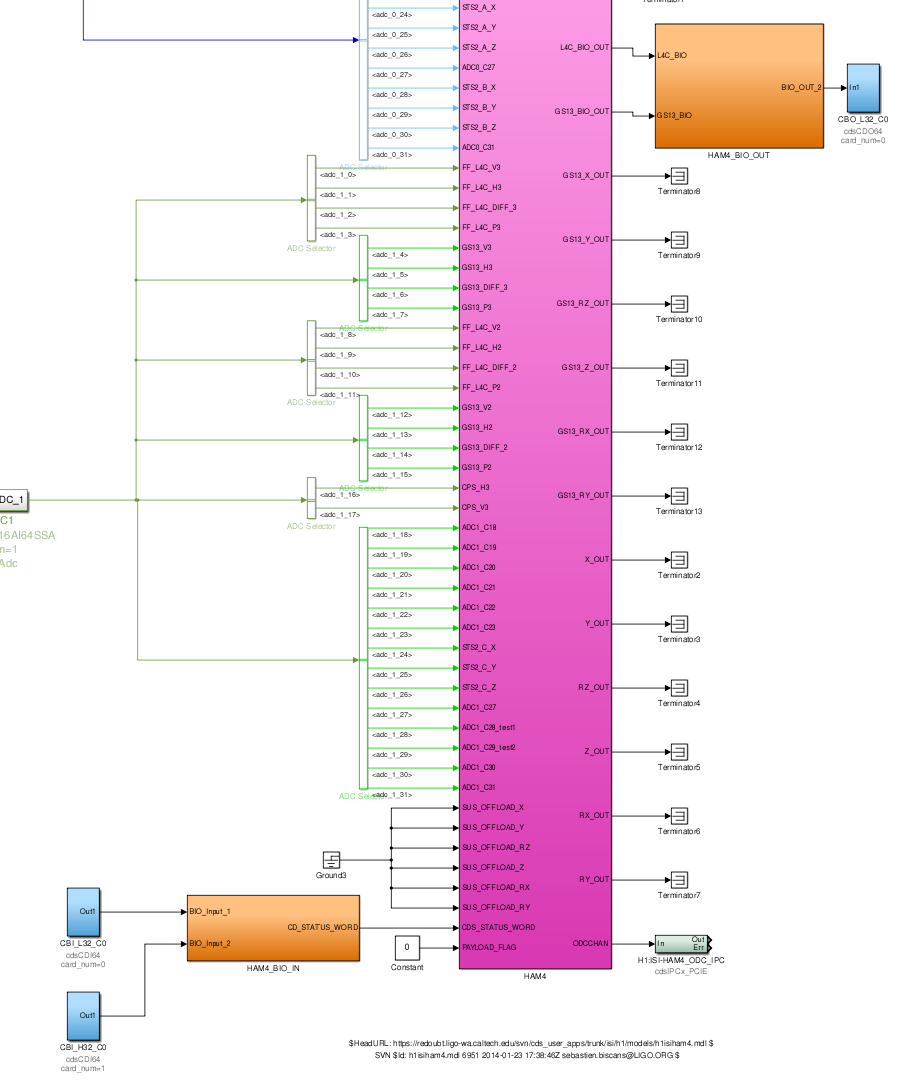
HAM4 and HAM5 are different compared to HAM236, because of the ST0-L4Cs. Consequently, we need to use the proper blocks for the BIO cards.
The changes have been made (see pic attached), the models recompiled and restarted. Everything went fine.
Done
Done
@9:45
Thomas out of LVEA
Done
Restart DAQ to load new .ini file for h1isiham4.
This is HughR, not Jim.
The current running configuration of the ETMX is almost as it was when Hugo logged the operational state 6 Dec. That was before the ISC etc crew began complaining that the ISI was broke or at least made things worse. I don't have an explainatioin why that period of poor ISI performance occurred. Was the HEPI & ISI too tilted? Things seem to be better since we eased the tilting (~13 Jan) though we weren't happy until now. The large drives on the ISI required to hold the tilted Optical Table with the Tilted HEPI may cause performance issues. RyanD of LLO would be seeking relief of our 1000s count drives.
The ISI blends are all 750 mHz except for X & Y dofs on Stage1. These are set to T100mHz with a 0.44Hz notch. This is the configuration from early December. Yesterday Sebastian added another Notch closer 0.5Hz on the X & Y dofs to address a peak on the Oplev pitch and the MO L.
The ITMX which was not commissioned in early December. The ITM now has the same controls as the ETM. Sebastian added a number of filters and taylored another notch as well. Both ETM and ITM are running the level 1 gain bank.
Sebastian also added Feed Forward from the HEPI L4Cs but didn't think it did very much, at least in the current area of interest for the ISC crew.
I'd be sckeptical that this state can be reached with one button push. Engaging the Trillium blend directly may be tricky and may have to be switched on when things have settled down after turning them on with out the Trilliums.
Installing beam dump on top of HAM2. Requires a soft close of gate valves. Permits 4407 and 4408.
(Kyle, Gerardo)
Soft closed gate valve #7 to install beam dump on top of HAM2, 4:10 pm.
Opened gate valve #7 at 5:05 pm.
(Kiwamu, Stefan, Gerardo)
Attempted to install temporary beam dump on top of HAM2, but it turns out that the modified viewport protector is not the right one. Procedure was stopped until correct part is obtained. Viewport was restored to previous state.
In order to ensure that the ODC bits are sending valid reports, I've visually confirmed the status of each subsystem module mentioned below. The ODC is currently reporting a happily locked mode cleaner and I confirm this is true. The goodness has been going on for a while now (as Stefan and Kiwamu are trying to lock the PRMI), but officially, we can say the goodness has been on-going since Jan 21 2014 6:00pm PST (Jan 22 2014 02:00:00 UTC, GPS 1074391216).
DetChar bonus tasks:
- Post performance ASDs of all the components mentioned below as a comment. I wanna see what "good" looks like for these systems.
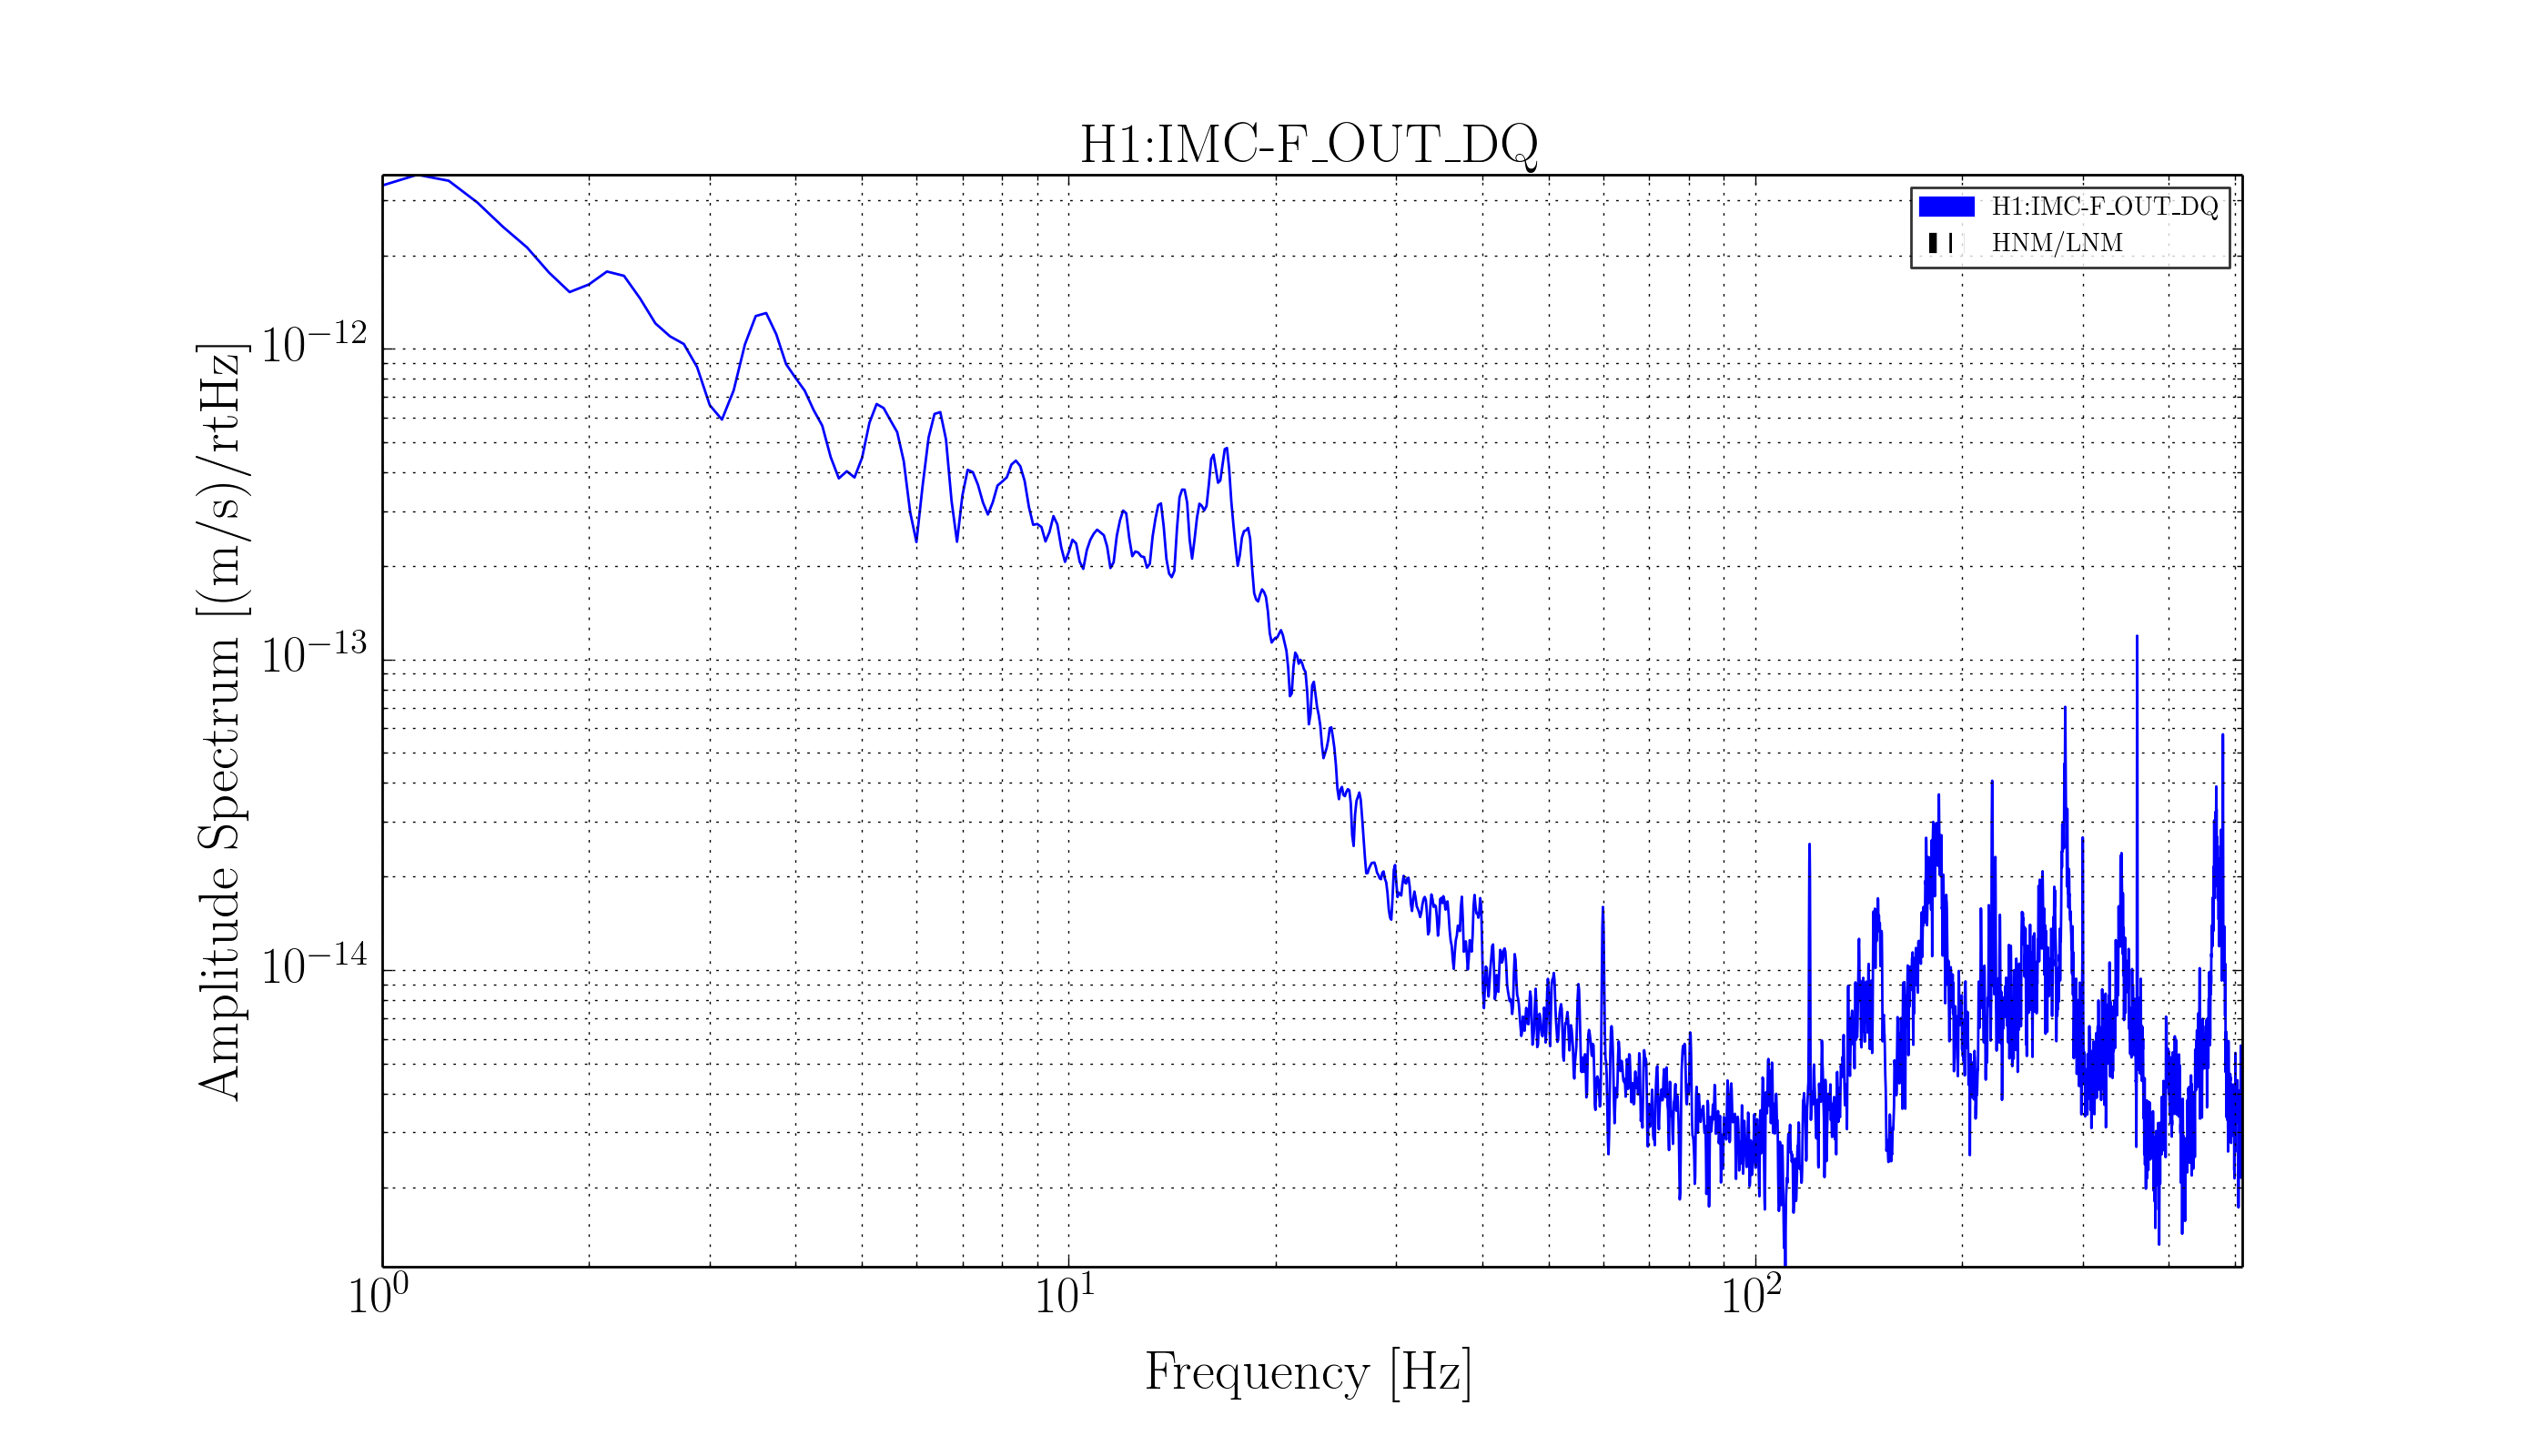
- We should also be able to use tonight as an average reference ASD for recoloring the IMC_F / IMC_L data in to fake DARM.
- Show me spectra of the coil driver noise monitor channels. Show me what a "normal" coil output voltage ASD is for each of the driver stages. Let me know if there are any DAC saturations.
- For the IMC ODC, trend the H1:IMC-MC2_TRANS_SUM_OUTPUT, H1:IMC-IM4_TRANS_SUM_OUTPUT channels (which feed into ODC bits 10-13). Tell me where they average, and what the peak value is on the ~minute time-scale. Find out from the IO group what the expected power budget is from POWER IN to MC2 TRANS SUM, and from POWER IN to IM4 TRANS SUM, so we can stick that into the [W/W] gain and have these bits' thresholds be calibrated.
During this time there was no excitation on anything mentioned below.
IMC: IMC Locked, IMC WFS control ON, spitting out clean 00 mode light.
ODC bits all green (0-13), bits 2-9 masked out (see LHO aLOG 9373), summary bit (bit 0) and bit 10 are masked out (why?)
HAM2:
HPI: well-performing, well-aligned to target values. Level 1 isolation filters, position-sensor-only ("Pos") blend filters.
ODC bits all green (0-3), but summary bit (bit 0) is masked out (why?).
ISI: well-performing [BLRMS lights are mostly green, with some yellow in upper-left corner], well-aligned to target values. Level 3 isolation filters, with "01_28" blend filters.
ODC bits all green (0-4), but summary bit (bit 0) is masked out (why?).
MC1: IMC locked, IMC WFS control ON, locally damped and aligned
ODC bits all green (0-7) are green, but summary bit (bit 0) is masked out (why?).
MC3: IMC locked, IMC WFS control ON, locally damped and aligned
ODC bits all green (0-7) are green, but summary bit (bit 0) is masked out (why?).
HAM3:
HPI: well-performing, well-aligned to target values. Level 1 isolation filters, position-sensor-only ("Pos") blend filters.
ODC bits all green (0-3), but summary bit (bit 0) is masked out (why?).
ISI: well-performing [BLRMS lights are mostly green, with some yellow in upper-left corner], well-aligned to target values. Level 3 isolation filters, with "01_28" blend filters.
ODC bits all green (0-4), but summary bit (bit 0) is masked out (why?).
MC2: IMC locked, IMC WFS control ON, locally damped and aligned
ODC bits all green (0-7) are green, but summary bit (bit 0) is masked out (why?).
I don't imagine I'll get the chance tonight, but if possible I may put these components in various *bad* states tomorrow, to check that the ODC properly reports as such.
Q: "summary bit (bit 0) is masked out (why?)"

A: The summary bit will always appear grey in the 'Mask' portion of the ODC MEDM screens because it is not used in the summary bitmask. The bitmask defines which bits are checked in order to determine whether the summary bit should be turned on, if you were to include the summary bit itself in that check then the bit would never be activated. If this is a cause of confusion, we can remove the summary bit from the bitmask identifier on the MEDM screens.
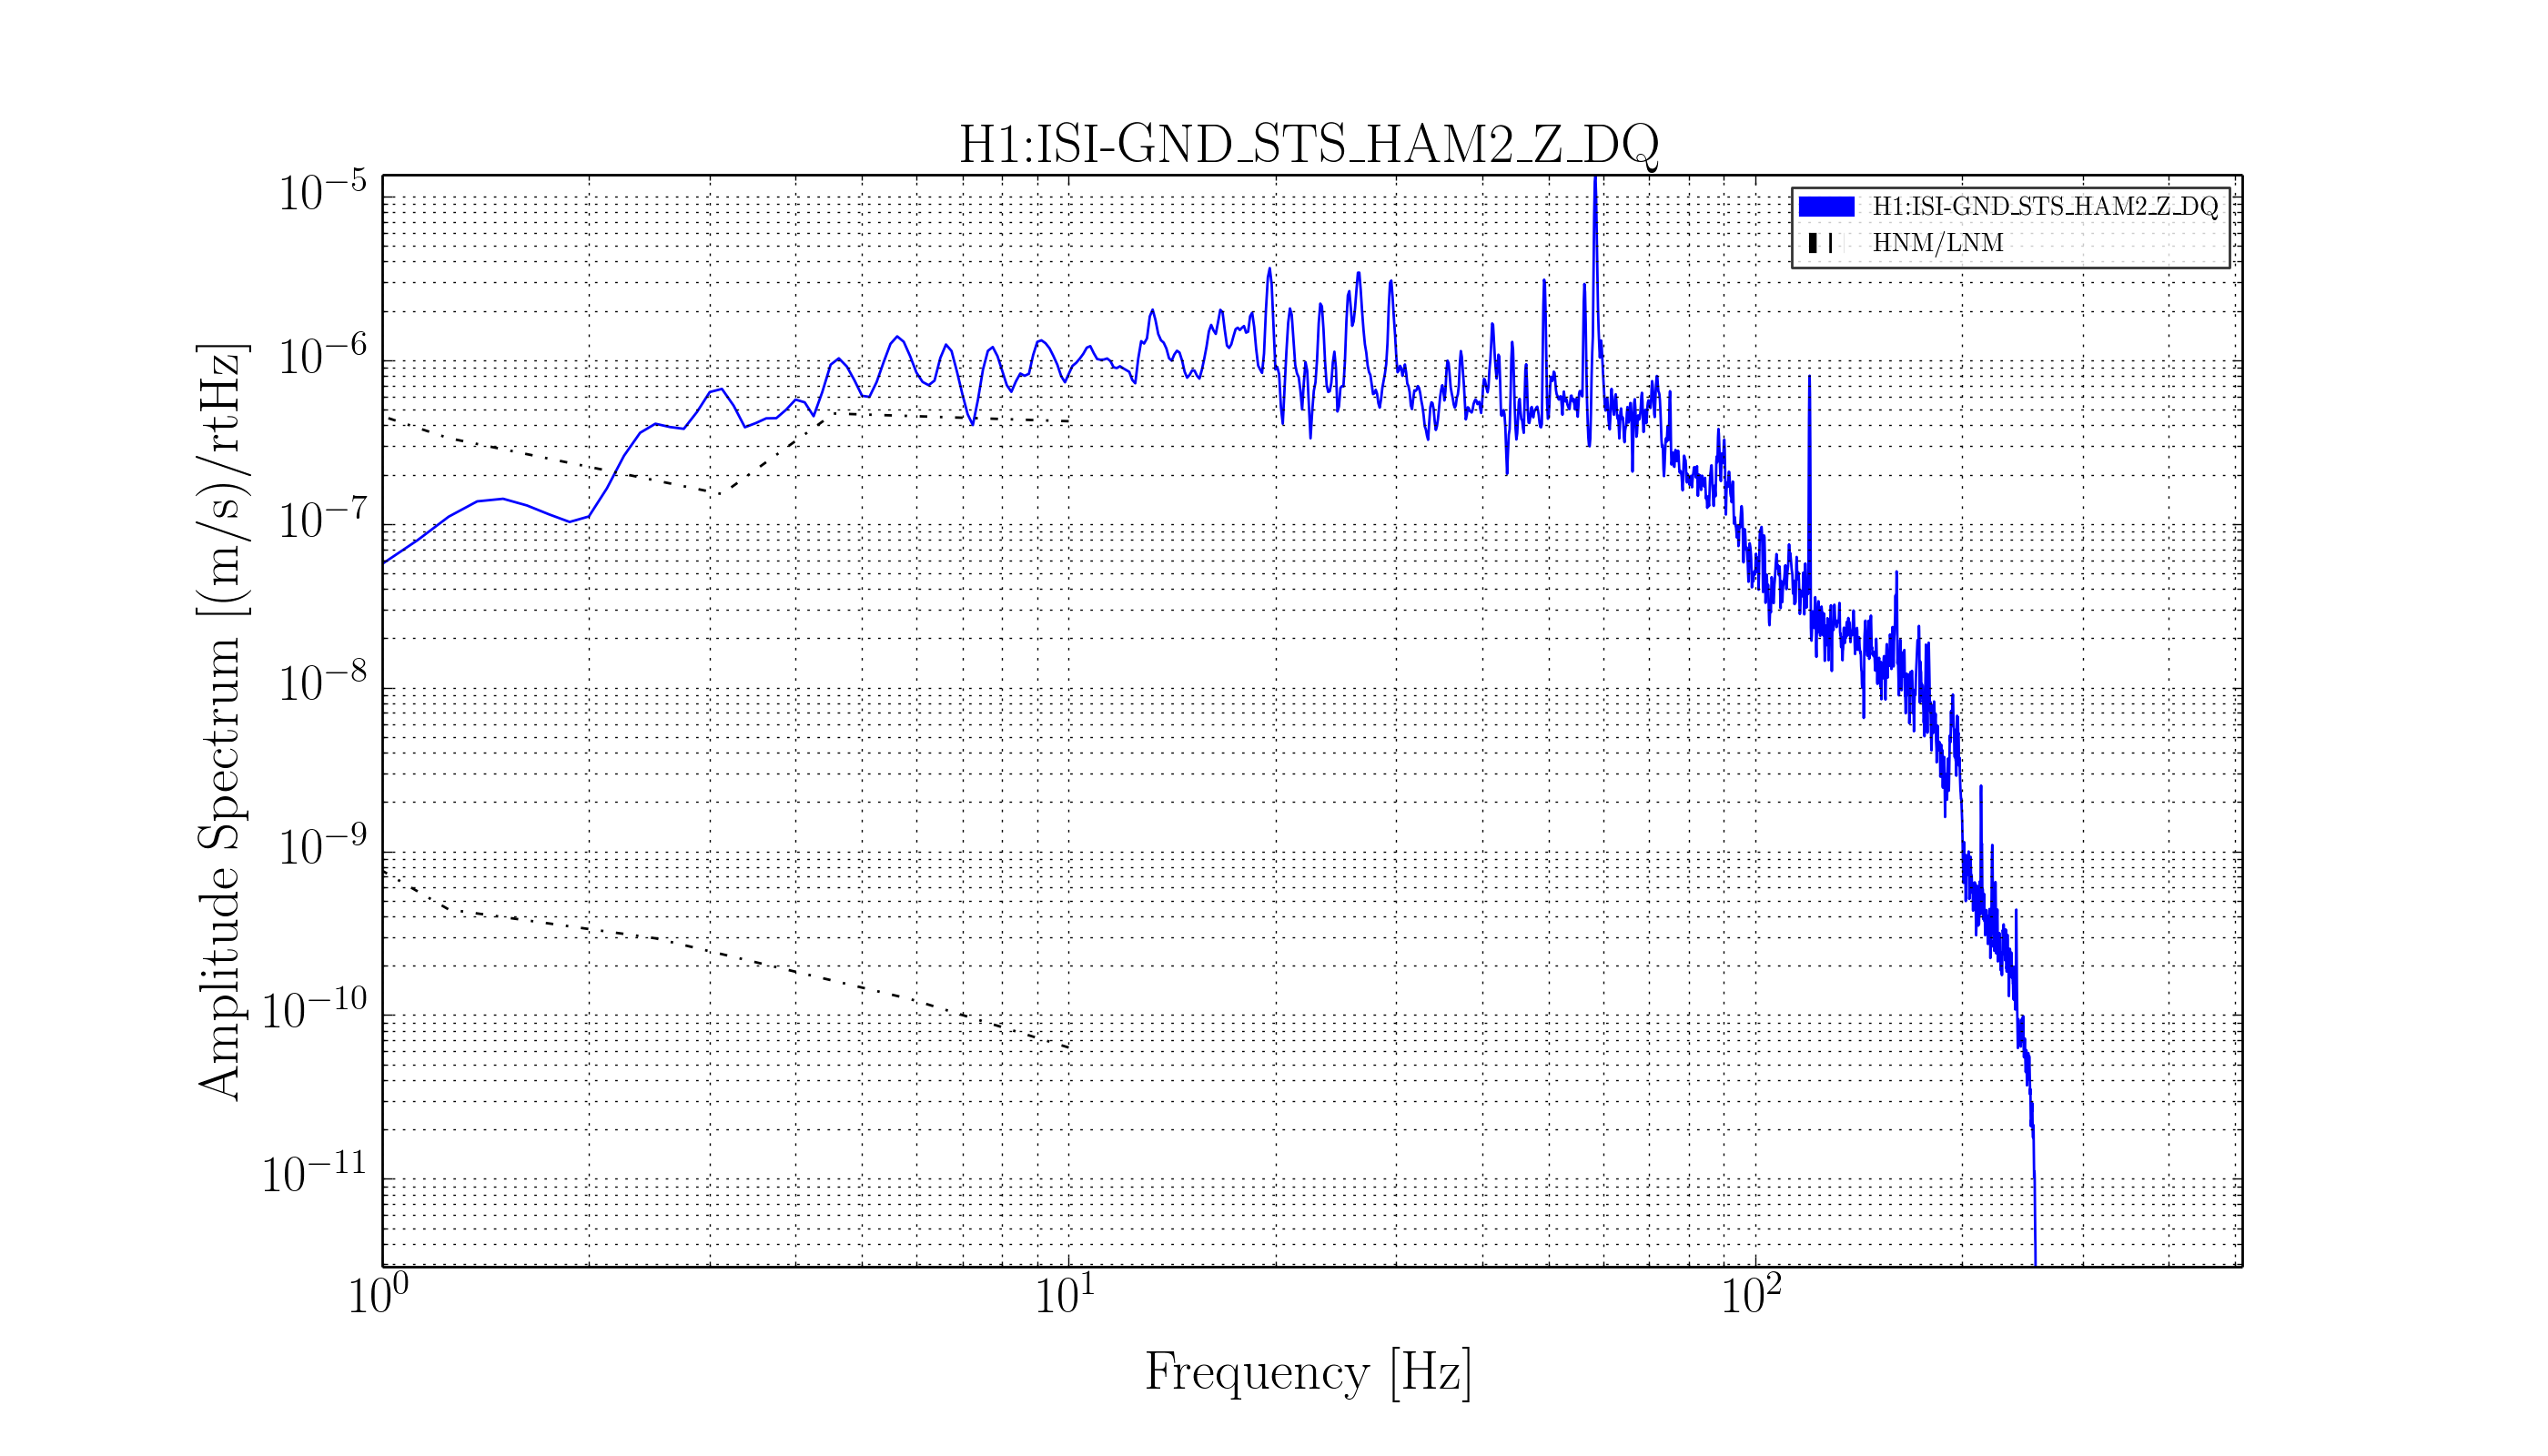
ASD of IMC-F at this time (psd.png)
ASD of HAM2 ground sensor at this time (psd_ground.png)