TITLE: 12/20 Day Shift: 1530-0030 UTC (0730-1630 PST), all times posted in UTC
STATE of H1: Observing at 160Mpc
OUTGOING OPERATOR: Oli
CURRENT ENVIRONMENT:
SEI_ENV state: SEISMON_ALERT
Wind: 3mph Gusts, 2mph 3min avg
Primary useism: 0.07 μm/s
Secondary useism: 0.32 μm/s
QUICK SUMMARY:
TITLE: 12/20 Eve Shift: 0030-0600 UTC (1630-2200 PST), all times posted in UTC
STATE of H1: Observing at 158Mpc
INCOMING OPERATOR: Oli
SHIFT SUMMARY:
H1 Still locked for 32 hours! Currently Observing.
Aside from the breif Internet outage nothing really happened.
Violins looking good, No Pi's ringing up or nothin.
This is a good start going into the holidays.
TITLE: 12/20 Eve Shift: 0030-0600 UTC (1630-2200 PST), all times posted in UTC
STATE of H1: Observing at 157Mpc
CURRENT ENVIRONMENT:
SEI_ENV state: CALM
Wind: 9mph Gusts, 7mph 3min avg
Primary useism: 0.04 μm/s
Secondary useism: 0.34 μm/s
QUICK SUMMARY:
CDS & GS internet connectivity to the outside world went down. Issues due to Core Switch work?
Outage lasted from 2:00 UTC to ~ 2:24 UTC.
IFO stayed locked during that time, We now have a 28+ Hour lock.
Control over the IFO was maintained throughout the entire outage.
Local networks stayed up and running just fine.
I called Dave & Jonathan, Jonathan told me to wait it out, as it's just a switch updating , rebooting, and falling back to another network.
I presume the falling back to the other network bit took some time.
All systems recovered the way Jonathan said they would. He advised me to wait it out if there is another one, and to call him again if things went down after 3 :00 UTC (7pm local) .
So far so good.
This alog follows up LHO:81769 where I calibrated the ASC drives to test mass motion for all eight arm ASC control loops. Now, I have taken the noise budget injections that we run to measure the ASC coupling to DARM, and used that to calibrate an angle-to-length coupling function in mm/rad. I have only done this for the HARD loops because the SOFT loops do not couple very strongly to DARM (notable exception to CSOFT P, which I will follow up on).
The noise budget code uses an excess power projection to DARM, but instead I chose to measure the linear transfer function. The coherence is just ok, so I think a good follow up is to remeasure the coupling again and drive a bit harder/average longer (these are 60 second measurements). This plot shows the noise budget injection into calibrated DARM/ASC PUM drive [m/Nm] transfer function, and the coherence of the measurement.
I followed a similar calibration procedure to my previous alog:
I did not apply the drive matrix here, so the calibration is into ETM motion only (factor of +/-1), whereas the calibration into ITM motion would have an additional +/- 0.74 (+/- 0.72 for yaw) applied.
HARD Pitch Angle to Length coupling plot
HARD Yaw Angle to Length coupling plot
Overall, the best-measured DOF here is CHARD Y. In both CHARD Y and DHARD Y, there seem to be two clear coupling regions: one fairly flat region above 20 Hz in CHARD Y and above 30 Hz in DHARD Y, reaching between 20-30 mm/rad. Below, there is a steep coupling. This is reminiscient of the coupling that Gabriele, Louis, and I measured back in March and tried to mitigate with A2L and WFS offset. We found that we could reduce the flatter coupling in DHARD Y by adjusting the A2L gain, and the steeper coupling by applying a small offset in AS WFS A yaw DC. We are currently not running with that WFS offset. The yaw coupling suggests that we have some sort of miscentering on both the REFL and AS WFS which causes a steep low frequency coupling which is less sensitive to beam centering on the test mass (as shown by the A2L tests); meanwhile, the flat coupling is sensitive to beam miscentering on the test mass, which is expected (see e.g. T0900511).
The pitch coupling has the worst coherence here, but the coupling is certainly not flat. It appears to be rising with about f^4 at high frequency. I have a hard time understanding what could cause that. There is also possibly a similar steep coupling at low frequency like the yaw coupling, but the coherence is so poor it's hard to see.
Assuming that I have my calibration factors correct here (please don't assume this! check my work!), this suggests that the beam miscentering is higher than 1 mm everywhere and possibly up to 30 mm on the ETMs (remember this would be ~25% lower on the ITMs). This seems very large, so I'm hoping that there is another errant factor of two or something somewhere.
My code for both the calibrated motion and calibrated coupling is in a git repo here: https://git.ligo.org/ecapote/ASC_calibration
Today I had a chance to rerun these injections so I could get better coherence, injection plot. I ran all the injections with the calibration lines off.
The pitch couplings now appear to be very flat, which is what we expect. However, they are very high (100 mm/rad !!) which seems nearly impossible.
The yaw couplings still show a strong frequency dependence below 30 Hz, and are flat above, and around 30-50 mm/rad, still large.
Whether or not the overall beam miscentering value is correct, this does indicate that there is some funny behavior in yaw only that causes two different alignment coupling responses. Since this is observed in both DHARD and CHARD, it could be something common to both (so maybe less likely to be related to the DARM offset light on the AS WFS).
I also ran a measurement of the CSOFT P coupling, injection plot. I was only able to get good coherence up to 30 Hz, but it seems to be fairly flat too, CSOFT P coupling.
Edit: updated coupling plots to include error shading based on the measurement coherence.
TITLE: 12/20 Eve Shift: 0030-0600 UTC (1630-2200 PST), all times posted in UTC
STATE of H1: Observing at 159Mpc
OUTGOING OPERATOR: TJ
CURRENT ENVIRONMENT:
SEI_ENV state: CALM
Wind: 4mph Gusts, 2mph 3min avg
Primary useism: 0.03 μm/s
Secondary useism: 0.32 μm/s
QUICK SUMMARY:
H1 has been locked for over 26 Hours.
Current plan: stay in Observing.
Note:
Dust mon LAB2 still not reporting back correctly.
TITLE: 12/20 Day Shift: 1530-0030 UTC (0730-1630 PST), all times posted in UTC
STATE of H1: Observing at 162Mpc
INCOMING OPERATOR: Tony
SHIFT SUMMARY: Locked for 26.5 hours so far. We took calibration measurements this morning, followed by 3 hours of commissioning time.
LOG:
| Start Time | System | Name | Location | Lazer_Haz | Task | Time End |
|---|---|---|---|---|---|---|
| 16:53 | SAF | LVEA | LVEA | YES | LVEA IS LASER HAZARD | 00:38 |
| 15:38 | PCAL | Francisco | PCAL lab | local | Check on meas | 15:43 |
| 16:54 | FAC | Tyler | High Bay | N | While we are not observing | 17:24 |
| 17:08 | SEI | Jim, Mitchell | EY | n | Wind fence check | 18:54 |
| 18:21 | - | Richard | OSB | n | Opening receiving rollup | 18:36 |
| 18:44 | FAC | Kim | H2 build | n | Tech clean | 19:02 |
| 20:19 | VAC | Janos | MX, MY | n | Taking measurements | 21:44 |
| 22:12 | PCAL | Rick, Francisco, Dripta | PCAL lab | local | PCAL meas | 01:12 |
J. Freed,
SRM M1 stage bosems (speciffically T2, T3) show strong coupling below 10Hz. SR3 M1 had some on LF, RT bosems between 10-15Hz
Today I did damping loop injections on all 6 BOSEMs on the SR3 and SRM M1. This is a continuation of the work done previously for ITMX, ITMY, PR2, PR3, PRM, SR2. As with PRM, gains of 300 and 600 were collected for SR3 (300 is labled as ln or L). Only a gain of 600 was collected for SRM due to time constraints. Calibration lines were on for SR3.
The plots, code, and flagged frequencies are located at /ligo/home/joshua.freed/bosem/SR3/scripts. While the diaggui files are at /ligo/home/joshua.freed/bosem/SR3/data for SR3. I used Sheila code located under /ligo/home/joshua.freed/bosem/SR2/scripts/osem_budgeting.py to produce the sum of all contributions as well as the individual plots.
Commissioning wrapped up, back to Observing 2007UTC.
Locked for 22 hours.
This morning I swapped out the dust monitor in the VAC prep lab for a spare that was calibrated earlier this year. After swapping the connection issues remain.
Since we've been having issues with PI24 ringing up lately we decided to change the SUS_PI guardian code to increase the bias offset on ETMY L3 LOCK. That bias offset value is normally -4.9, and we noticed that when damping PI24, we typically start hitting our damping limit when PI24 RMSMON exceeds a value of 10. I have turned the PI_DAMPING state into a generator function so it can now make two different states, PI_DAMPING and EXTREME_PI_DAMPING. When in PI_DAMPING, pi24 will be damped with our normal bias until we reach an RMSMON average value of 20. Once that happens, the guardian will jump to a state called INCREASE_BIAS (what it does is self-explanatory), and then goes into XTREME_PI_DAMPING, where it continues damping and changing phase as needed until we are back under an RMSMON value of 4(pi24 script logic). Once we are good the guardian will take us through DECREASE_BIAS (guess what that does) and then back into PI_DAMPING(node graph, states list).
Because the nominal state for Observing is PI_DAMPING, when we move into one of these other states we will be taken out of Observing (tagging OPS). Once we are back in PI_DAMPING we will automatically go back into Observing as long as we are in AUTOMATIC.
Occasionally we do get small quick ringups that go up above 20 that are capable of being damped by regular damping and just changing the phase - ndscope1(versus the slower ringups that cannot - ndscope2), so with these script changes, when these happen we will be taken out of Observing as the SUS_PI guardian jumps to up the bias and damp harder. These don't happen very often so we are okay for now, but a future to-do is to edit the script to keep it from increasing the bias at least until it's tried all phase changes.
Camilla, Sheila, Following on from 81852.
Today I re-ran the sqz/h1/scripts/SCAN_PSAMS.py script, with SQZ_MANAGER guardian paused (so it's not forcing the ADF servo on). The script worked as expected (setup by turning off ADF servo and increasing SQZ ASC gain to speed up, then changed ZM PSAMS, waited 120s for ASC to coverage, turned off ASC, scanned sqz angle and saved data and then repeated) and took ~3m30 per step.
The results are attached (heatmap, scans) but didn't show an obvious direction to move in. Maybe the steps were too small but are already larger than those use at LLO LLO#72749: 0.3V vs 0.1V per step.
Our initial ZM4/5 PSAMs values were 5.6V, -1.1V and looking at the attached data, we took them to 5.2V, -1.5V. We then decided ther range looked better when the PSAMs were higher to went to 6.0V, -0.4Vthis seemed to gain improve the range ~5MPc, we checked by going back to 5.2V, -1.5V and the range again dropped, main change appears to be in orange BAND_2 OMC BLRMs which is 20-34Hz, the places with glitches in OAF BLRMS are noisy times from Robert's injections. Then went further in this direction to 6.5V, 0.0V, this didn't help the range so we are staying at 6.0V, -0.4V, sdf's attached. This seemed to be a repeat-able change that gave us a few MPc's in range! Success for PSAMS: zoomed out and zoomed in plots attached.
Future work: we could run the SCAN_PSAMS.py script with small 0.1V changes as LLO does.
Vicky asked to check the HOM plot and wide plot, don't see a big difference, if anything it's worse with larger HOM peaks after the PSAMS change. We can see that the 20-35Hz in DARM looks a little better, though this does drift throughout the lock as Sheila showed in 81843.
Thu Dec 19 10:15:29 2024 INFO: Fill completed in 15min 25secs
Gerardo confirmed a good fill curbside.
TC-B suddenly jumped up in temperature at 04:16 this morning by +15C. Gerardo took a look, both TCs are currently encased in ice (see photo).
TC-mins for today's fill (trip temp = -65C) TC-A = -116C, TC-B = -56C. Which means only TC-A was able to stop the fill by exceeding the trip temp.
Following the new instructions but on the usual wiki, I ran a broad band and then a new version of simulines like Corey did last week (alog81828).
Simulines start:
PST: 2024-12-19 08:37:18.337770 PST
UTC: 2024-12-19 16:37:18.337770 UTC
GPS: 1418661456.337770
End:
PST: 2024-12-19 09:01:04.771446 PST
UTC: 2024-12-19 17:01:04.771446 UTC
GPS: 1418662882.771446
Files:
2024-12-19 17:01:04,693 | INFO | File written out to: /ligo/groups/cal/H1/measurements/DARMOLG_SS/DARMOLG_SS_2024
1219T163719Z.hdf5
2024-12-19 17:01:04,700 | INFO | File written out to: /ligo/groups/cal/H1/measurements/PCALY2DARM_SS/PCALY2DARM_S
S_20241219T163719Z.hdf5
2024-12-19 17:01:04,704 | INFO | File written out to: /ligo/groups/cal/H1/measurements/SUSETMX_L1_SS/SUSETMX_L1_S
S_20241219T163719Z.hdf5
2024-12-19 17:01:04,708 | INFO | File written out to: /ligo/groups/cal/H1/measurements/SUSETMX_L2_SS/SUSETMX_L2_S
S_20241219T163719Z.hdf5
2024-12-19 17:01:04,712 | INFO | File written out to: /ligo/groups/cal/H1/measurements/SUSETMX_L3_SS/SUSETMX_L3_S
S_20241219T163719Z.hdf5
VACSTAT detected another BSC3 PT132 sensor glitch at 00:53 Thu 19dec2024. I reset vacstat_ioc.service on cdsioc0 at 07:32 to clear it.
TITLE: 12/19 Day Shift: 1530-0030 UTC (0730-1630 PST), all times posted in UTC
STATE of H1: Observing at 157Mpc
OUTGOING OPERATOR: Ryan S
CURRENT ENVIRONMENT:
SEI_ENV state: CALM
Wind: 9mph Gusts, 7mph 3min avg
Primary useism: 0.04 μm/s
Secondary useism: 0.35 μm/s
QUICK SUMMARY: Locked for 17.5 hours, range stable, environment calm. Planned calibration and commissioning today starting at 0830PT (1630UTC).
TITLE: 12/19 Eve Shift: 0030-0600 UTC (1630-2200 PST), all times posted in UTC
STATE of H1: Observing at 157Mpc
INCOMING OPERATOR: Ryan S
SHIFT SUMMARY:
H1 has been locked all shift!
A few small earthquakes rolled though and we survived.
Other wise it's been a quiet night.
This alog presents the first steps I am taking into answering the question: "what is the calibrated residual test mass motion from the ASC?"
As a reminder, the arm alignment control is run in the common/differential, hard/soft basis, so we have eight total loops governing the angular motion of the test masses: pitch and yaw for differential hard/soft and common hard/soft. These degrees of freedom are diagonalized in actuation via the ASC drive matrix. The signals from each of these ASC degrees of freedom are then sent to each of the four test masses, where the signal is fed "up" from the input of the TST ISC filter banks through the PUM/UIM/TOP locking filters banks (I annotated this screenshot of the ITM suspension medm for visualization). No pitch or yaw actuation is sent to the TST or UIM stages at Hanford. The ASC drive to the pum is filtered through some notches/bandstops for various suspension modes. The ASC drive to the TOP acquires all of these notches and bandstops and an additional integrator and low pass filter, meaning that the top mass actuates in angle at very low frequency only (sub 0.5 Hz).
Taking this all into account involves a lot of work, so to just get something off the ground, I am only thinking about ASC drive to the PUM in this post. With a little more time, I can incorporate the drive to the top mass stage as well. Thinking only about the PUM makes this a "simple" problem:
I have done just this to achieve the four plots I have attached to this alog. These plots show the ITM and ETM test mass motion in rad/rtHz from each degree of freedom and the overall radian RMS value. That is, each trace is showing you exactly how much radians of motion each ASC degree of freedom is sending to the test mass through the PUM drive. The drive matrix value is the same in magnitude for each ITM and each ETM, meaning that the "ITM" plot is true for both ITMX and ITMY (the drives might differ by an overall sign though).
Since I am just looking at the PUM, I also didn't include the drive notches. Once I add in the top mass drive, I will make sure I capture the various drive filters properly.
Some commentary: These plots make it very evident how different the drive is from each ASC degree of freedom. This is confusing because in principle we know that the "HARD" and "SOFT" plants are the same for common and differential, and could use the same control design. However, we know that the sensor noise at the REFL WFS, which controls CHARD, is different than the sensor noise at the AS WFS that control DHARD, so even with exact same controller, we would see different overall drives. We also know that we don't use the same control design for each DOF, due to the sensor noise limitations and also the randomness of commissioning that has us updating each ASC controller at different times for different reasons. For example, the soft loops both run on the TMS QPDs, but still have different drive levels.
Some action items: besides continuing the process of getting all the drives from all stages properly calibrated, we can start thinking again about our ASC design and how to improve it. I think two standout items are the SOFT P and CHARD Y noise above 10 Hz on these plots. Also, the fact that the overall RMS from each loop varies is something that warrants more investigation. I think this is probably related to the differing control designs, sensor noise, and noise from things like HAM1 motion or PR3 bosems. So, one thing I can do is project the PR3 damping noise that we think dominates the REFL WFS RMS into test mass motion.
I have just realized I mixed up the DACs and ADCs (again) and the correct count-to-torque calibration should be:
So these plots are wrong by a factor of 2. I will correct this in my code and post the corrected plots shortly.
The attached plots are corrected by the erroneous factor of two mentioned above, which has an overall effect of reducing the motion by 2.
Ansel reported that a peak in DARM that interfered with the sensitivity of the Crab pulsar followed a similar time frequency path as a peak in the beam splitter microphone signal. I found that this was also the case on a shorter time scale and took advantage of the long down times last weekend to use a movable microphone to find the source of the peak. Microphone signals don’t usually show coherence with DARM even when they are causing noise, probably because the coherence length of the sound is smaller than the spacing between the coupling sites and the microphones, hence the importance of precise time-frequency paths.
Figure 1 shows DARM and the problematic peak in microphone signals. The second page of Figure 1 shows the portable microphone signal at a location by the staging building and a location near the TCS chillers. I used accelerometers to confirm the microphone identification of the TCS chillers, and to distinguish between the two chillers (Figure 2).
I was surprised that the acoustic signal was so strong that I could see it at the staging building - when I found the signal outside, I assumed it was coming from some external HVAC component and spent quite a bit of time searching outside. I think that this may be because the suspended mezzanine (see photos on second page of Figure 2) acts as a sort of soundboard, helping couple the chiller vibrations to the air.
Any direct vibrational coupling can be solved by vibrationally isolating the chillers. This may even help with acoustic coupling if the soundboard theory is correct. We might try this first. However, the safest solution is to either try to change the load to move the peaks to a different frequency, or put the chillers on vibration isolation in the hallway of the cinder-block HVAC housing so that the stiff room blocks the low-frequency sound.
Reducing the coupling is another mitigation route. Vibrational coupling has apparently increased, so I think we should check jitter coupling at the DCPDs in case recent damage has made them more sensitive to beam spot position.
For next generation detectors, it might be a good idea to make the mechanical room of cinder blocks or equivalent to reduce acoustic coupling of the low frequency sources.
This afternoon TJ and I placed pieces of damping and elastic foam under the wheels of both CO2X and CO2Y TCS chillers. We placed thicker foam under CO2Y but this did make the chiller wobbly so we placed thinner foam under CO2X.
Unfortunately, I'm not seeing any improvement of the Crab contamination in the strain spectra this week, following the foam insertion. Attached are ASD zoom-ins (daily and cumulative) from Nov 24, 25, 26 and 27.
This morning at 17:00UTC we turned the CO2X and CO2Y TCS chiller off and then on again, hoping this might change the frequency they are injecting into DARM. We do not expect it to effect it much we had the chillers off for a ling period 25th October 80882 when we flushed the chiller line and the issue was seen before this date.
Opened FRS 32812.
There were no expilcit changes to the TCS chillers bettween O4a and O4b although we swapped a chiller for a spare chiller in October 2023 73704.
Between 19:11 and 19:21 UTC, Robert and I swapped the foam from under CO2Y chiller (it was flattened and not providing any damping now) to new, thicker foam and 4 layers of rubber. Photo's attached.
Thanks for the interventions, but I'm still not seeing improvement in the Crab region. Attached are daily snapshots from UTC Monday to Friday (Dec 2-6).
I changed the flow of the TCSY chiller from 4.0gpm to 3.7gpm.
These Thermoflex1400 chillers have their flow rate adjusted by opening or closing a 3 way valve at the back of the chiller. for both X and Y chillers, these have been in the full open position, with the lever pointed straight up. The Y chiller has been running with 4.0gpm, so our only change was a lower flow rate. The X chiller has been at 3.7gpm already, and the manual states that these chillers shouldn't be ran below 3.8gpm. Though this was a small note in the manual and could be easily missed. Since the flow couldn't be increased via the 3 way valve on back, I didn't want to lower it further and left it as is.
Two questions came from this:
The flow rate has been consistent for the last year+, so I don't suspect that the pumps are getting worn out. As far back as I can trend they have been around 4.0 and 3.7, with some brief periods above or below.
Thanks for the latest intervention. It does appear to have shifted the frequency up just enough to clear the Crab band. Can it be nudged any farther, to reduce spectral leakage into the Crab? Attached are sample spectra from before the intervention (Dec 7 and 10) and afterward (Dec 11 and 12). Spectra from Dec 8-9 are too noisy to be helpful here.
TJ touched the CO2 flow on Dec 12th around 19:45UTC 81791 so the flowrate further reduced to 3.55 GPM. Plot attached.
The flow of the TCSY chiller was further reduced to 3.3gpm. This should push the chiller peak lower in frequency and further away from the crab nebula.
The further reduced flow rate seems to have given the Crab band more isolation from nearby peaks, although I'm not sure I understand the improvement in detail. Attached is a spectrum from yesterday's data in the usual form. Since the zoomed-in plots suggest (unexpectedly) that lowering flow rate moves an offending peak up in frequency, I tried broadening the band and looking at data from December 7 (before 1st flow reduction), December 16 (before most recent flow reduction) and December 18 (after most recent flow reduction). If I look at one of the accelerometer channels Robert highlighted, I do see a large peak indeed move to lower frequencies, as expected. Attachments: 1) Usual daily h(t) spectral zoom near Crab band - December 18 2) Zoom-out for December 7, 16 and 18 overlain 3) Zoom-out for December 7, 16 and 18 overlain but with vertical offsets 4) Accelerometer spectrum for December 7 (sample starting at 18:00 UTC) 5) Accelerometer spectrum for December 16 6) Accelerometer spectrum for December 18
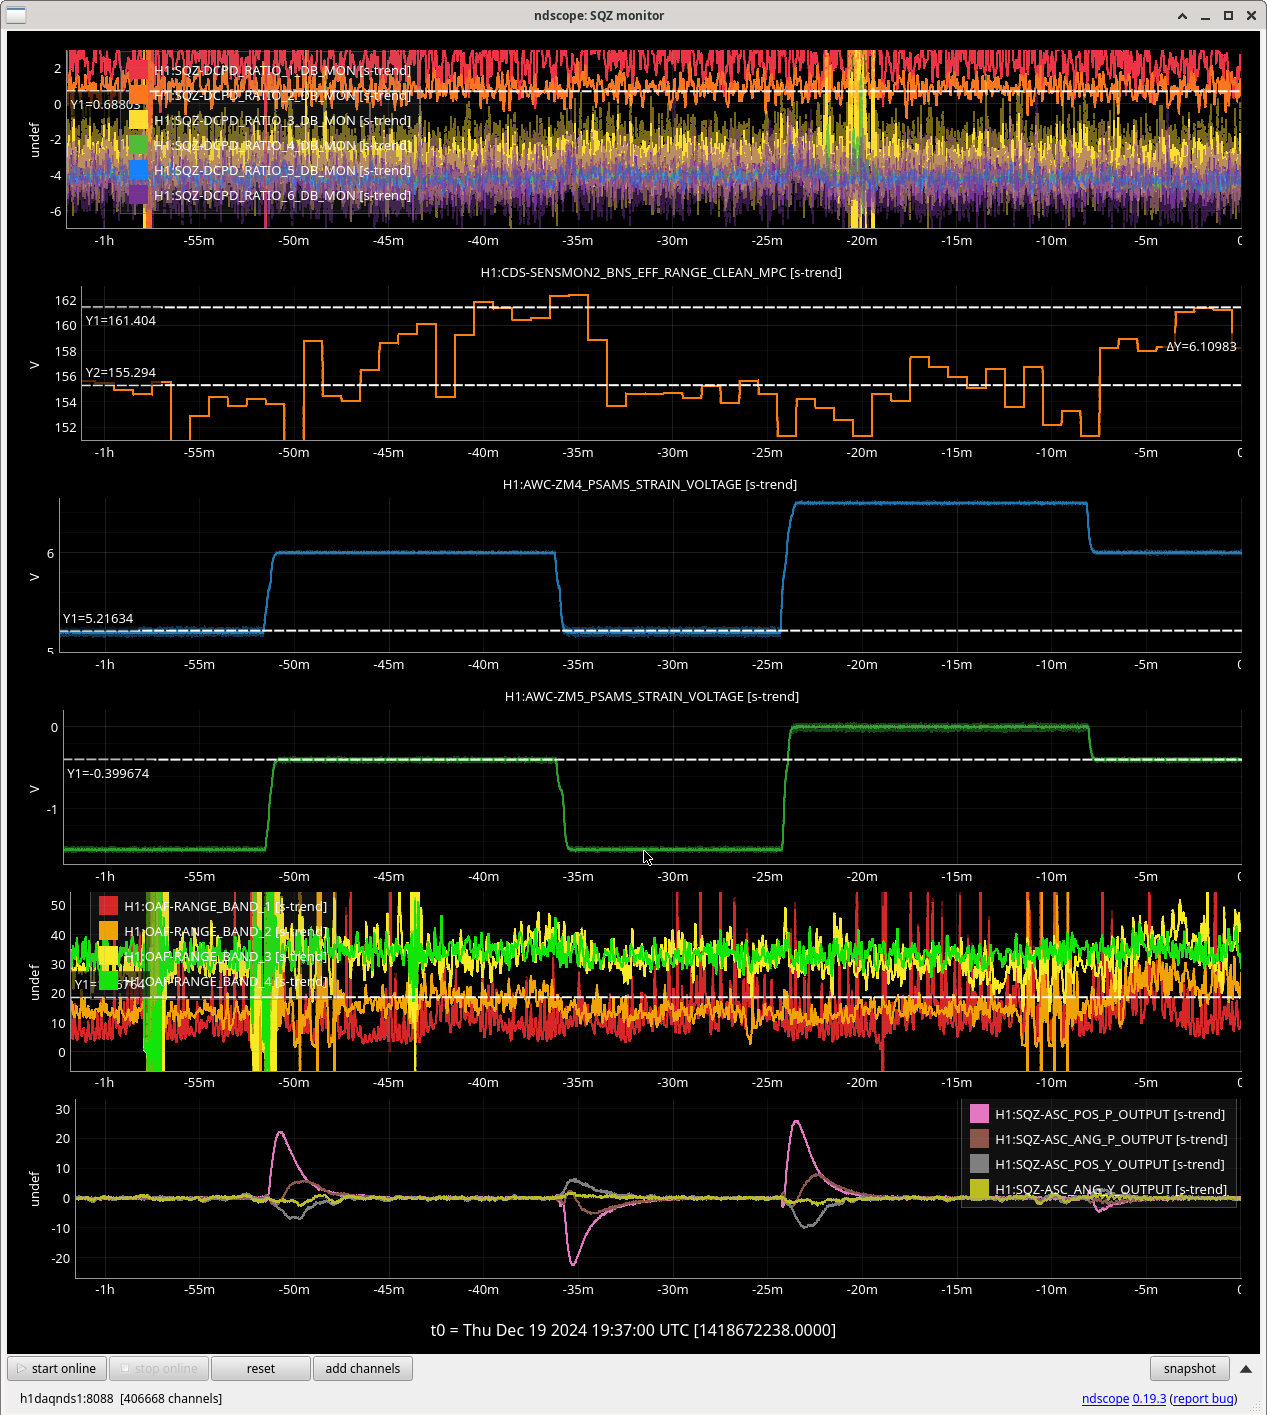
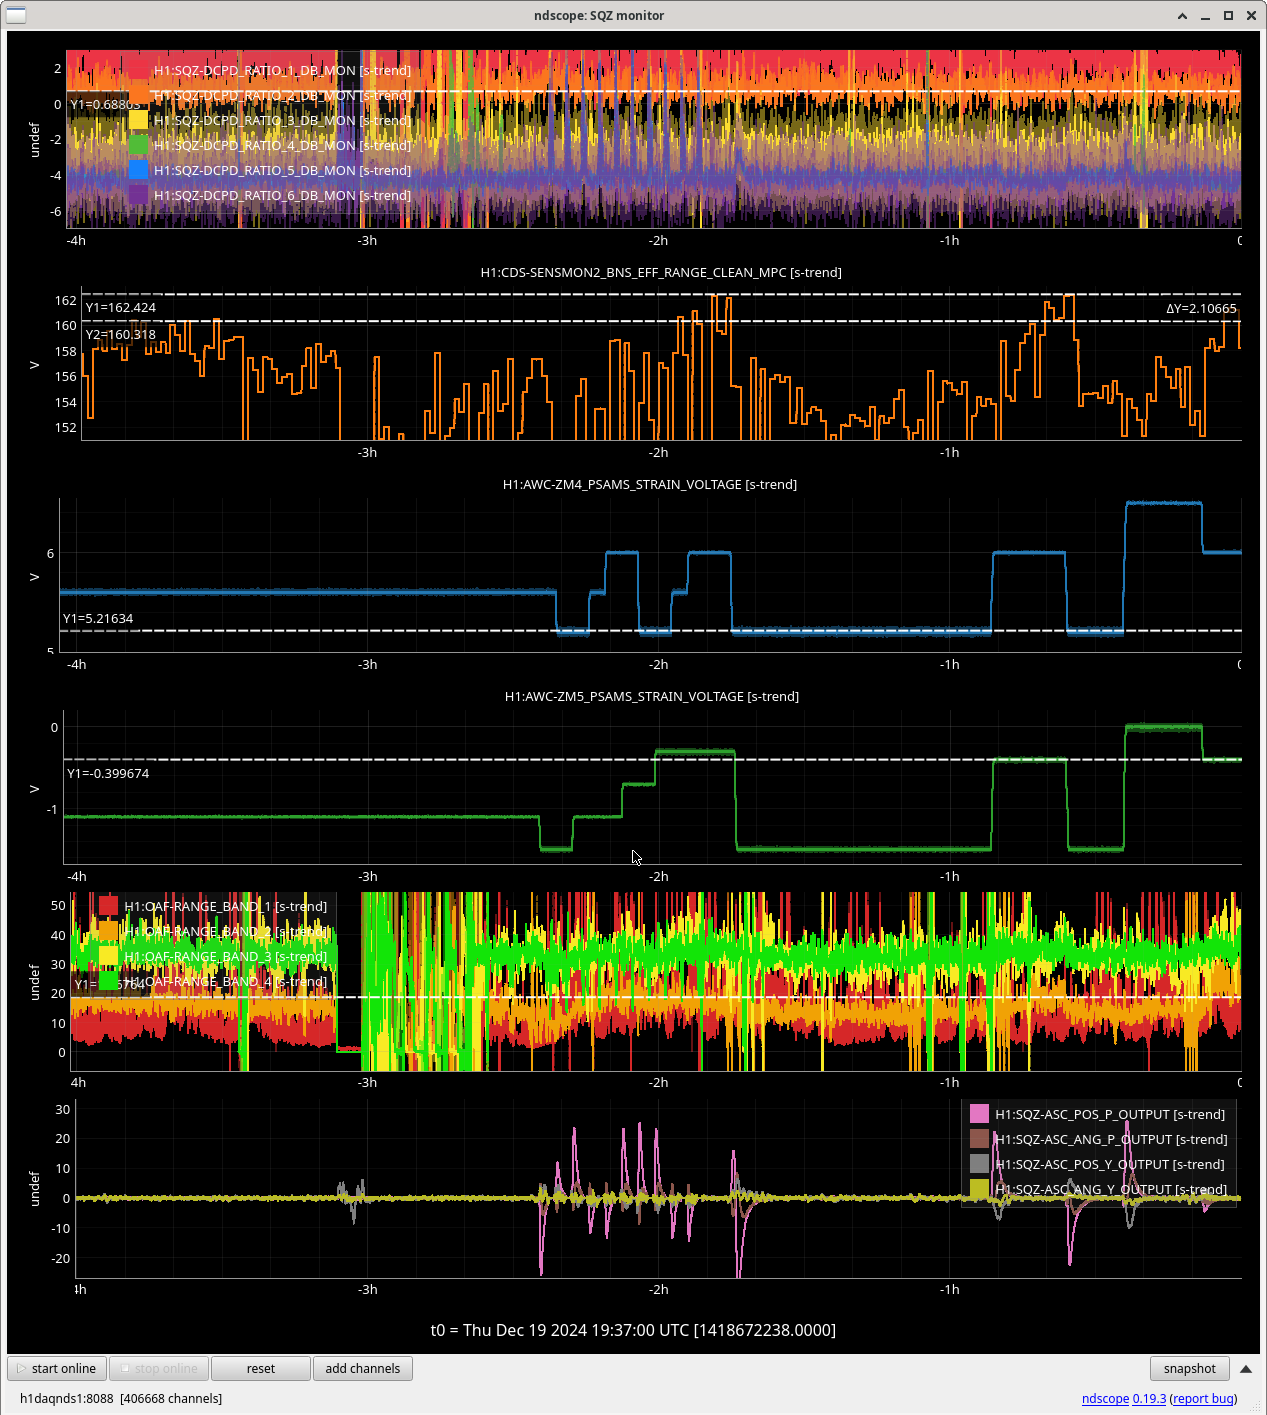
Range looks fairly steady around just under 160 for the whole lock, the coherence check yielded.