Following up on the data reported in LHO-60358 and LHO-60356, here I am comparing the beam profiles and inferred defocus as the PSAMS PZT voltage is scanned, for comparison to previous data from the Caltech Zygo and strain gauges. Yes, I am agonizing over 1% level mode matching.
First is a check of the beam profile towards ZM4 from the OPOS. ZM4ZM5.pdf. Shows the data from LHO-60356 in the ZM4scan and then propagated with the 105mD of ZM4 at 0V measured in E2100289. ZM5 shows the scan taken after ZM4 and assuming the 105mD, and they align well. The SQZIFO/MM_L1 is the mode scan of B:L1 from the optics lab in LHO-59036, it is propagated through B:L2 and off of the platform, and it matches with the HAM7 data. The beam target is projected from the interferometer cavity modes for reference and it has an overlap of 99.2% with these scans. Notably, the beam size on ZM4 (and thus ZM5) is a bit smaller than nominal. This can be corrected using ZM4 PSAMS to expand the beam onto ZM5 and then ZM5 to fix the divergence angle.
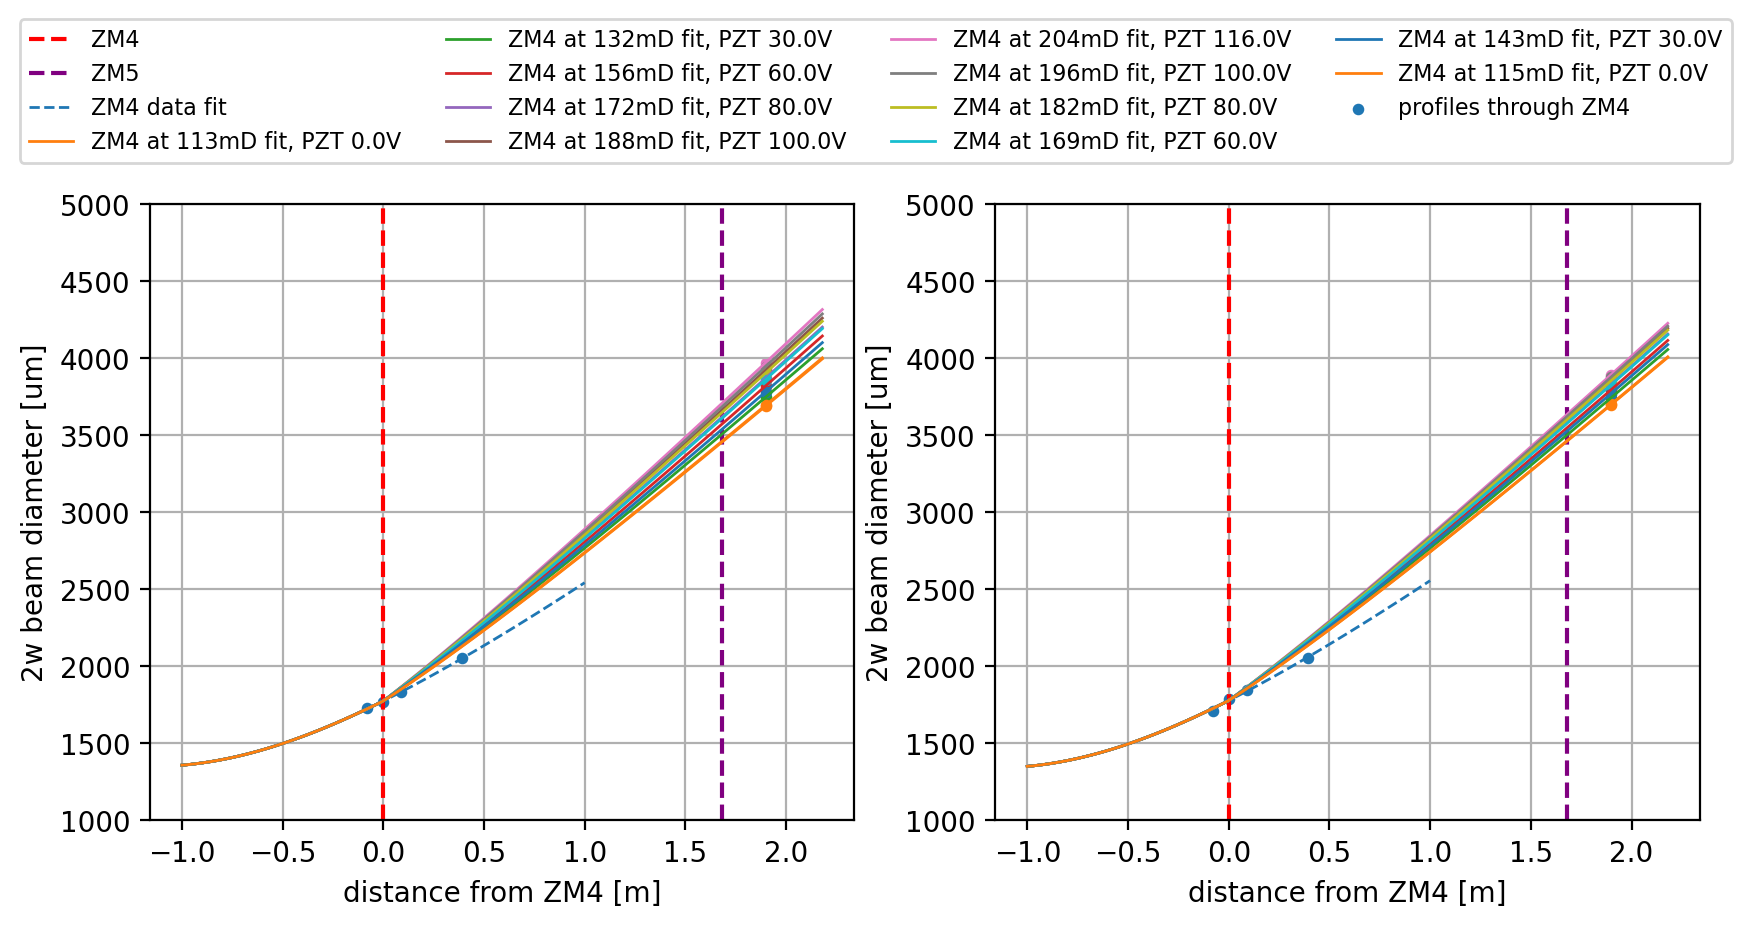
We took beam scans with a pickoff before ZM5 to determine the ZM4 PSAMS actuation. This is shown in HAM7_beam_profiles.png. It has this associated data table:
ZM4 PZT [V] ZM4 strain diam X [um] defocus X diam Y [um] defocus Y
gauge [V] [mD] [mD]
------------- ------------ ------------- ----------- ------------- -----------
0 11.05 3690 113.472 3699 109.233
30 10.53 3748 132.159 3744 123.701
60 9.9 3821 155.607 3796 140.383
80 9.44 3872 171.943 3833 152.228
100 8.99 3923 188.244 3866 162.777
116 8.57 3972 203.875 3894 171.717
100 8.8 3947 195.904 3878 166.61
80 9.14 3905 182.495 3855 159.263
60 9.53 3863 169.063 3828 150.629
30 10.23 3783 143.411 3772 132.688
0 11.01 3696 115.408 3702 110.198
Note in the figure and in the table, the X data is slightly larger than the Y data at higher voltages, implying a voltage-dependent astigmatism. This isn't so bad on ZM4, as the beam is w~=1mm and the actuator is weak, but this level (30mD) of astigmatism is problematic on ZM2 and ZM5 if it is real. I think actually that our data must have gotten some bias from room lights or being near the edge of the scanner. The main reason for that is that this astigmatism never appeared on the Zygo measurements at CIT. I have been analyzing the ZM mirror data to look for hints of aberration induced by the optic stress. curvatureD_00V.pdf, curvatureD_50V.pdf, curvatureD_110V.pdf show the beam-placement localized astigmatism by convolving the mirror map with the HG modes. In those plots w=2mm rather than ZM4's w=1mm because the resolution is slightly to make good measurements with the realistic beamsize. You see that the astimatism is ~5-10mD, which is characteristic of many of the PSAMS measurements, it also changes very slightly over the PSAMS voltage, but only by 3-5mD, not by 30mD.
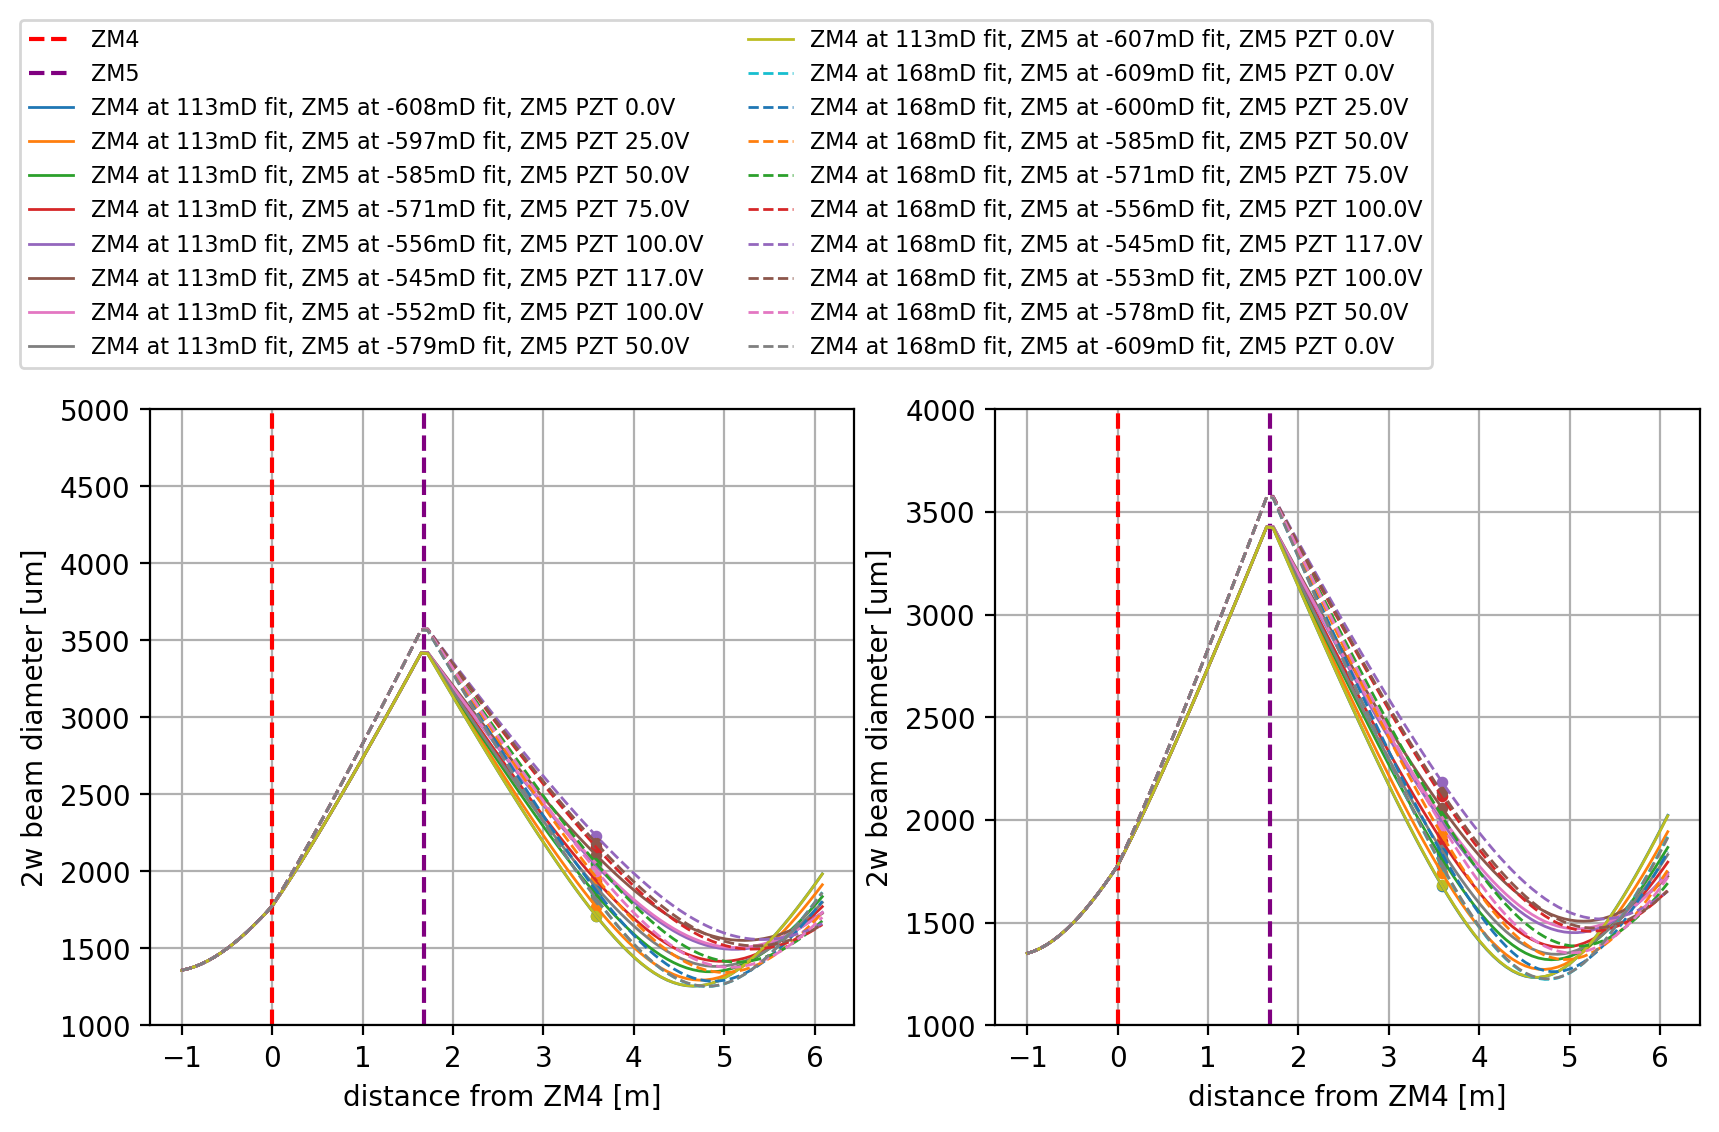
The second reason to not trust the ZM4 astimatism data is that the second dataset with the beam reflecting from ZM5 is more consistent if you assume the same defocus on ZM4 for X and Y. The data and fits are plotted HAM7_beam_profiles_ZM5.png. They correspond to the data.
ZM4 PZT [V] ZM4 strain ZM4 defocus ZM4 defocus ZM5 PZT [V] ZM5 strain diam X [um] ZM5 defocus diam Y [um] ZM5 defocus ZM5 q_X ZM5 q_Y
gauge [V] X [mD] Y [mD] gauge [V] X [mD] Y [mD]
------------- ------------ ------------- ------------- ------------- ------------ ------------- ------------- ------------- ------------- ------------- -------------
0 11.03 113 109 0 -8.68 1710 -602.213 1681 -607.664 -2.997+1.159i -2.945+1.122i
0 11.03 113 109 25 -9.1 1770 -592.113 1744 -597.054 -3.075+1.232i -3.025+1.196i
0 11.03 113 109 50 -9.6 1849 -578.927 1815 -585.199 -3.183+1.338i -3.119+1.286i
0 11.03 113 109 75 -10.16 1941 -563.708 1900 -571.129 -3.313+1.477i -3.235+1.406i
0 11.03 113 109 100 -10.73 2038 -547.797 1993 -555.866 -3.456+1.645i -3.368+1.555i
0 11.03 113 109 117 -11.16 2105 -536.877 2061 -544.779 -3.559+1.776i -3.469+1.678i
0 11.03 113 109 100 -10.89 2051 -545.674 2016 -552.109 -3.476+1.670i -3.402+1.596i
0 11.03 113 109 50 -9.9 1897 -570.969 1853 -578.894 -3.250+1.409i -3.170+1.338i
0 11.03 113 109 0 -8.68 1711 -602.044 1683 -607.326 -2.998+1.160i -2.947+1.125i
And then with ZM4 at its nominal 100V, and not assuming the ZM4 astigmatism.
ZM4 PZT [V] ZM4 strain ZM4 defocus ZM4 defocus ZM5 PZT [V] ZM5 strain diam X [um] ZM5 defocus diam Y [um] ZM5 defocus ZM5 q_X ZM5 q_Y
gauge [V] X [mD] Y [mD] gauge [V] X [mD] Y [mD]
------------- ------------ ------------- ------------- ------------- ------------ ------------- ------------- ------------- ------------- ------------- -------------
100 8.97 168 162 0 -8.68 1821 -602.509 1777 -609.428 -3.143+1.154i -3.069+1.106i
100 8.97 168 162 25 -9.08 1875 -593.983 1838 -599.771 -3.217+1.219i -3.150+1.175i
100 8.97 168 162 50 -9.62 1960 -580.646 1929 -585.467 -3.338+1.330i -3.276+1.288i
100 8.97 168 162 75 -10.16 2052 -566.31 2021 -571.116 -3.477+1.467i -3.410+1.417i
100 8.97 168 162 100 -10.74 2158 -549.902 2116 -556.394 -3.645+1.648i -3.555+1.570i
100 8.97 168 162 117 -11.15 2230 -538.815 2188 -545.294 -3.765+1.789i -3.671+1.702i
100 8.97 168 162 100 -10.89 2183 -546.048 2135 -553.46 -3.686+1.696i -3.586+1.604i
100 8.97 168 162 50 -9.9 2006 -573.466 1976 -578.123 -3.407+1.396i -3.343+1.352i
100 8.97 168 162 0 -8.68 1823 -602.193 1781 -608.793 -3.145+1.157i -3.074+1.111i
Then, for comparison, look at the data when astigmatism is assumed.
ZM4 PZT [V] ZM4 strain ZM4 defocus ZM4 defocus ZM5 PZT [V] ZM5 strain diam X [um] ZM5 defocus
gauge [V] X [mD] Y [mD] gauge [V] X [mD]
------------- ------------ ------------- ------------- ------------- ------------ ------------- -------------
100 8.97 188 162 75 -10.16 2052 -573.587
100 8.97 188 162 100 -10.74 2158 -557.461
100 8.97 188 162 117 -11.15 2230 -546.562
100 8.97 188 162 100 -10.89 2183 -553.672
And you see that the ZM5 defocus is not consistent with the ZM4 @ 0V values. Given this, we should perhaps take new pre-ZM4 data.
Finally, I projected what this looks like in terms of the interferometer beam. I have my IFO model and can detune the arm and SRC cavities and see the beam parameters walk around. You can choose different reference-planes for those beam parameters.AWCmeshSQZ_SRM.pdf left plots show in brown the SQZ beam parameter immediately after reflecting from the SRM. In addition it shows the X-arm cavity after transmitting through the SRC (plusses) and the SRC cavity mode (crosses). The different colors of those show the effect of different detunings moving the SRC and ARM modes in different directions. The right plot shows the ARM/SRC overlap with the detunings and indicates that most vertex beam detunings have the same effect on the SRC/ARM overlap. The right plots aren't particularly relevant to the ZM4/5 PSAMS.
AWCmeshSQZ_OMC.pdf shows the beams in the plane of the OMC input. My model doesn't have the OMC with exactly perfect overlap to the (nominal) IFO design, but pretty close. This is why the (left plot) contours are not centered on the IFO beams. You can see in both of these plots that the 99.2% overlap with the target is in the direction that is more difficult to correct.
The brown diamonds for the SQZ beam are in a 3x6 grid, with solid lines over the 3 for ZM4 actuation at 0 (115mD), 50 and 100V (165mD) and the dashed go from -605mD to -545mD. These show that the existing 99.2% mismatch is in the direction that requires mostly ZM4 correction and it might barely reach if extended to 200V. We could go ahead and correct for this now by moving or swapping B:L1, but we should perhaps take some SQZ profiles in HAM6 and possibly OMC scans first.
I planned to do a bit more with the CIT Zygo measurements in the DCC, so I exported it. Here is that data and the tables above in YAML: ZM4_ZM5_scans.txt and ZM4_ZM5_data.mat. useful for comparing the strain gauges. I notice that the defocus I am measuring is a bit far from what is measured on the ZYGO, particularly for ZM5. There are a few possible places between the PZT drivers and the particulars of these phase maps. It is possible that the local beam-size-scale curvature is smaller than the curvature/sag reported over the entire optic surface, if the sag was used to determine the curvature in the DCC tables.


Tagging SUS and ISC.
(1) From where were you reading of the PZT drive high voltage? Off the MEDM screen, i.e. the DC path's voltage readback of the PZT driver, or some raw electrical version via a fluke DVM?
(2) How much “warm up” did you give the PZTs before starting your measurement of the range of the PZTs?
(3) From where did you readout out the strain gauge voltage? Again, off the ADC?
Bigger picture questions to be resolved over the coming days:
(a) You mention you see some astigmatism. I wonder if these are consistent with the data that Camille took at CIT (i.e. <https://dcc.ligo.org/LIGO-E2100288>)?