[Sheila, Keita, Jenne, with input and thoughts from several others]
We have looked at a few things today, trying to understand why the apparent signal level on AS_C changes with the state of the fast shutter. The size of the jump when the shutter is open vs. closed is similar to the expected signal size for true light on the PD. So, with the single-bounce beam, it looks like the amount of light on AS_C doubles when the shutter is opened. There shouldn't be any actual light change on AS_C as a result of the fast shutter state, since AS_C is before the shutter (and in fact used as the trigger for the shutter).
This jump in signal happens with the same amplitude whether or not the IMC is locked. So, opening the shutter makes AS_C look like there is an extra ~5mW on the QPD, even if there is no actual IR light in HAM6. This makes us suspicious of an electronics problem, rather than a mechanical interference with the fast shutter wires, or some optical thing like scattered light. Also, the signal is not affected if we move either SRM, OM1, OM2, or OM3 when there is light in HAM6, which is further evidence that it's not a real beam hitting AS_C.
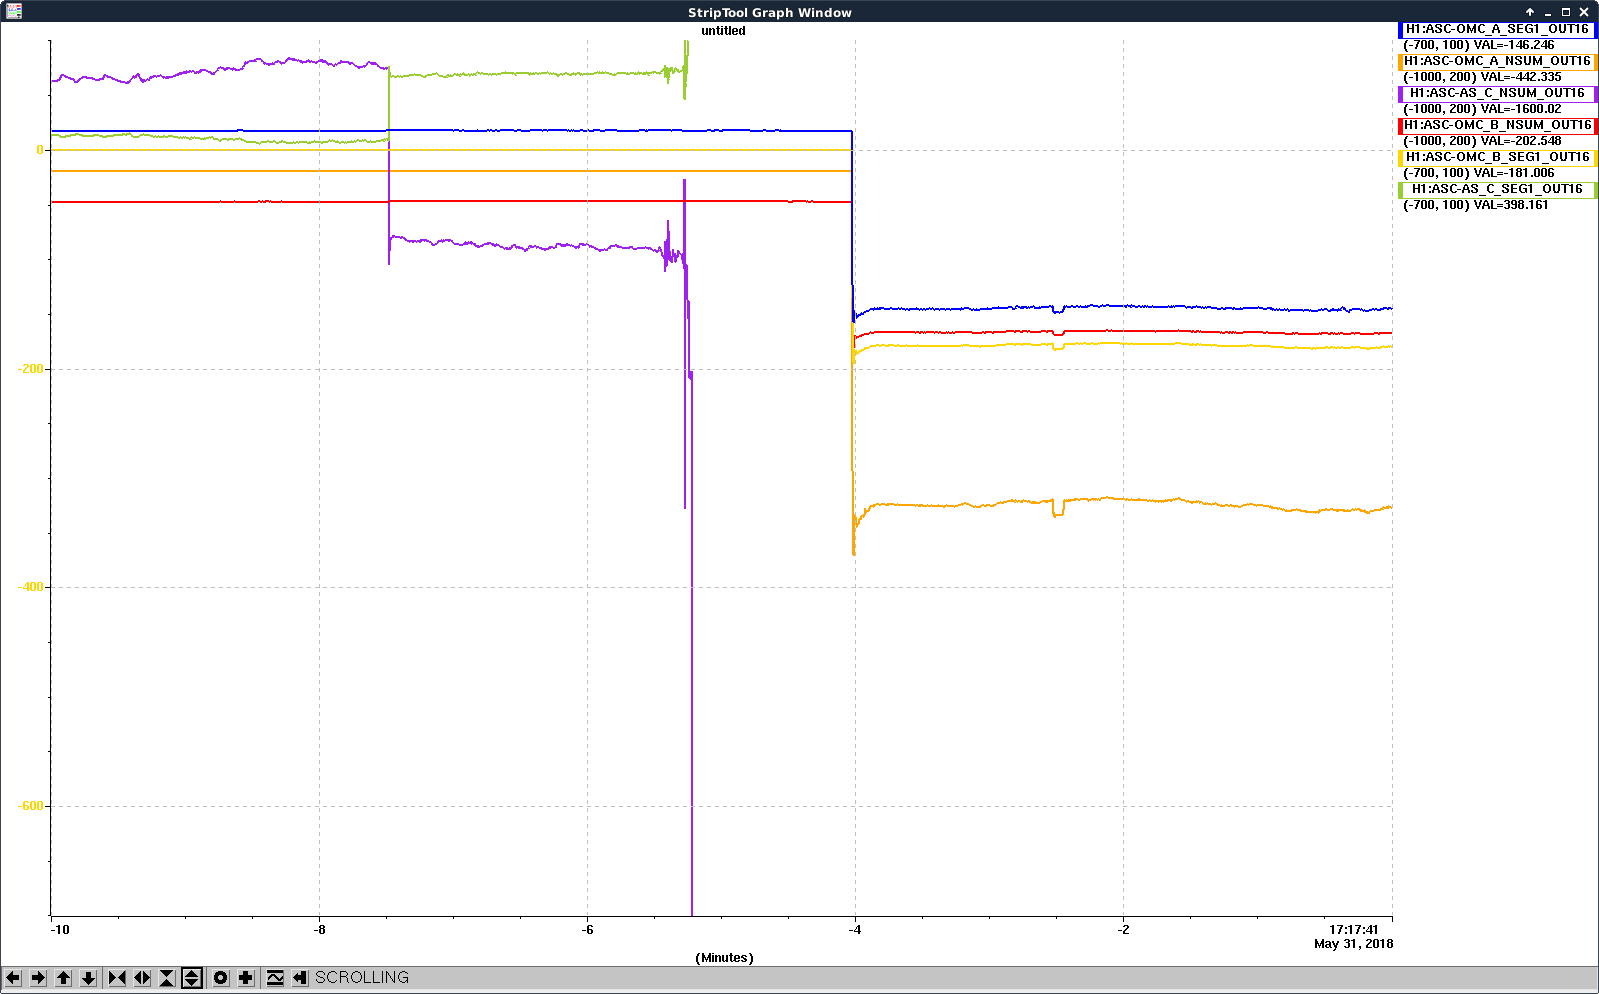
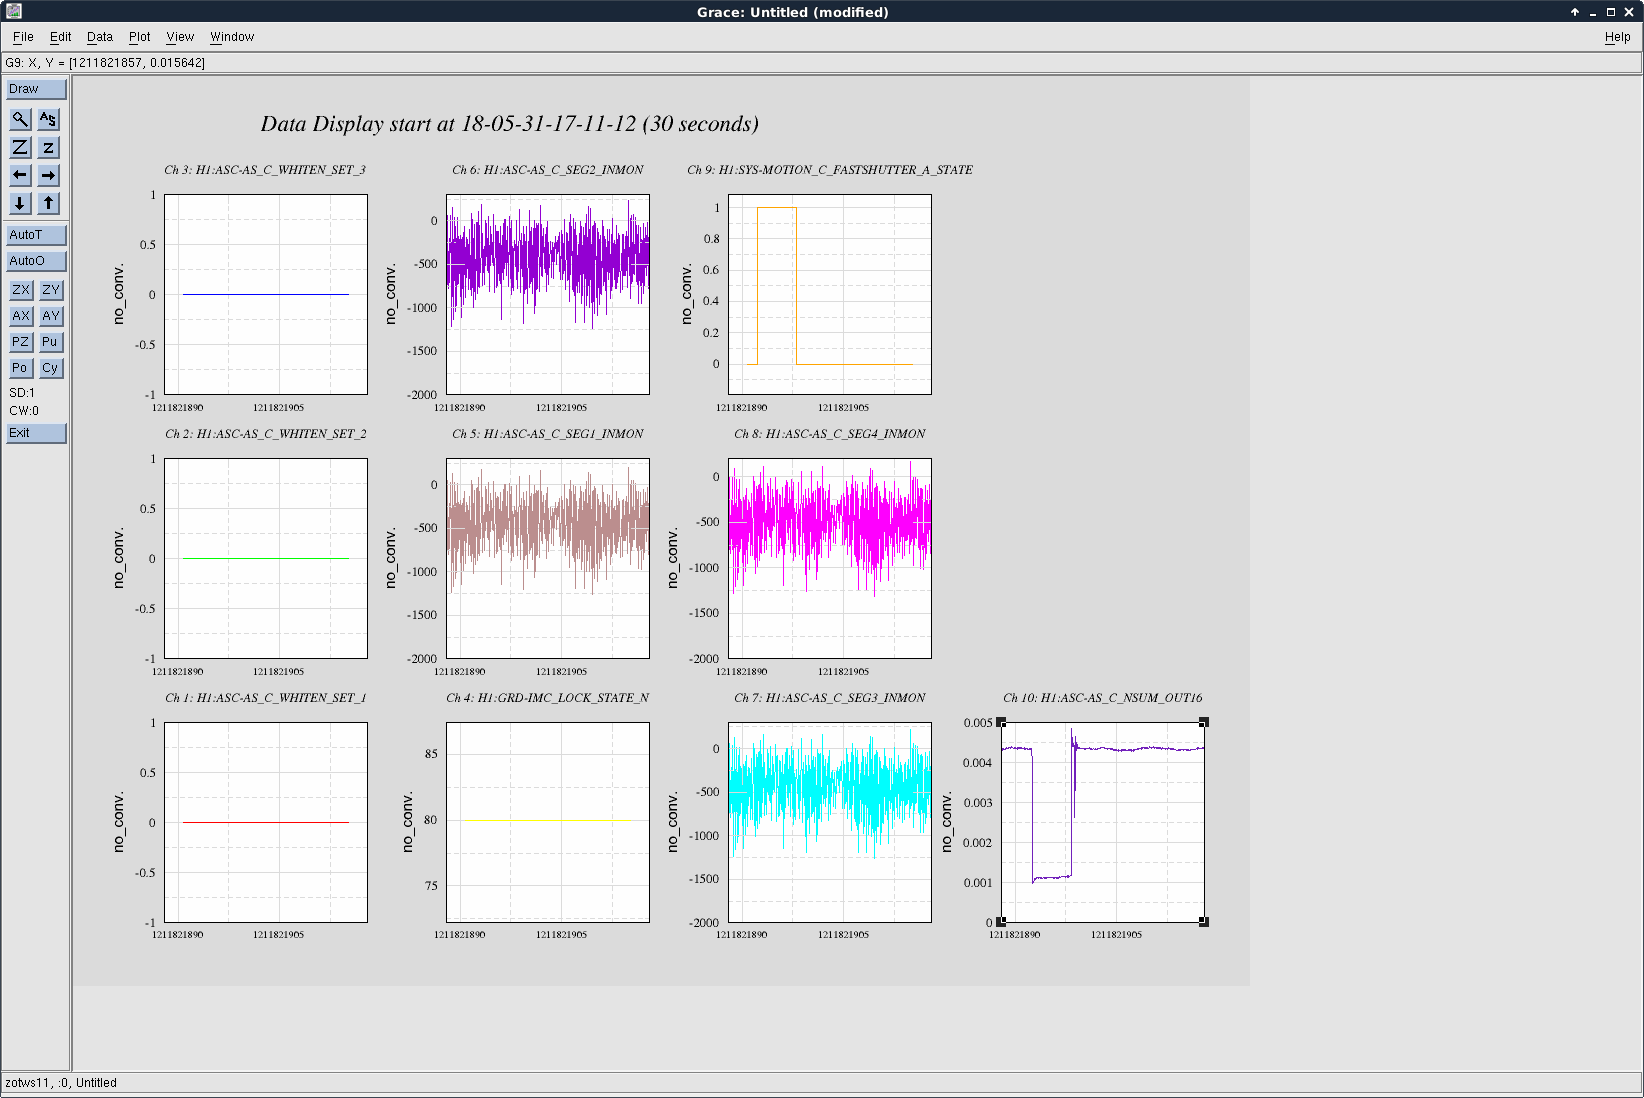
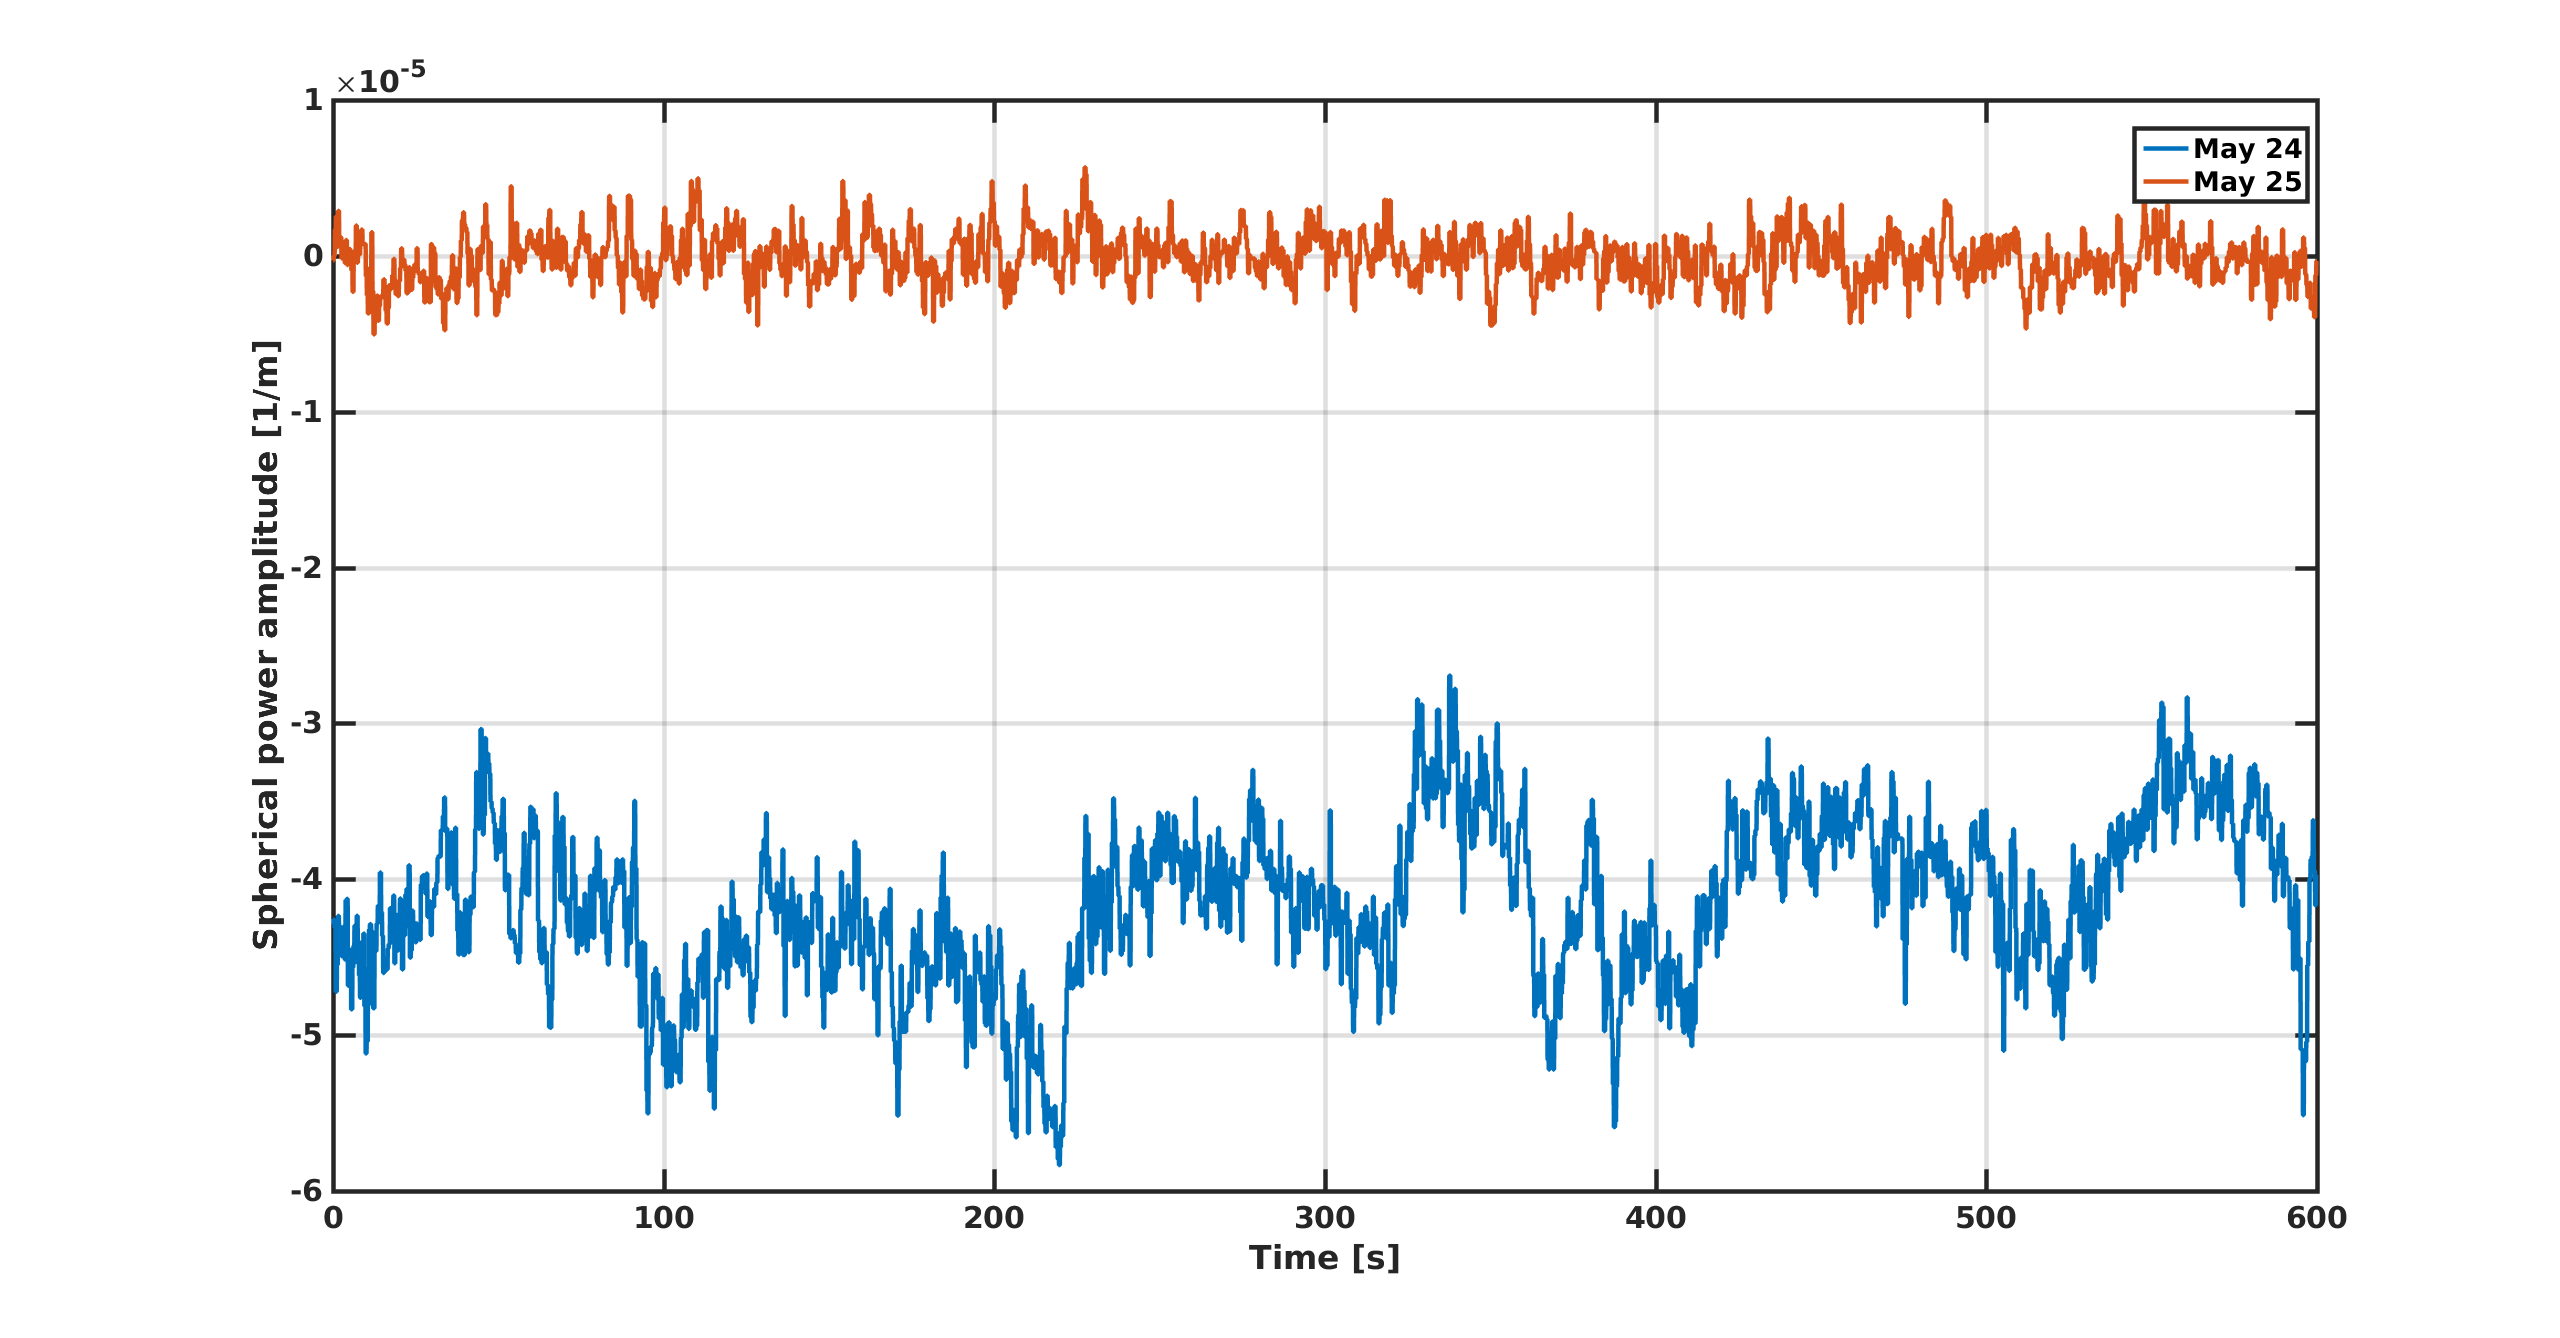
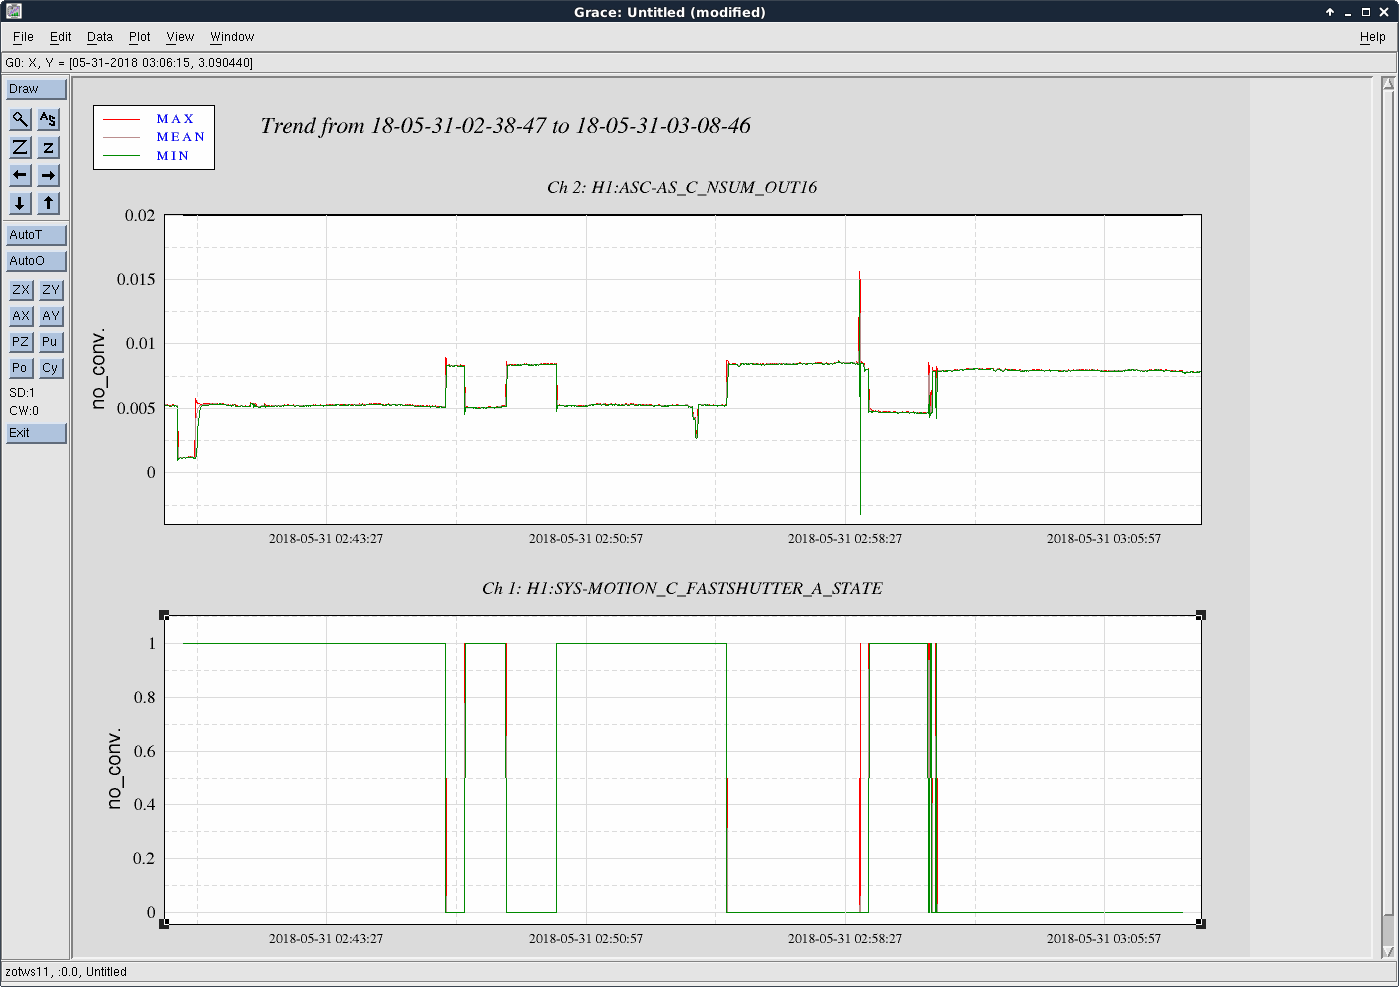
The attached screenshot shows the jump in AS_C_NSUM as well as AS_C_SEG1 (there is a minus sign between them), when we close the shutter. These are the purple and green traces in the strip tool, and the shutter was activated around -7.5 minutes. At -5.2 minutes, we unplugged the input of the AS_C transimpedance amplifier, and plugged the output of the PD to the OMC QPD tranimpedance amp at -4 minutes. At -2.5 minutes I closed and re-opened the shutter. The scale of the NSUM signals are all the same as each other, and the scale of the SEG1 signals are all the same as each other. The whitening gain and filter settings of the OMC QPDs were set to be the same as the AS_C settings at the -7.5 minute time (no whitening filters, gain of 36 dB). So, if the problem were entirely on the PD, we would expect the same size jump when the PD was plugged in to the OMC QPD chassis. Since we don't see nearly the same size jump, it seems like at least some of the problem is in the transimpedance amplifier. Also, the inmons of OMC_A seemed much less noisy (when plugged in to the AS_C PD) than when the AS_C PD is actually plugged in to its regular chassis.
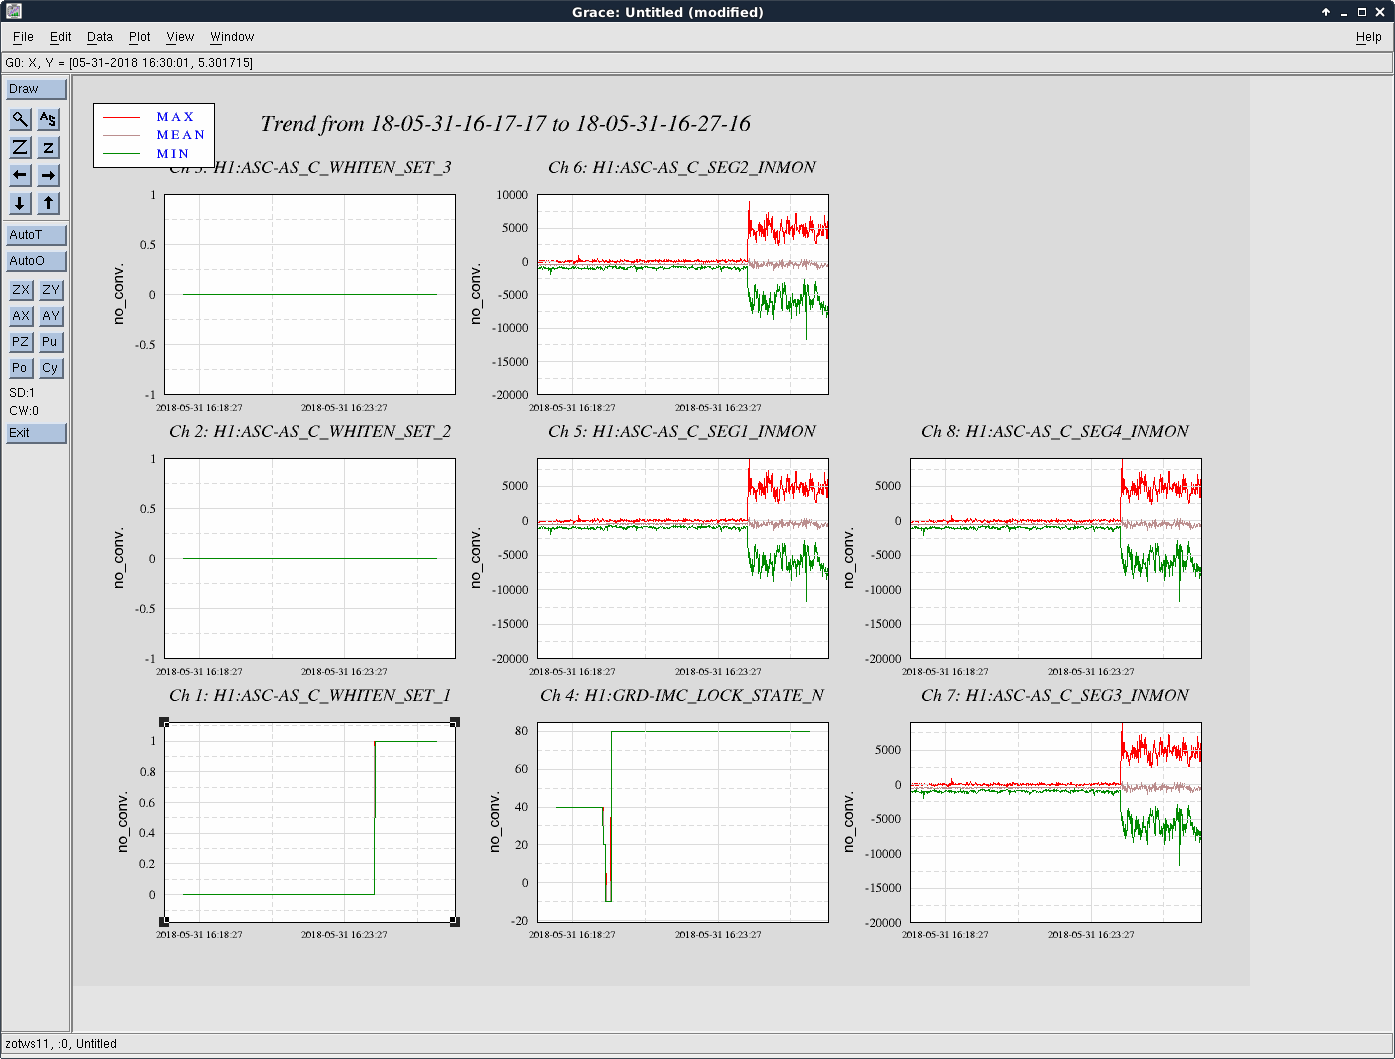
The fact that we do still see a jump, and in both OMC_QPD_A (which should actually have the AS_C signal) and OMC_QPD_B (which should be nothing) makes it seem like there is still potentially some funny business going on.
With no input to the whitening board, we didn't see the jump behavior. So, it's not by itself doing this jumping, but it isn't fully exonerated from being involved in some ground loop craziness. We did observe that the whitening board seems to be switching filters and gains as expected, although there was a weird time at 16:22:15 UTC where 2 of the 4 AS_C segments were totally weird. But, that was not reproduce-able. Sheila has a DTT template saved with that data, where you can see a big difference even below 5 Hz. But, interestingly, when I go back in time and check the INMONs (which should be the same, just slower data rate as the IN1 channels), I don't see any of that discrepancy. Confusing. And, also not reproduce-able thus far.
A good test will be to unplug the OMC DCPDs from the whitening board (which is on the same chassis as AS_C), since that shared connection ties the AS_C ground to chamber ground, and see if AS_C still jumps in a weird way.
There seems to be some extra noise on the analog AS_C sum channel that is used for the fast shutter trigger, when that signal is connected to the trigger controller. We had it T-ed to a 'scope, and then removed the connection to the trigger controller, and saw that the RMS got smaller.
tl;dr: We're still confused by AS_C. Maybe it's a problem with the transimpedance amplifier? We'll have to modify one of the spares, or see if one of the other Lab locations has a modified one, if we're going to switch it out, since it needs the sum channel to come out in analog for the fast shutter trigger.


