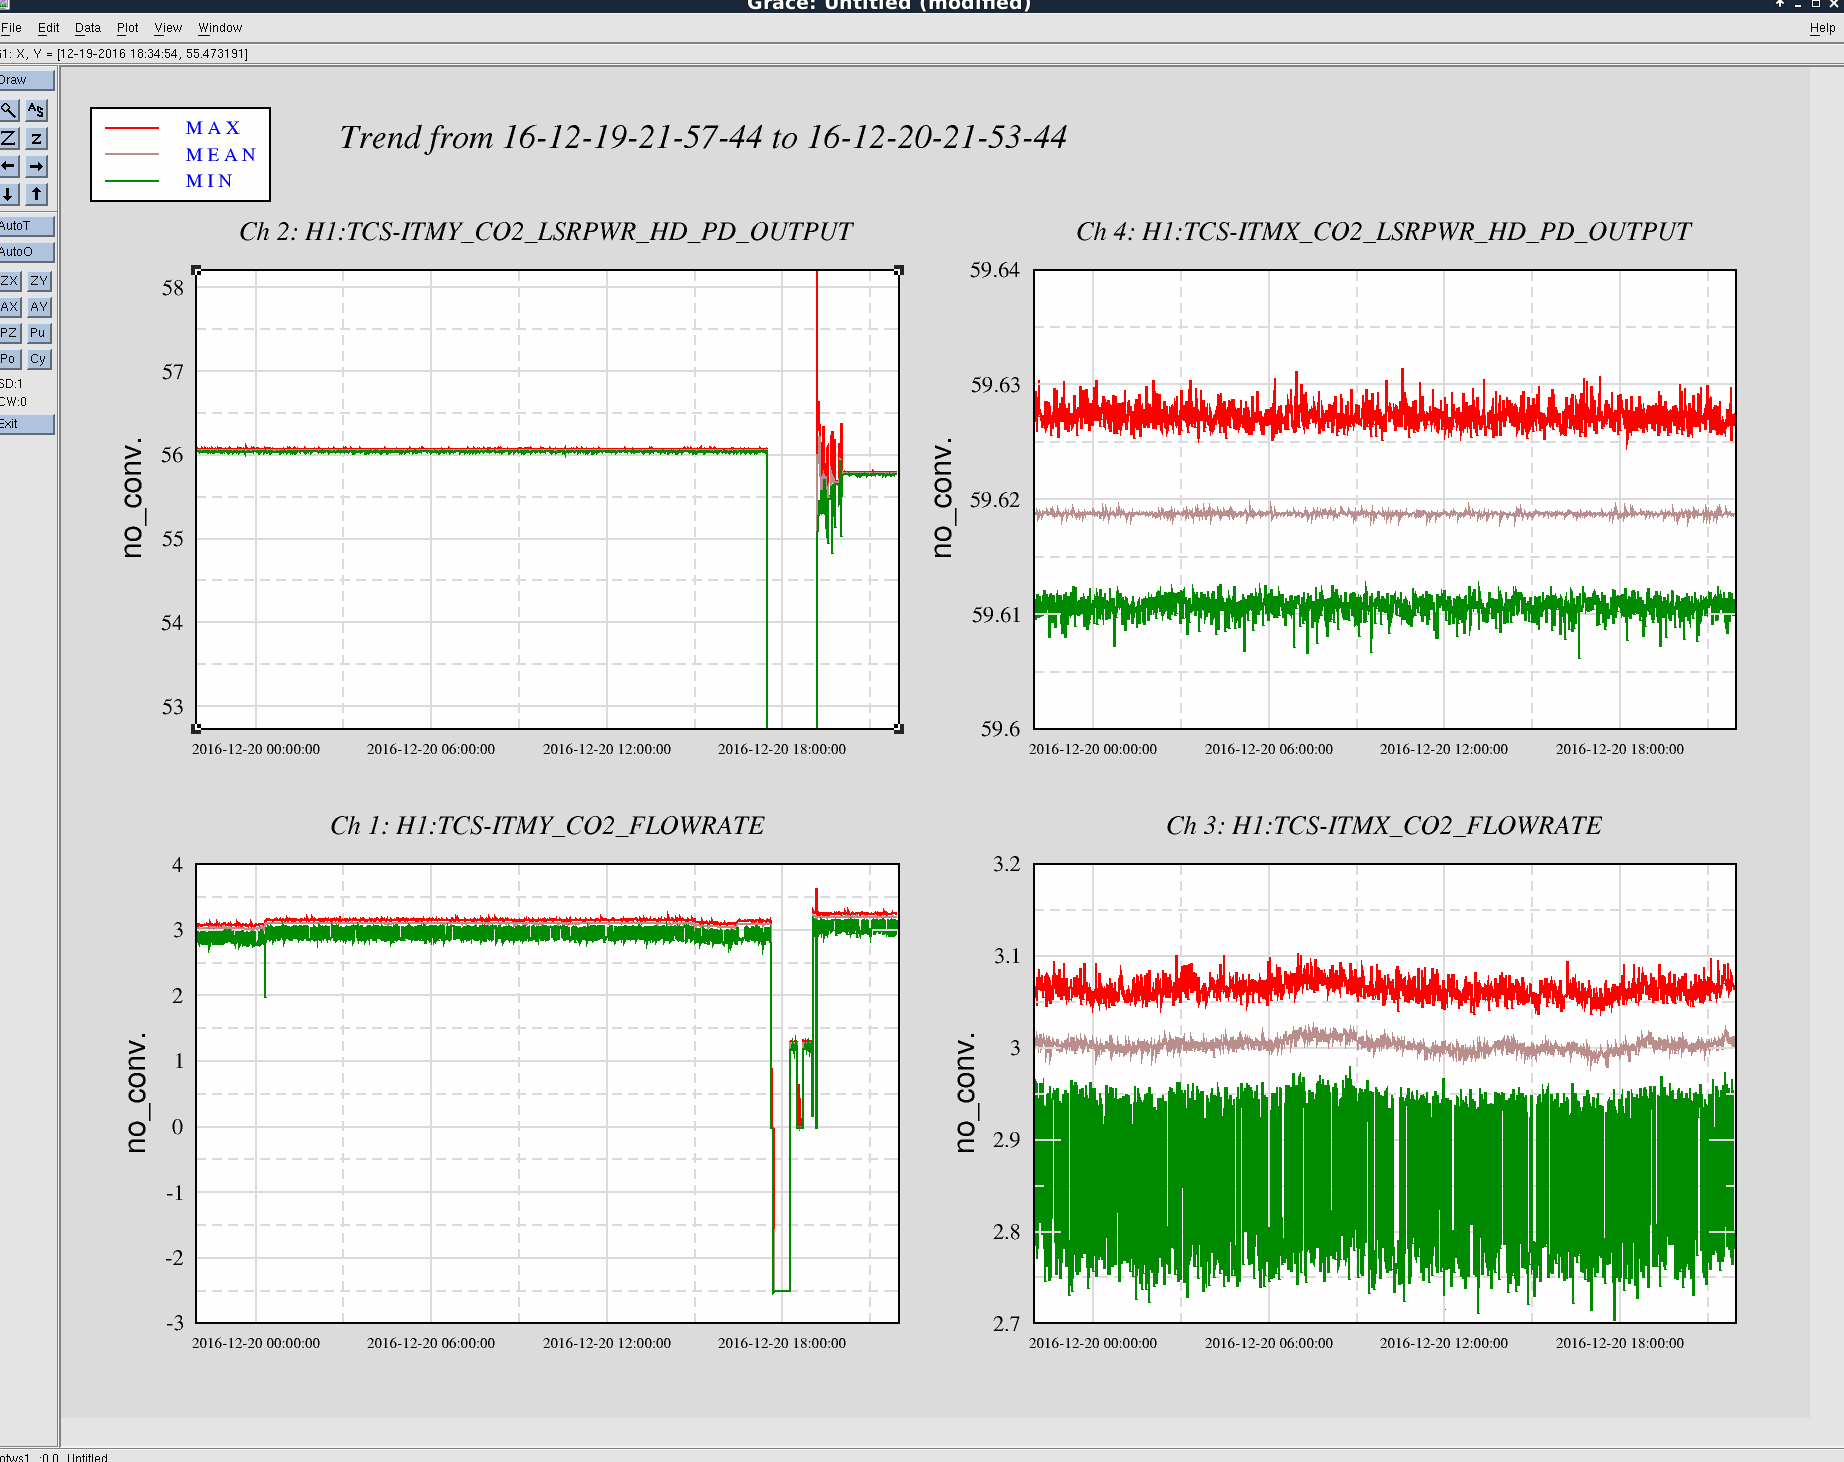
This morning, Jason, Mark and I swapped the assumed-to-be failing TCSY flow sensor which has been showing epochs of glitching and low readout (while other indicators show normal flow, alogs 32712 and 32230). The process to do this was such:
1) Key laser off at control box in rack, LVEA
2) Turn RF off at mezzanine rack, Mech room
3) Turn chiller off on mezzanine, Mech room
4) Turn power off on back of controller box in rack, LVEA (we also pulled the power cable to the sensor off the front of the controller, but it was probably overkill)
5) Close in-line valves under BSC chamber near yellow sensor to-be-swapped, LVEA
6) Quick-disconnect water tubes at manifold near table, LVEA
7) Pulled yelow top off of yellow sensor housing under BSC at the piping, LVEA
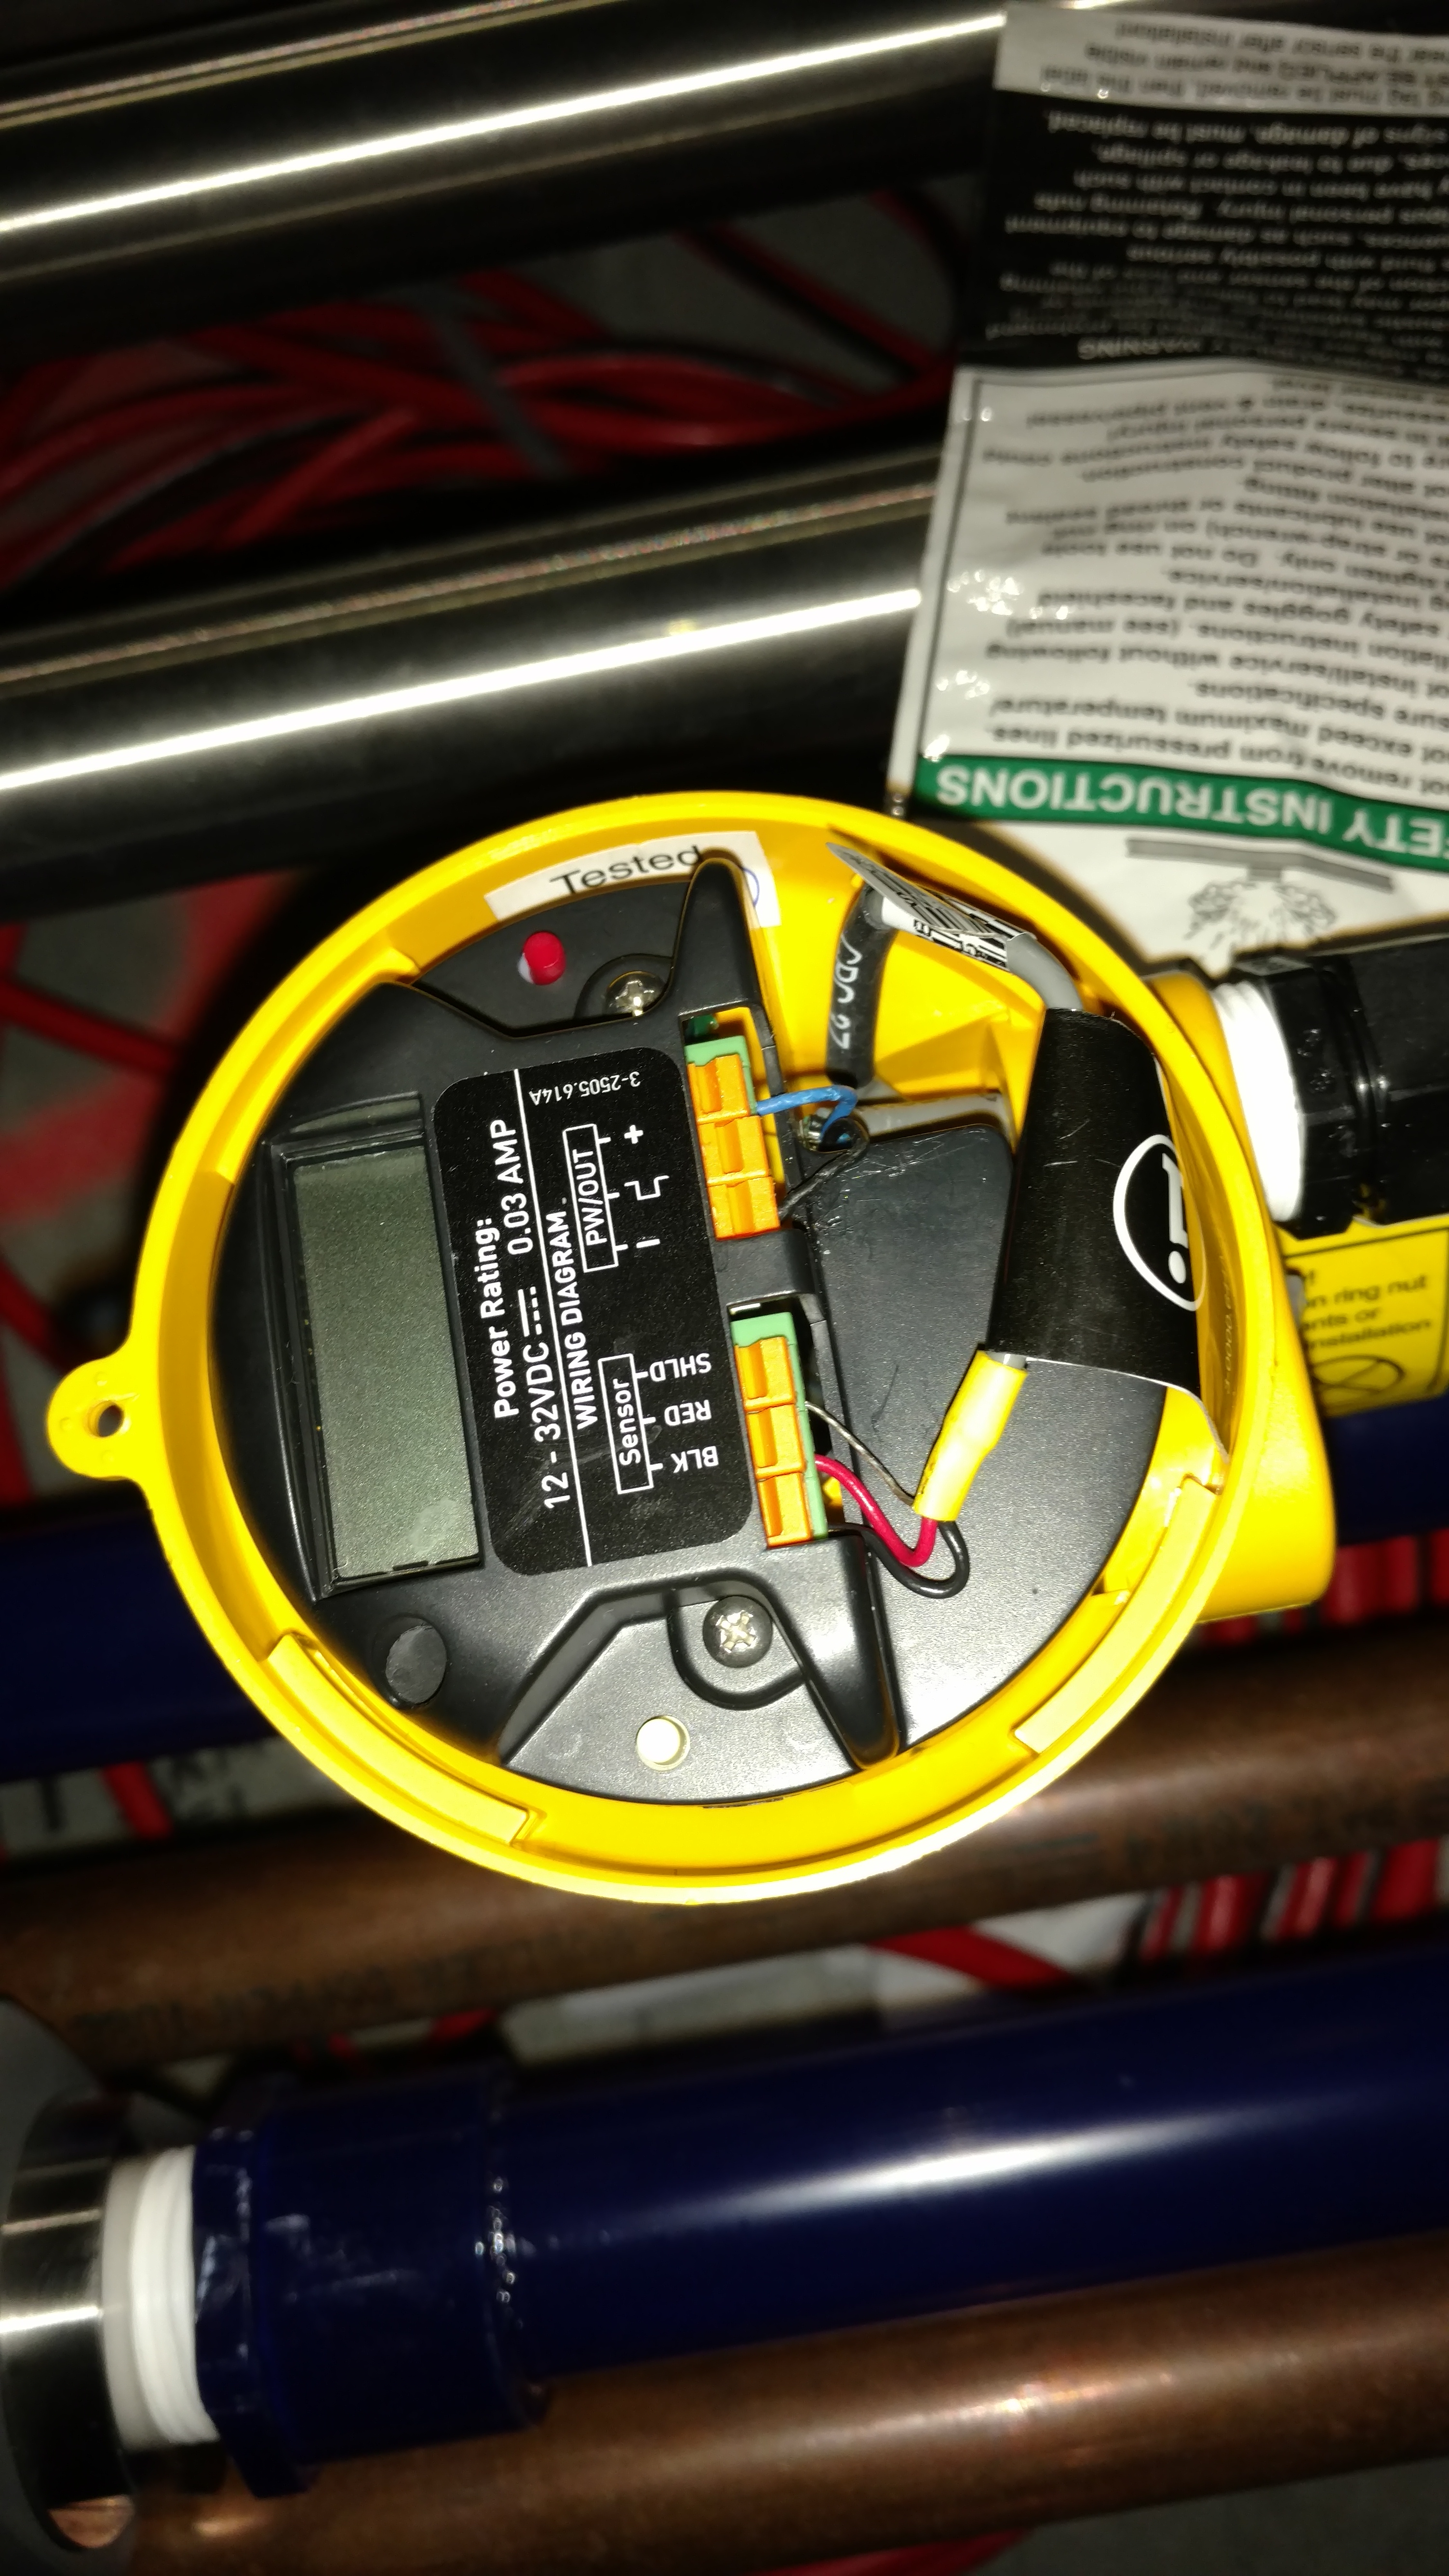
8) Pulled the blue and black wires to the Power recepticles inside the housing (see pic attached). Pulled full grey cable out of housing.
9) While carefully supporting blue piping*, unscrewed large white nut holding housing/sensor to piping (was tough, in fact so tough that we later removed all of the teflon tape which was unneeded in his join)
10) Pull* straight up on the housing (hard) and it comes out of the piping.
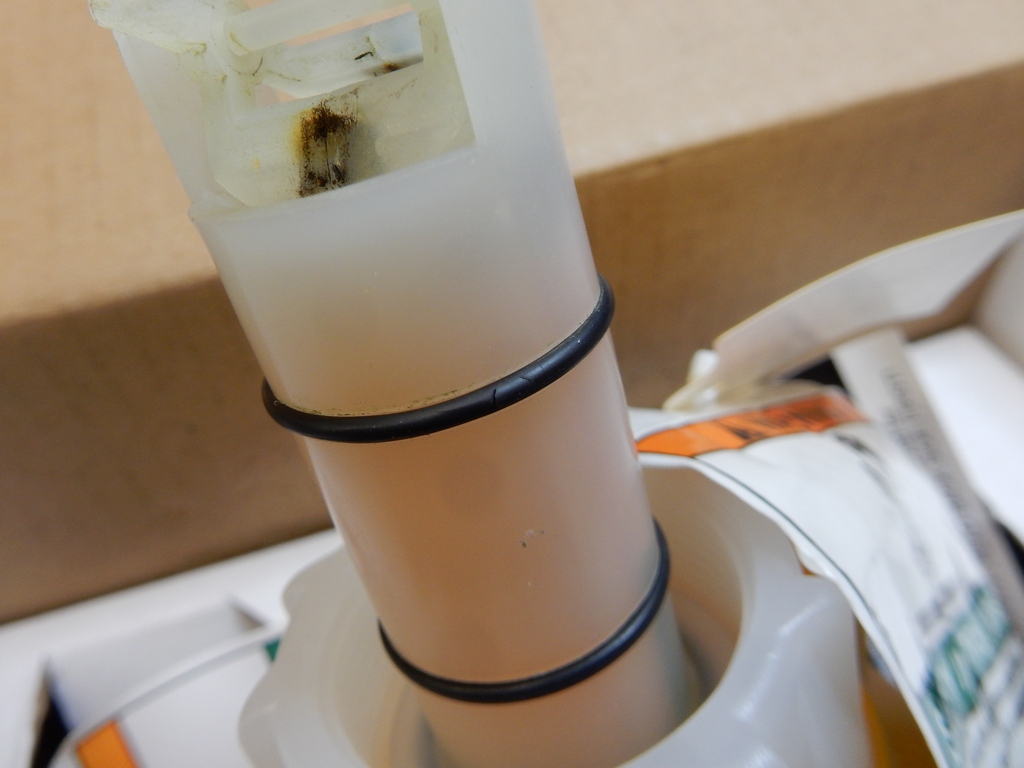
11) Reverse all above steps to insert new housing/sensor, wires and turn everything back on. Watch for rolled o-rings on the housing and proper alignment of the noth feature when installing the new sensor. Verify mechanical flow sensors in piping line show ~3-4 G/m readout when flow/chiller is restored to functionality.
12) Setup new flow sensor head with Settings: Go to the other in-use sensor, pull off the top and scroll through the menu items (red and white buttons on the unit (shown in pic). Set the new head to these values.
13) Verify the new settings on the head are showing a ~3 G/m readout on the medm screen. If not, possibly there is setting on the sensor that needs revisited.
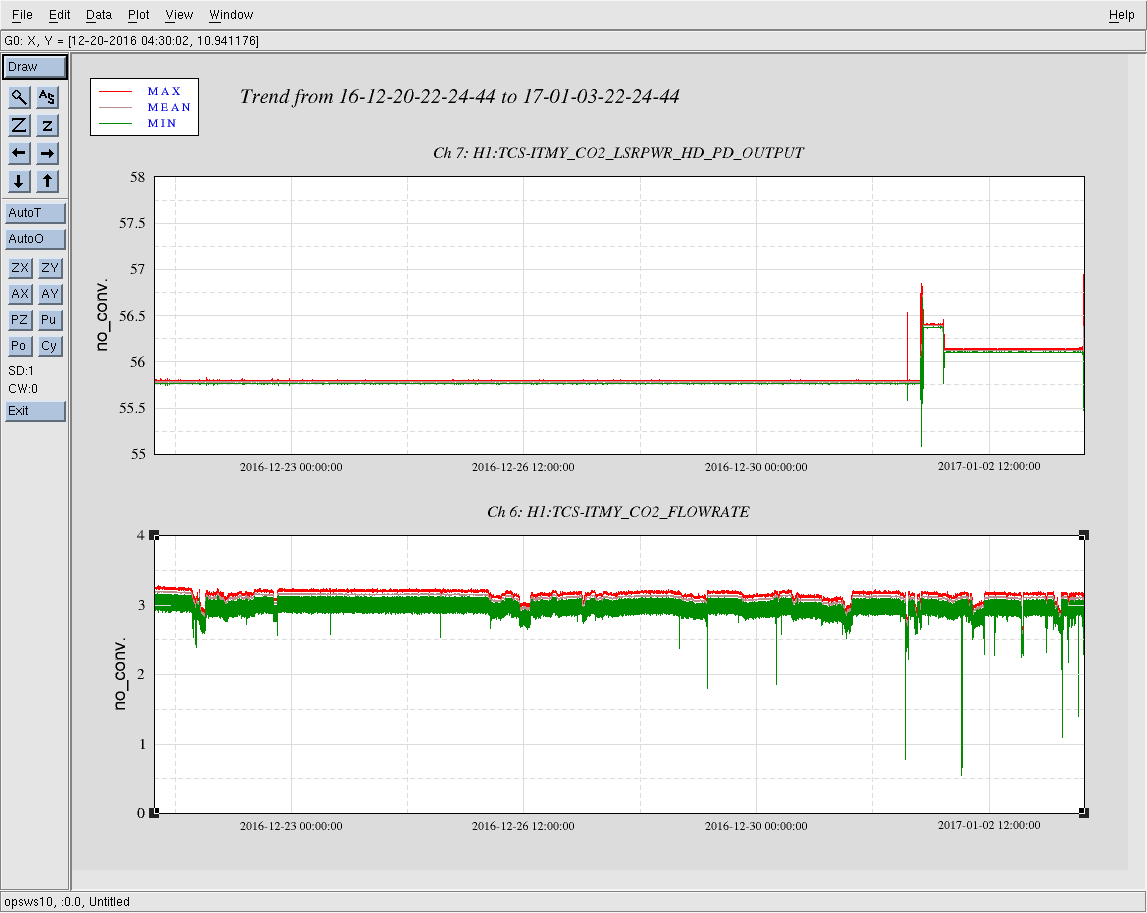
14) Monitor TCS to see that laser comes back up and stabilizes.
* Blue piping can crack so be careful to always support it and avoid torque torque
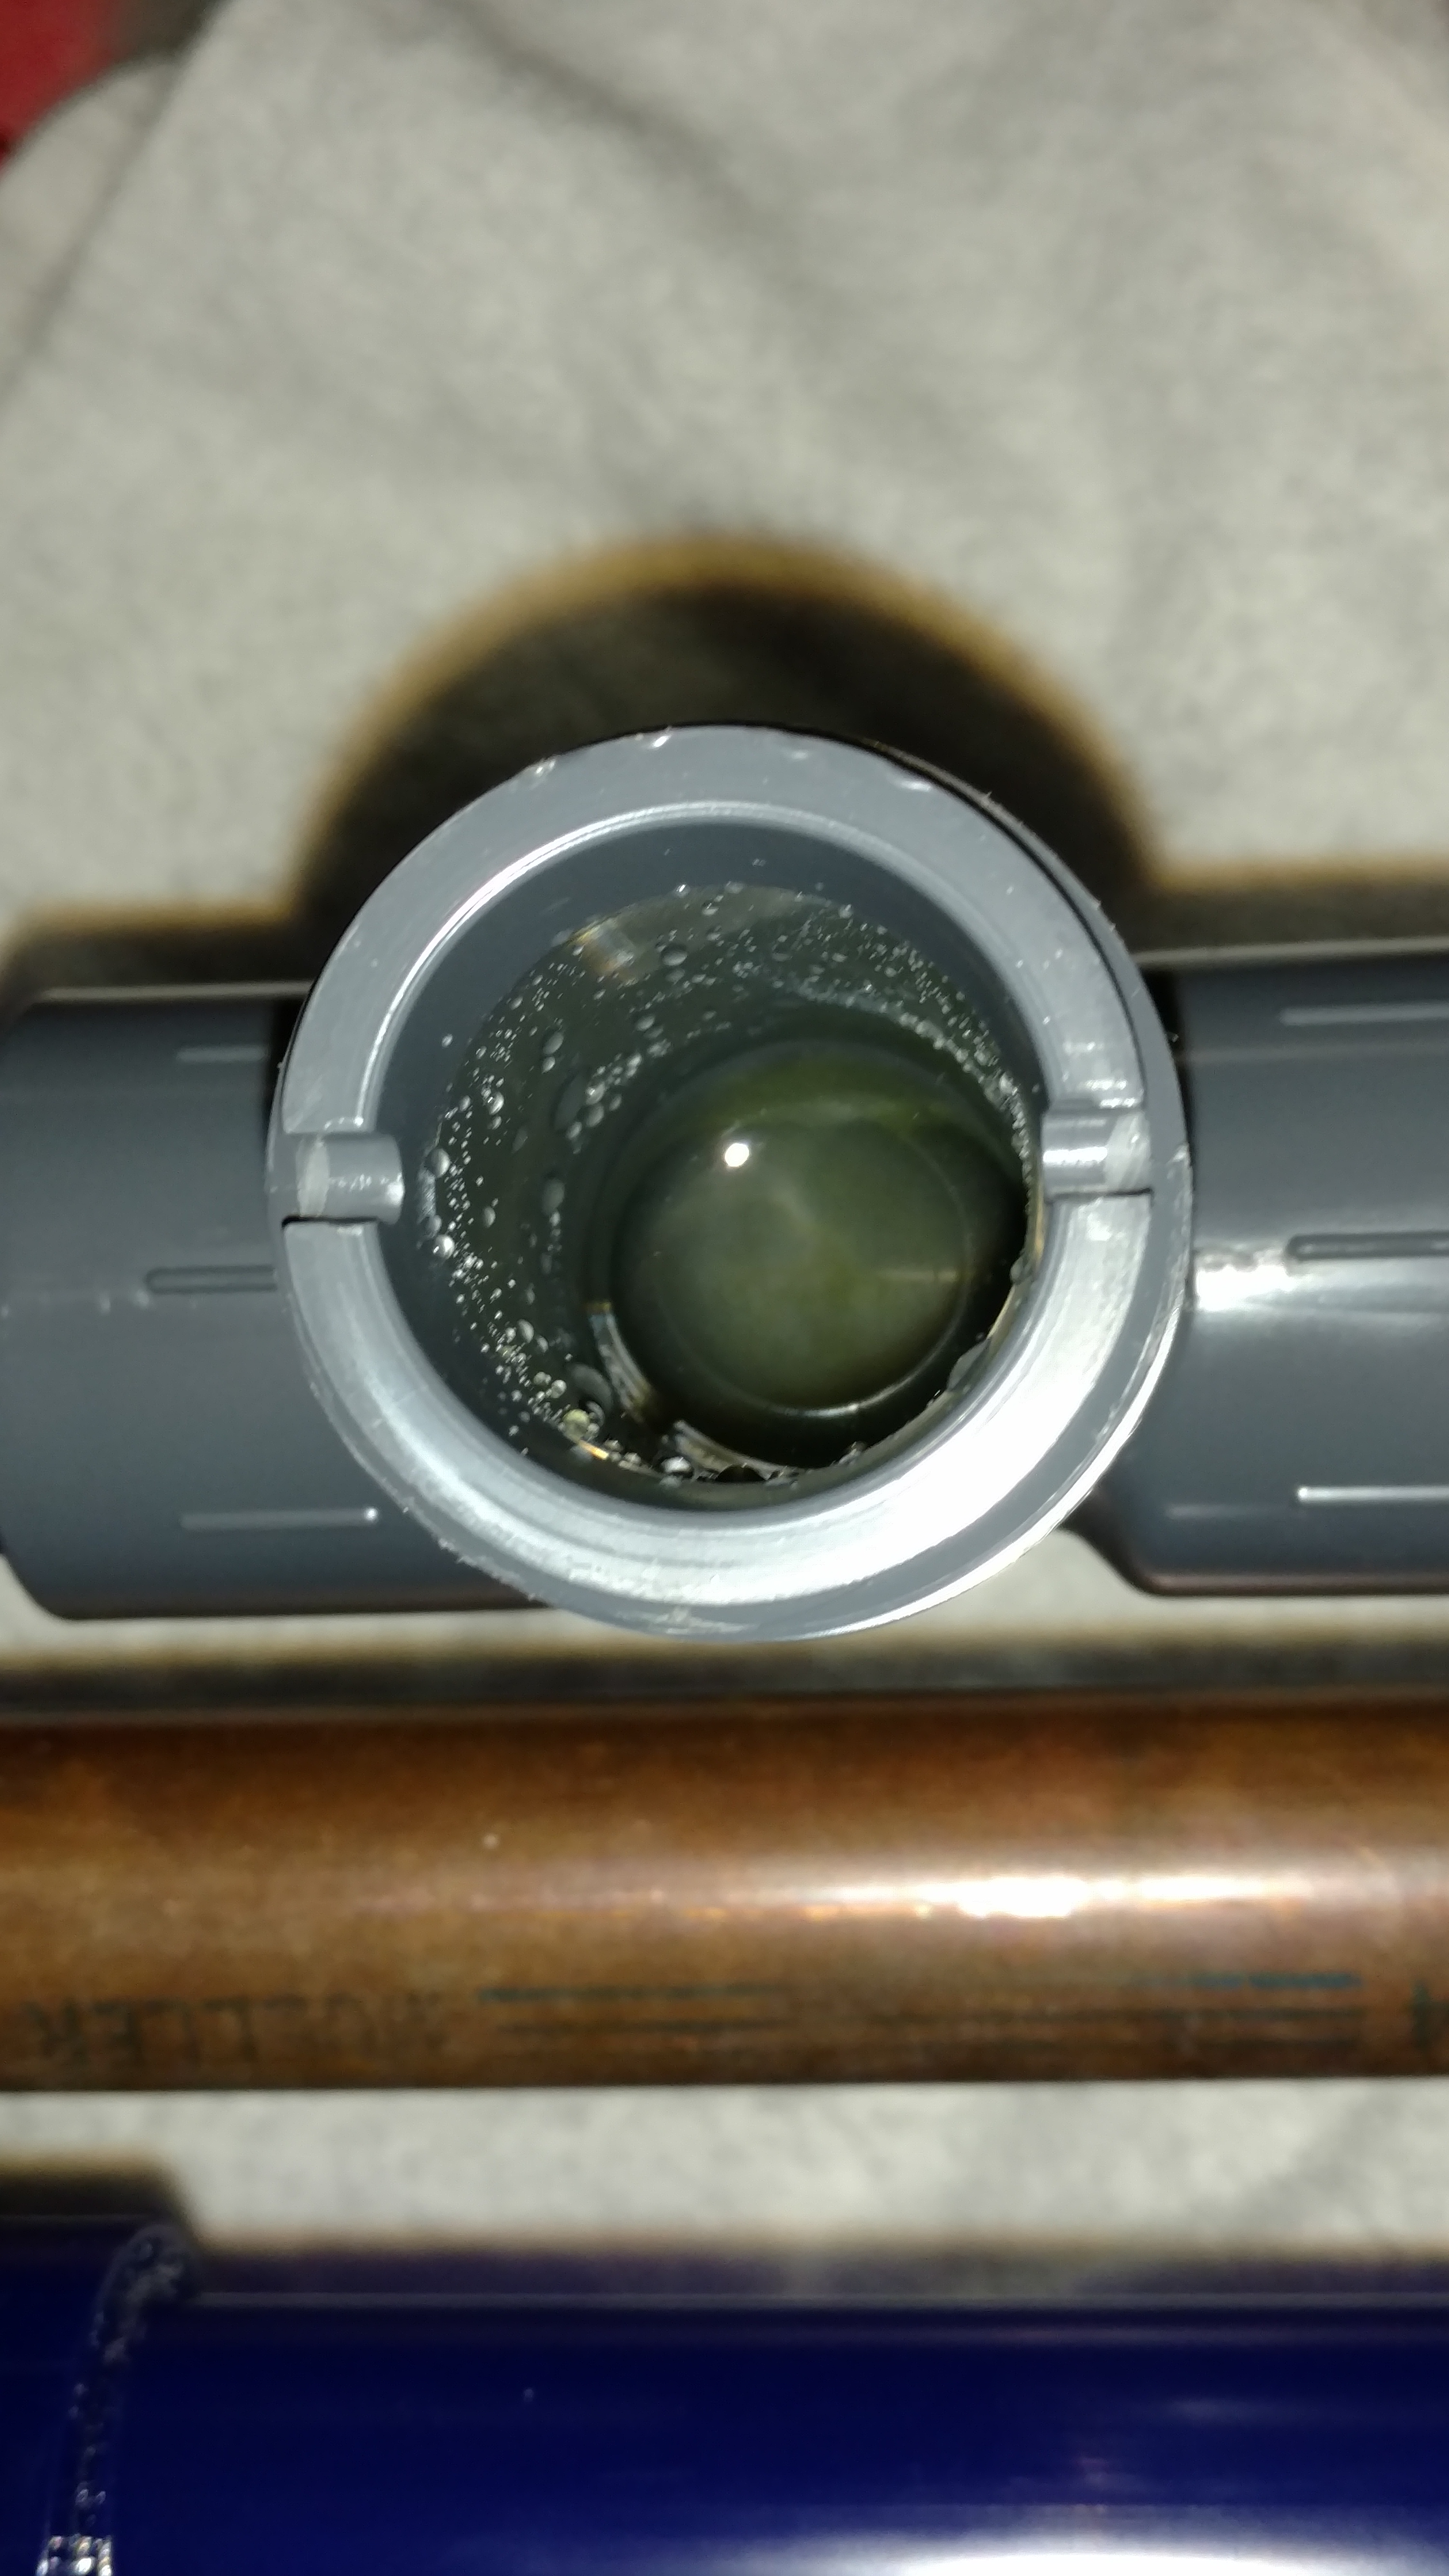
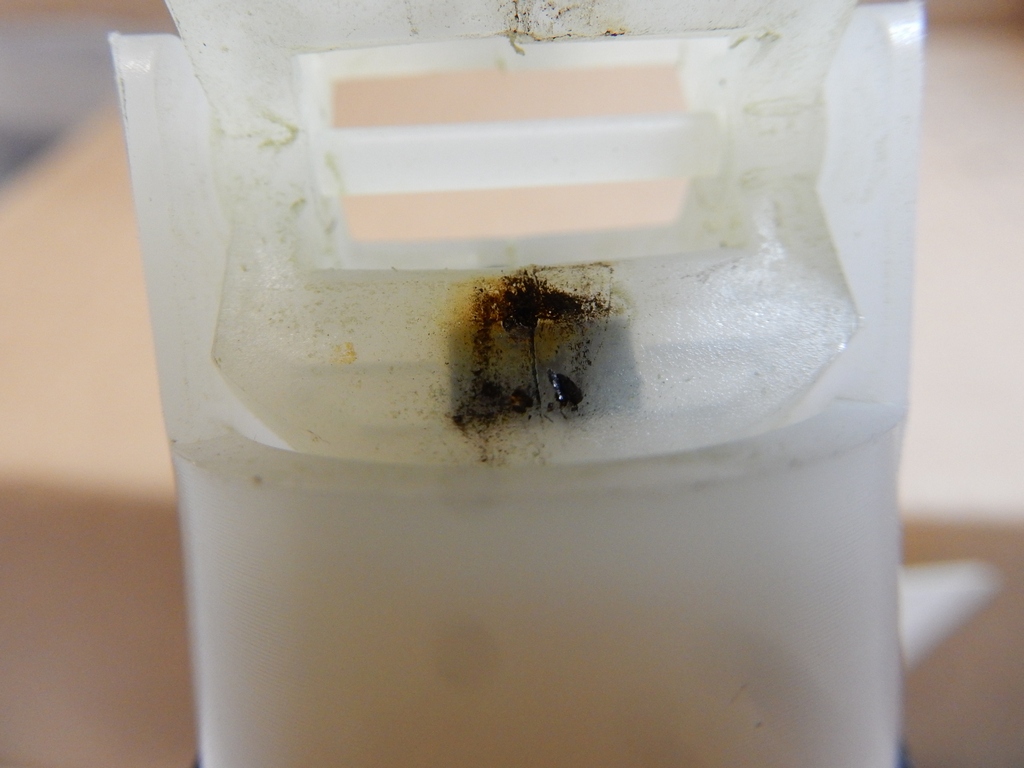
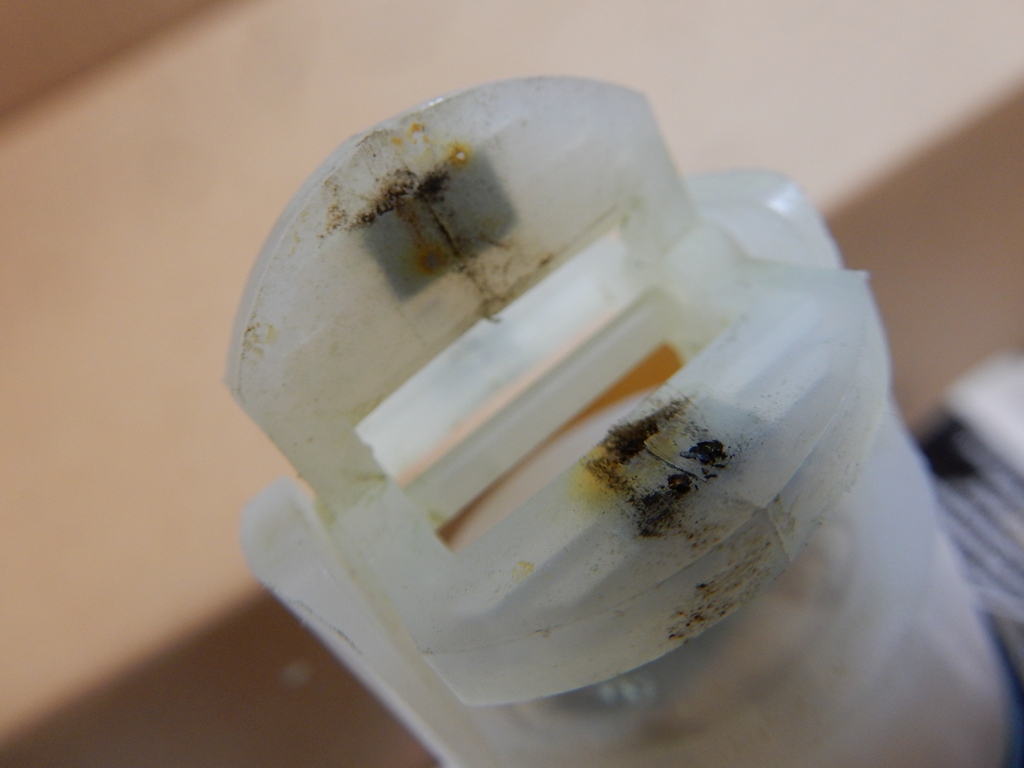
Note - with the sensor removed, we could see alot of green merk in the blue piping where the paddle wheel sits. Still suffering green sludge in this system...


Attaching detchar tag.