[Rich,[Rich, Evan, Terra, Carl]
[Rich, Evan, Terra, Carl]
We measured the transfer function from the ETMX PI DAC LL channel to the LVLN outputs of
D1500129.
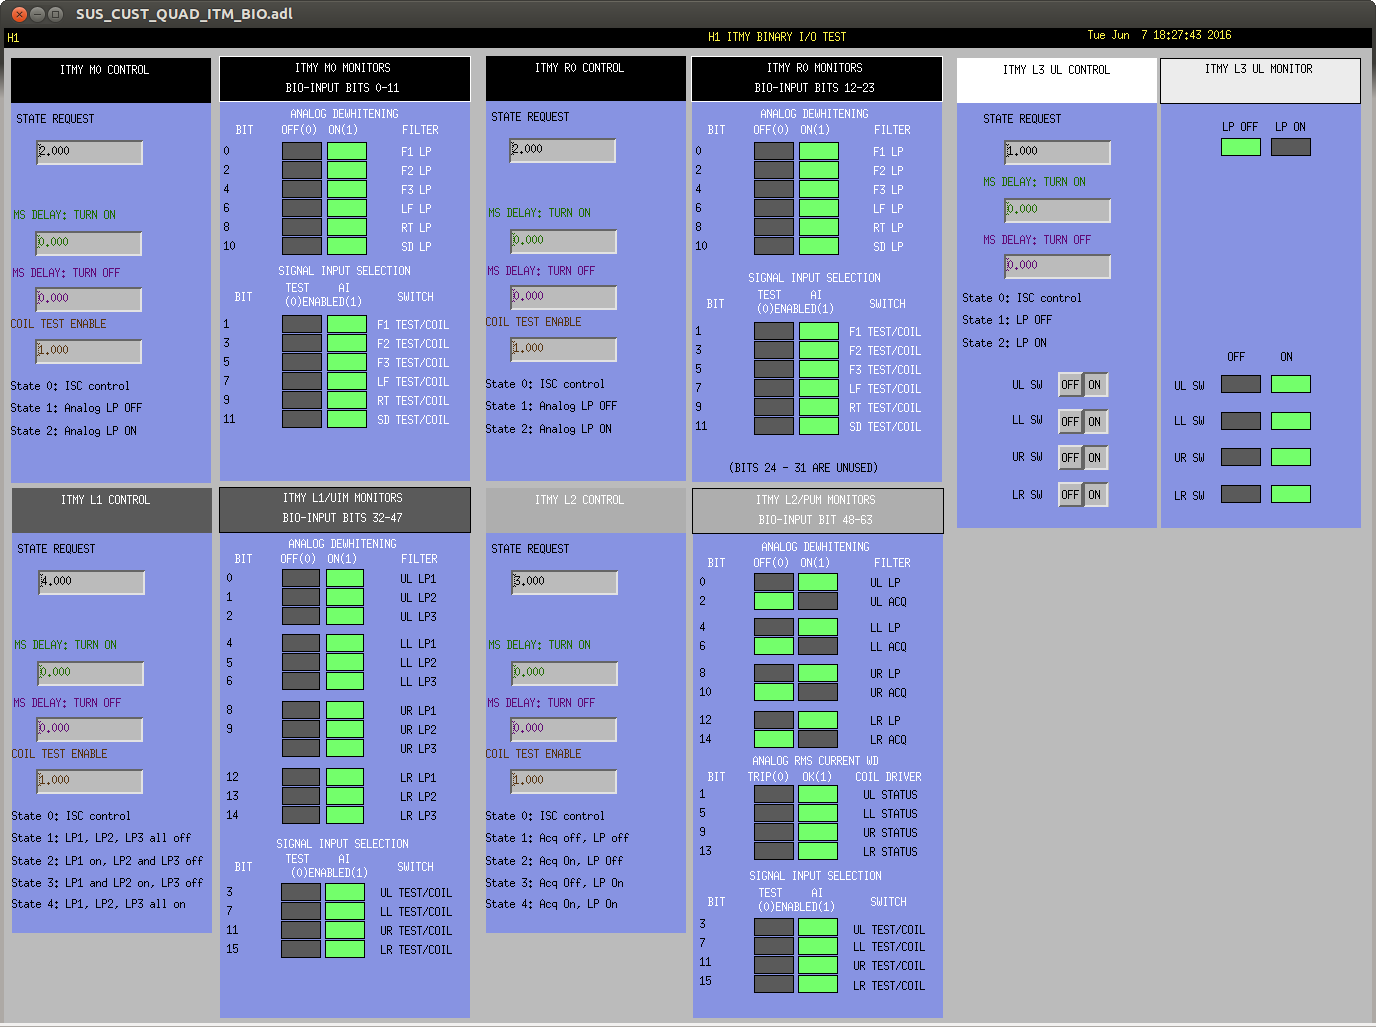
The injection was made at the damping filter H1:SUS-ETMX_PI_OMC_DAMP_MODE4_DAMP_EXC. With H1:SUS-ETMX_PI_OMC_DAMP_OUT_MTRX_1_4 = 1. H1:SUS-ETMX_PI_ESD_DRIVER_PI_DAMP_SWITCH = ON. H1:SUS-ETMX_BIO_L3_UL_STATEREQ = 1. H1:SUS-ETMX_BIO_L3_PI_ULLL_SW = ON. H1:SUS-ETMX_BIO_L3_LL_VOLTAGE_SW = OFF
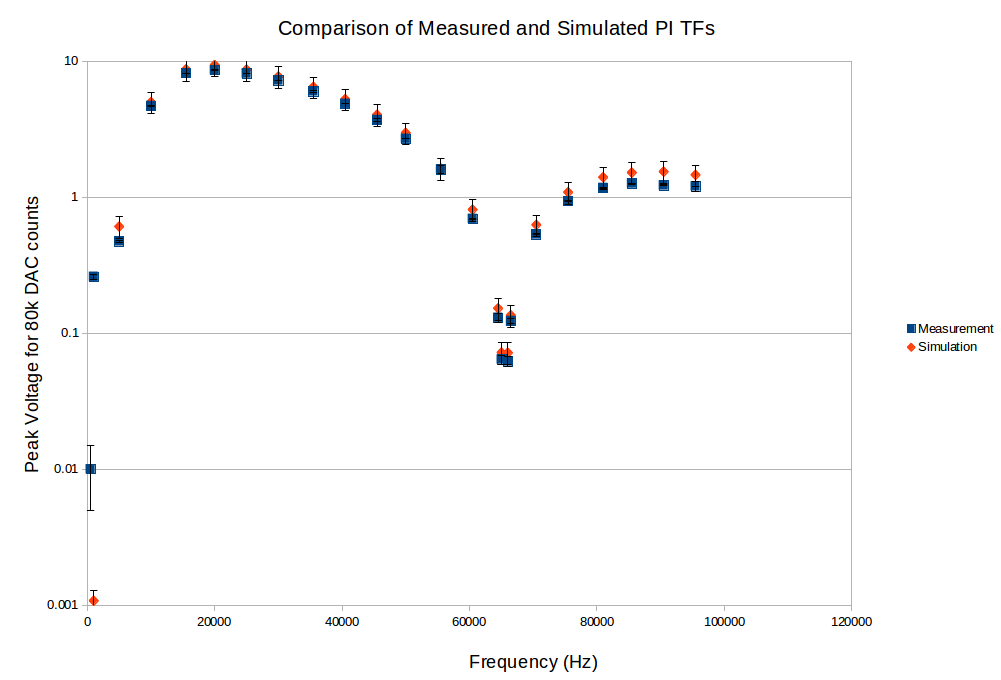
We used imaging to drive from 500Hz to 95kHz. For example driving at 1kHz we read out a 1kHz, 64.5kHz and 66.5kHz signals. In the first figure the transfer function is compared to a simulated transfer function derived from components:
>Gain of 80,000/2^17 as we used 80k counts
>sin(pi*f/fs)/(pi*f/fs) for the response of the DAC
>PI Bandpass filter transfer function from LIGO-S1500135-v1
>LVLN ESD amplifier transfer function from LIGO-D1500129-v1 (rough estimate from TF plot -> main error term)
The simulation is in agreement with the measurement other than at low frequency, Not sure what happened there. We will make more measurements with an uncertainty estimate from the measured SNR.
Friday we found a 20mv peak 1.26MHz noise (a clean sinusoid) on the ETMX LL channel, was not present on other channels. Going back to investigate with Rich made this noise go away.
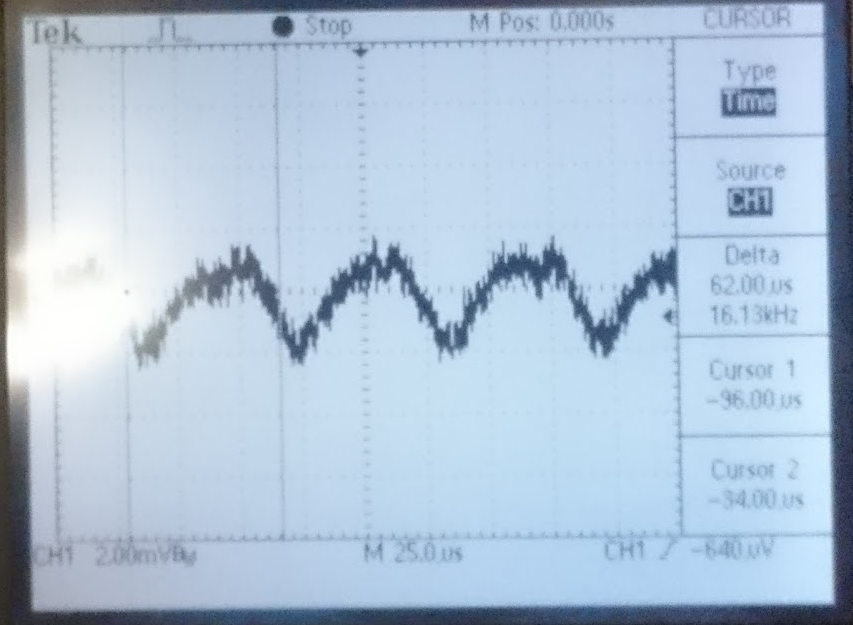
When the "ESD drive from DAC" input (J1B) is connected without the lowpass filter selected (PZ3 and PZ4) in the binary I/O there is ~2mV peak noise around 16kHz see second figure.
When the DAC input is connected without the lowpass filter selected in the binary I/O there is ~2mV peak noise around 16kHz. [Rich, Evan, Terra, Carl]
We measured the transfer function from the ETMX PI DAC channels to the LVLN outputs of D1500129
We used imaging to drive from 500Hz to 95kHz. In the figure transfer function is compared to a simulated transfer function that has components:
Gain of 80,000/2^17 as we used 80k counts
sin(pi*f/fs)/(pi*f/fs) for the response of the DAC
PI Bandpass filter transfer function from LIGO-S1500135-v1
LVLN ESD amplifier transfer function from LIGO-D1500129-v1 (rough estimate from TF plot -> main error term)
The simulation is in reasonable agreement with the measurement.
We found at one point a 20uv peak 1.6MHz noise (a clean sinusoid) on the ETMX LL channel. Going back to investigate with Rich made this noise go away.
When the DAC input is connected without the lowpass filter selected in the binary I/O there is ~2uV peak noise around 16kHz.Evan, Terra, Carl]
We measured the transfer function from the ETMX PI DAC channels to the LVLN outputs of D1500129
We used imaging to drive from 500Hz to 95kHz. In the figure transfer function is compared to a simulated transfer function that has components:
Gain of 80,000/2^17 as we used 80k counts
sin(pi*f/fs)/(pi*f/fs) for the response of the DAC
PI Bandpass filter transfer function from LIGO-S1500135-v1
LVLN ESD amplifier transfer function from LIGO-D1500129-v1 (rough estimate from TF plot -> main error term)
The simulation is in reasonable agreement with the measurement.
We found at one point a 20uv peak 1.6MHz noise (a clean sinusoid) on the ETMX LL channel. Going back to investigate with Rich made this noise go away.
When the DAC input is connected without the lowpass filter selected in the binary I/O there is ~2uV peak noise around 16kHz.

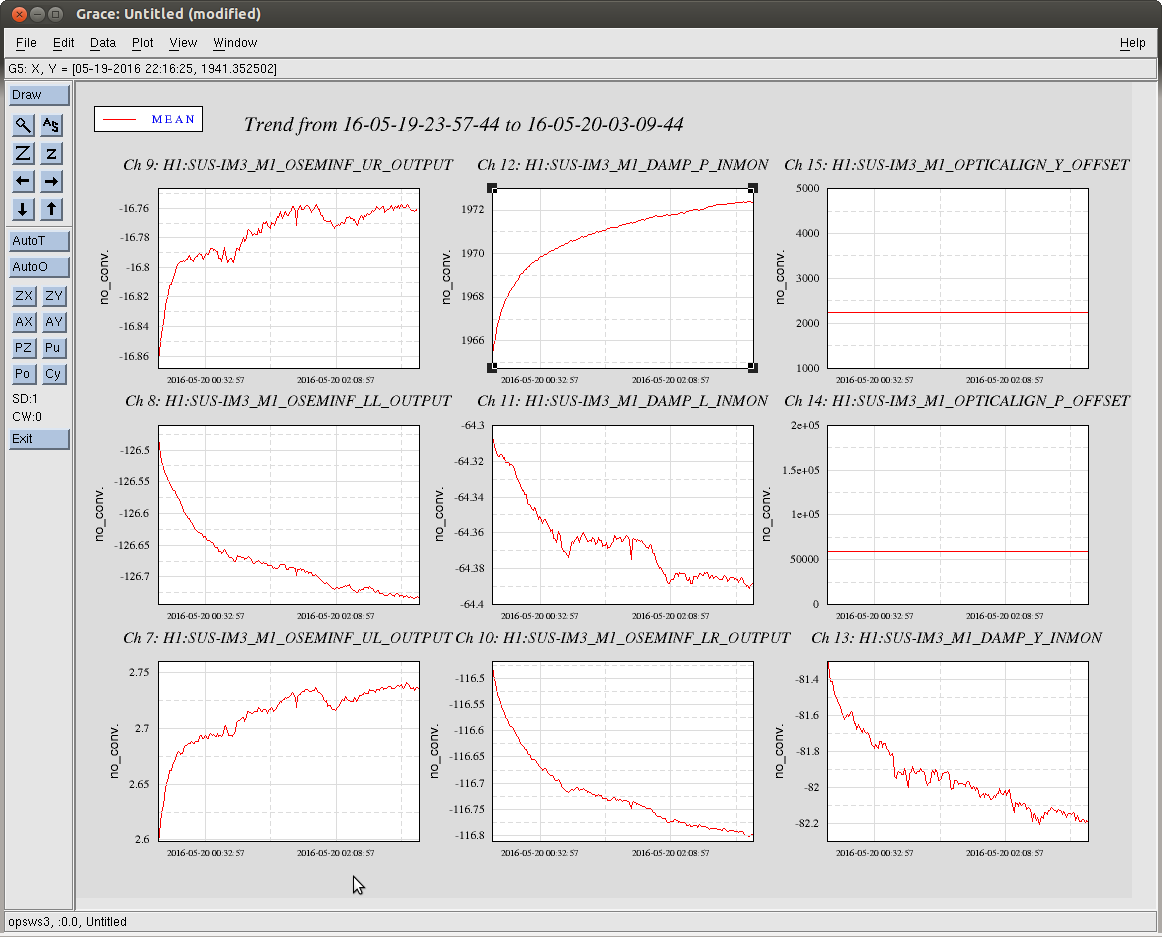


Durring the long lock tonight, I roughly adjusted the green QPD offsets using the green wfs while the arms were controlled by IR ASC. I frogot to update the green camera position after doing this though, Evan is using trends to update them now.