HWInjReport 1129593617 - 1131828544
Performed a run spanning the time period from 1129593617 (Oct 23 2015 00:00:00 UTC) to 1131828544 (Nov 17 2015 20:48:47 UTC)
Parameters
The following parameters were used for this run:
-
GPS Start Time = 1129593617 # Beginning of time span, in GPS seconds, to search for injections
-
GPS End Time = 1131828544 # Ending of time span, in GPS seconds, to search for injections
-
Check Hanford IFO = True # Check for injections in the Hanford IFO frame files.
-
Check Livingston IFO = True # Check for injections in the Livingston IFO frame files.
-
IFO Coinc Time = 0.012 # Time window, in seconds, for coincidence between IFO injection events.
-
Check ODC_HOFT = True # Check ODC-MASTER_CHANNEL_OUT_DQ channel in HOFT frames.
-
Check ODC_RAW = True # Check ODC-MASTER_CHANNEL_OUT_DQ channel in RAW frames.
-
Check ODC_RDS = True # Check ODC-MASTER_CHANNEL_OUT_DQ channel in RDS frames.
-
Check GDS_HOFT = True # Check GDS-CALIB_STATE_VECTOR channel in HOFT frames.
-
Check CAL_RAW = True # Check CAL-INJ_ODC_CHANNEL_OUT_DQ channel in RAW frames.
-
Report Normal = True # Include normal (IFO-coincident (network injections only), consistent, scheduled, and of known type) injections in report
-
Report Anomalous = True # Include anomalous (non-IFO-coincident (network injections only), inconsistent, unscheduled, or of unknown type) injections in report
-
Use CONDOR optimizations = True # Enable optimizations that assume execution on a CONDOR machine
Scheduled Injections
Only two injections were found to be scheduled during this period:
-
CBC 1131397639.000 (coherentbbh0_1126259455_)
-
CBC 1131405159.000 (coherentbbh0_1126259455_)
However, neither of these injections were found to actually occur within the examined time period.
Network and IFO Injections
There were no normal injections that occurred within the examined period. There were a number CAL-INJ resets, all single-IFO with the same curious pattern to the frame flags as denoted in the immediately prior HWInj report (https://alog.ligo-wa.caltech.edu/aLOG/index.php?callRep=23485). There was a single-IFO burst injection in H1
BURST 1129673117.000 (H1)
with the only anomaly being that it is UNSCHEDULED. There was a single UNKNOWN injection in L1
UNKNOWN 1129673117.000 (L1)
This injection was confirmed to occur only within the CAL-INJ channel of RAW frames with the TRANSIENT bit indicating an injection but none of the specific injection-type bits, CBC, BURST, DETCHAR, or STOCHASTIC, indicating an injection. It was confirmed to not occur in ODC HOFT, ODC RDS, ODC RAW, or GDS HOFT frames.
Discussion of Anomalies
It is interesting that the single-IFO injections BURST 1129673117.000 (H1) and UNKNOWN 1129673117.000 (L1) are found to occur at the exact same time but within different IFOs. Even further, the fact the BURST injection in H1 is perfectly normal, other than being UNSCHEDULED, while the UNKNOWN injection in L1, in addition to being UNSCHEDULED, is inconsistent. HWInjReport currently does not check the HW bit or the CW bit in the CAL-INJ channel for RAW frames for the presence of injections; however, upon examining these bits directly, it was found that while the HW bit indicated an injection, along with the TRANSIENT bit, the CW bit did not indicate an injection (my first thought was that this may be a CW injection only occurring in L1). This means this was a truly UNKNOWN, UNSCHEDULED injection occurring only with L1. Given both injections occur at the exact same time and the L1 injection is a truly UNKNOWN type (practically a ghost injection, by the bits), it is likely this was intended to be a normal network injection; however either user-error or a catastrophic software error corrupted the proper setting of the bits.


LLO called to let me know that they will be starting the Maintainence activity in an hour since they've recently recovered from a lockloss.
LLO's down for Maintennance
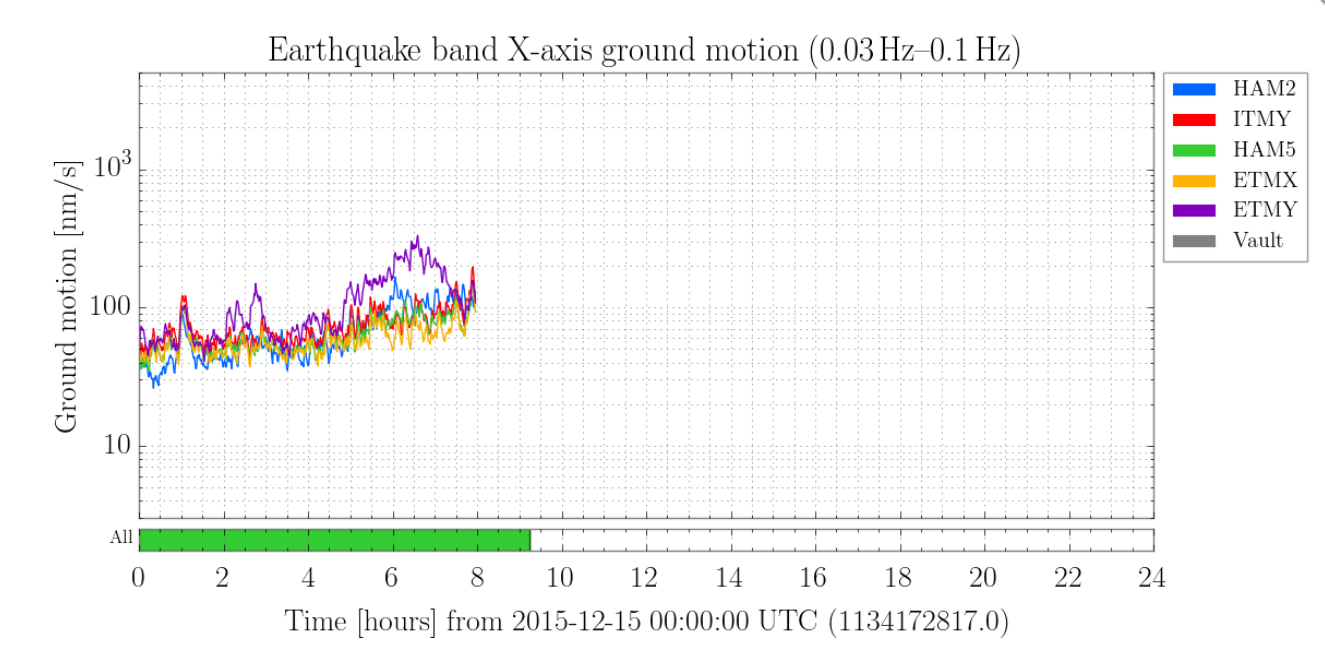
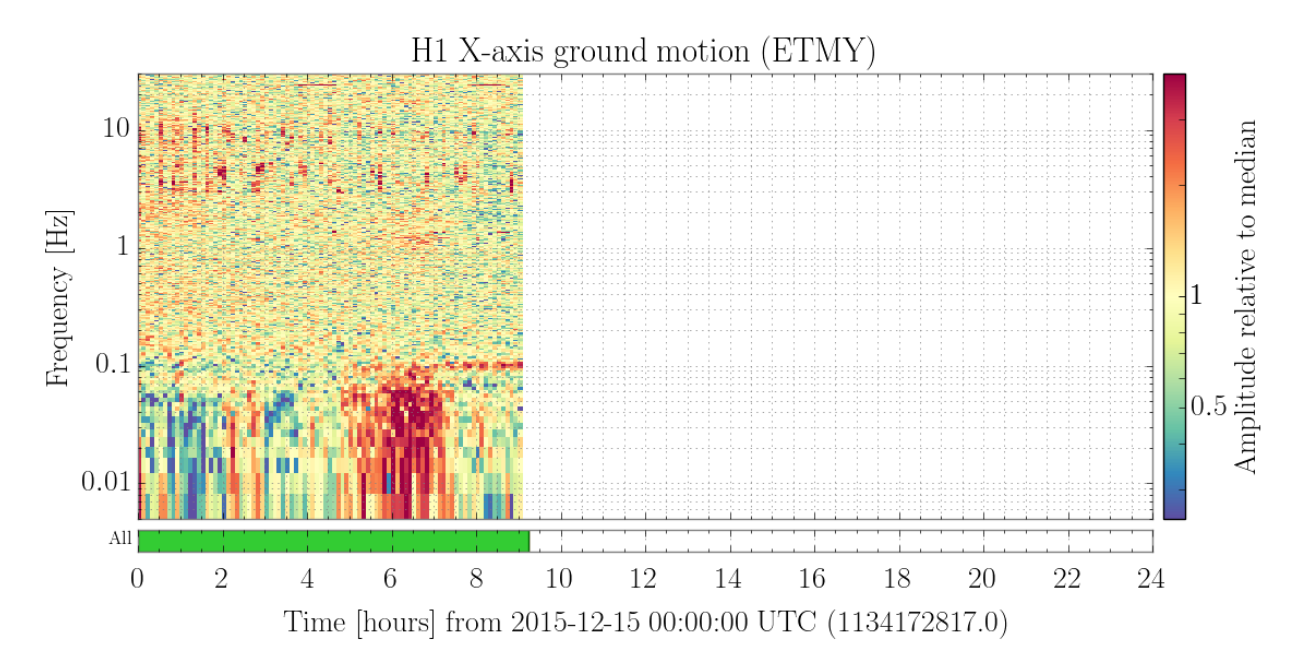
The cause of lockloss was a 5.2M earthquake in Vanuatu btw. Terramon updated that a little slow.