nutsinee.kijbunchoo@LIGO.ORG - posted 08:11, Sunday 16 August 2015 (20566)
Owl Shift Summary
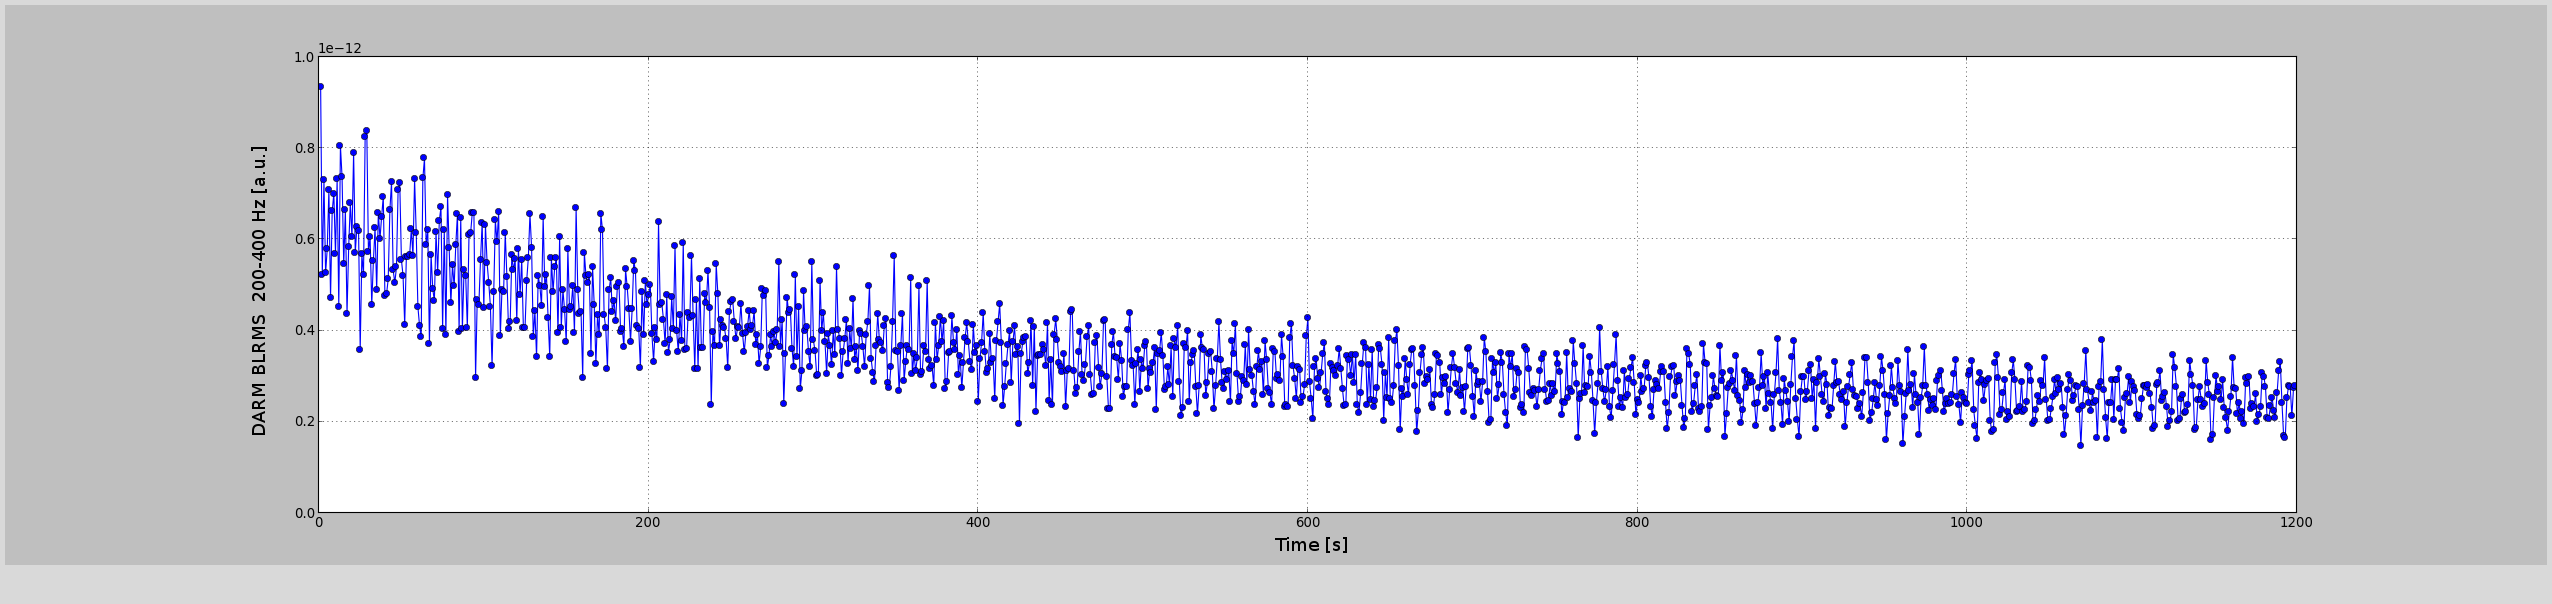
The interferometer has been locked for 10+ hours! With 6+ hours coincidence with L1. Things are looking good for O1 eh?
9:46UTC The 5.0M earthquake in Pacific-Antarctic Ridge shook the interferometer just a tiny bit. The range dropped slightly but slowly came back up.
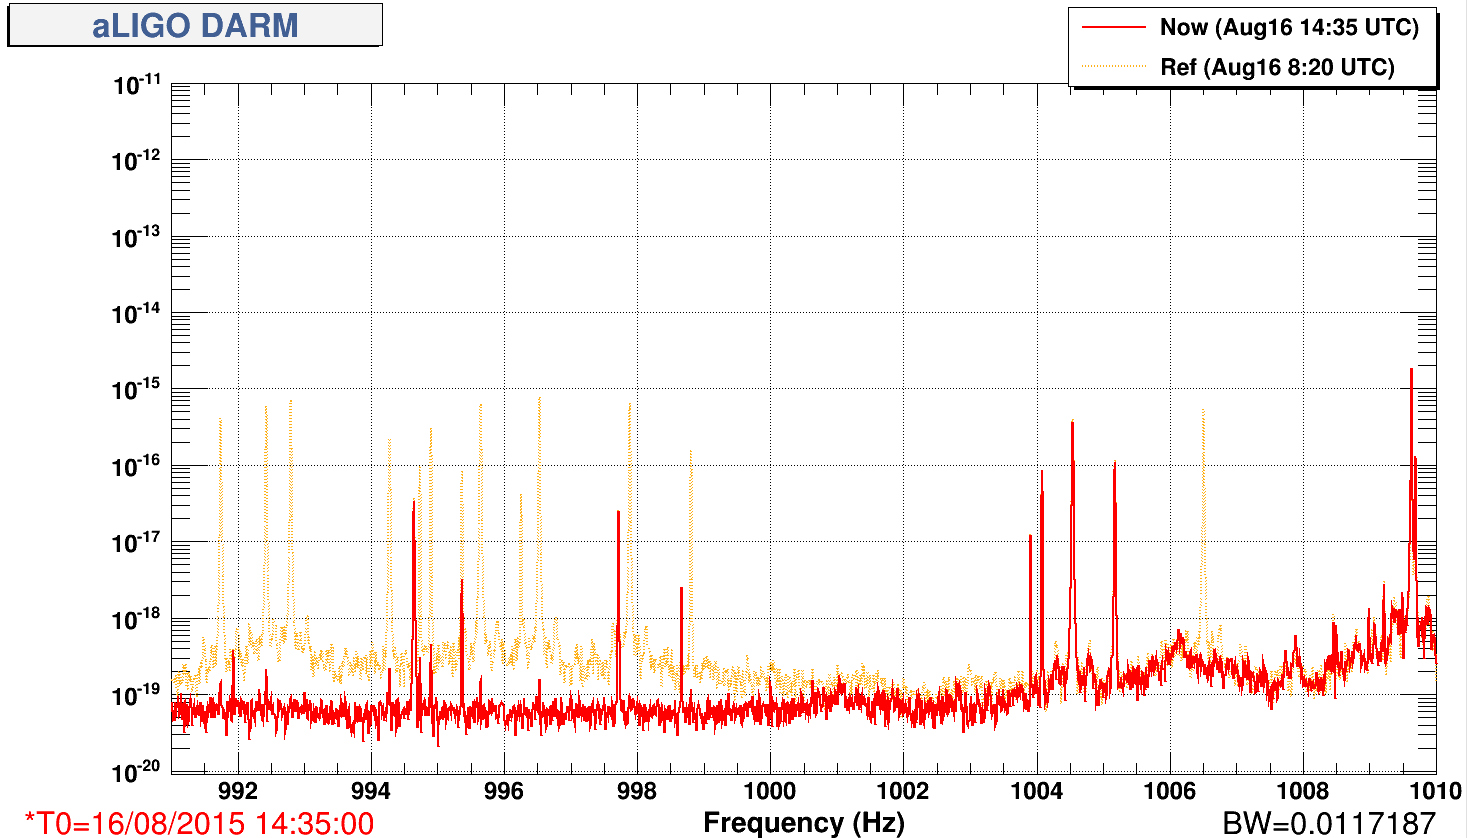
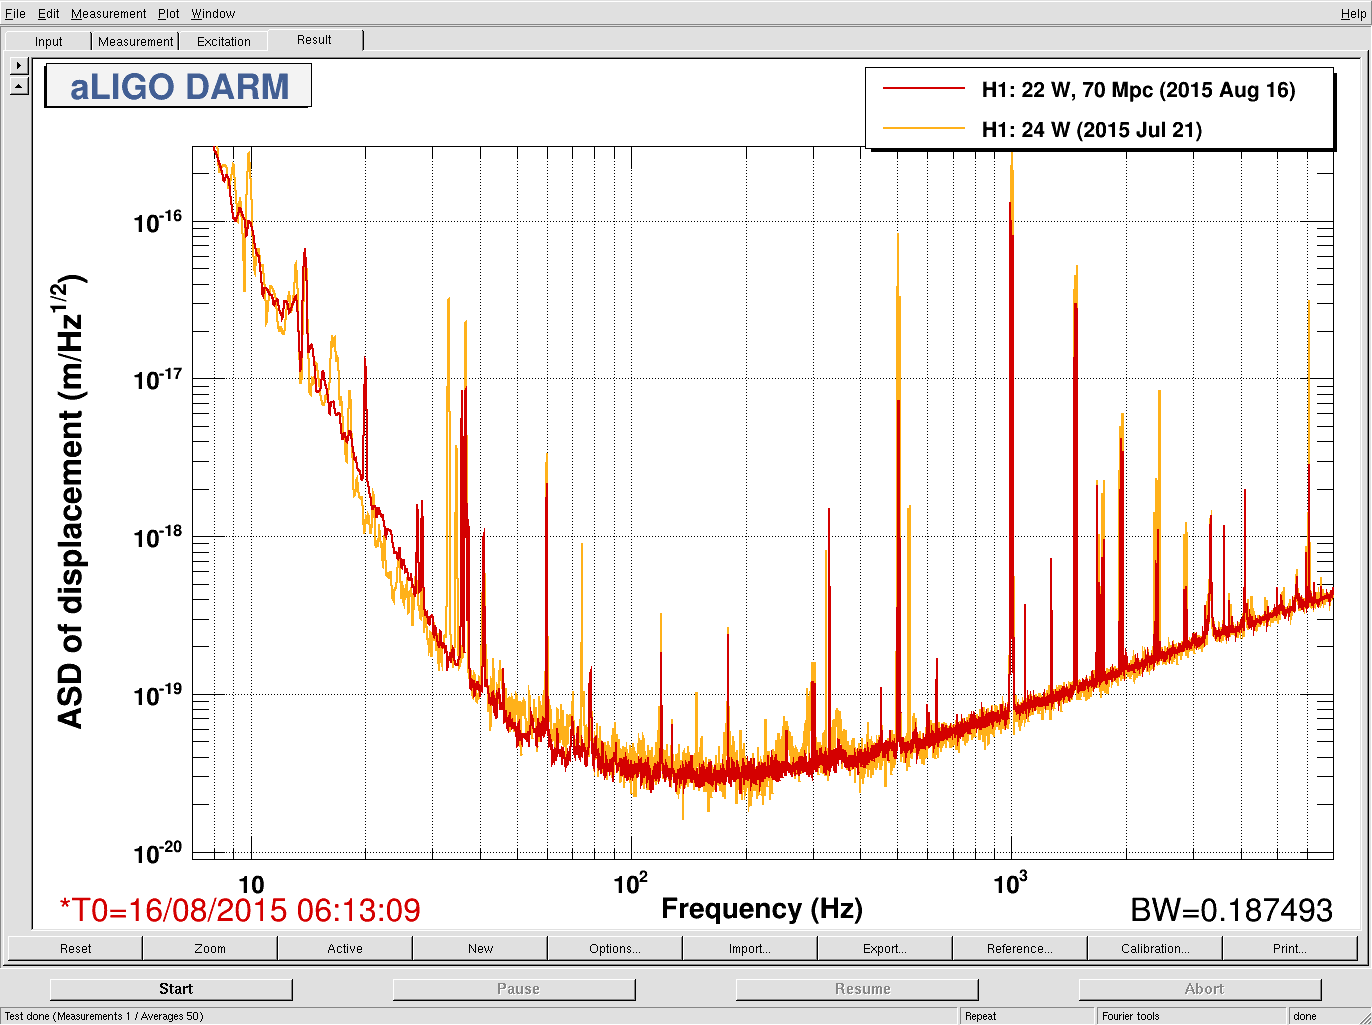
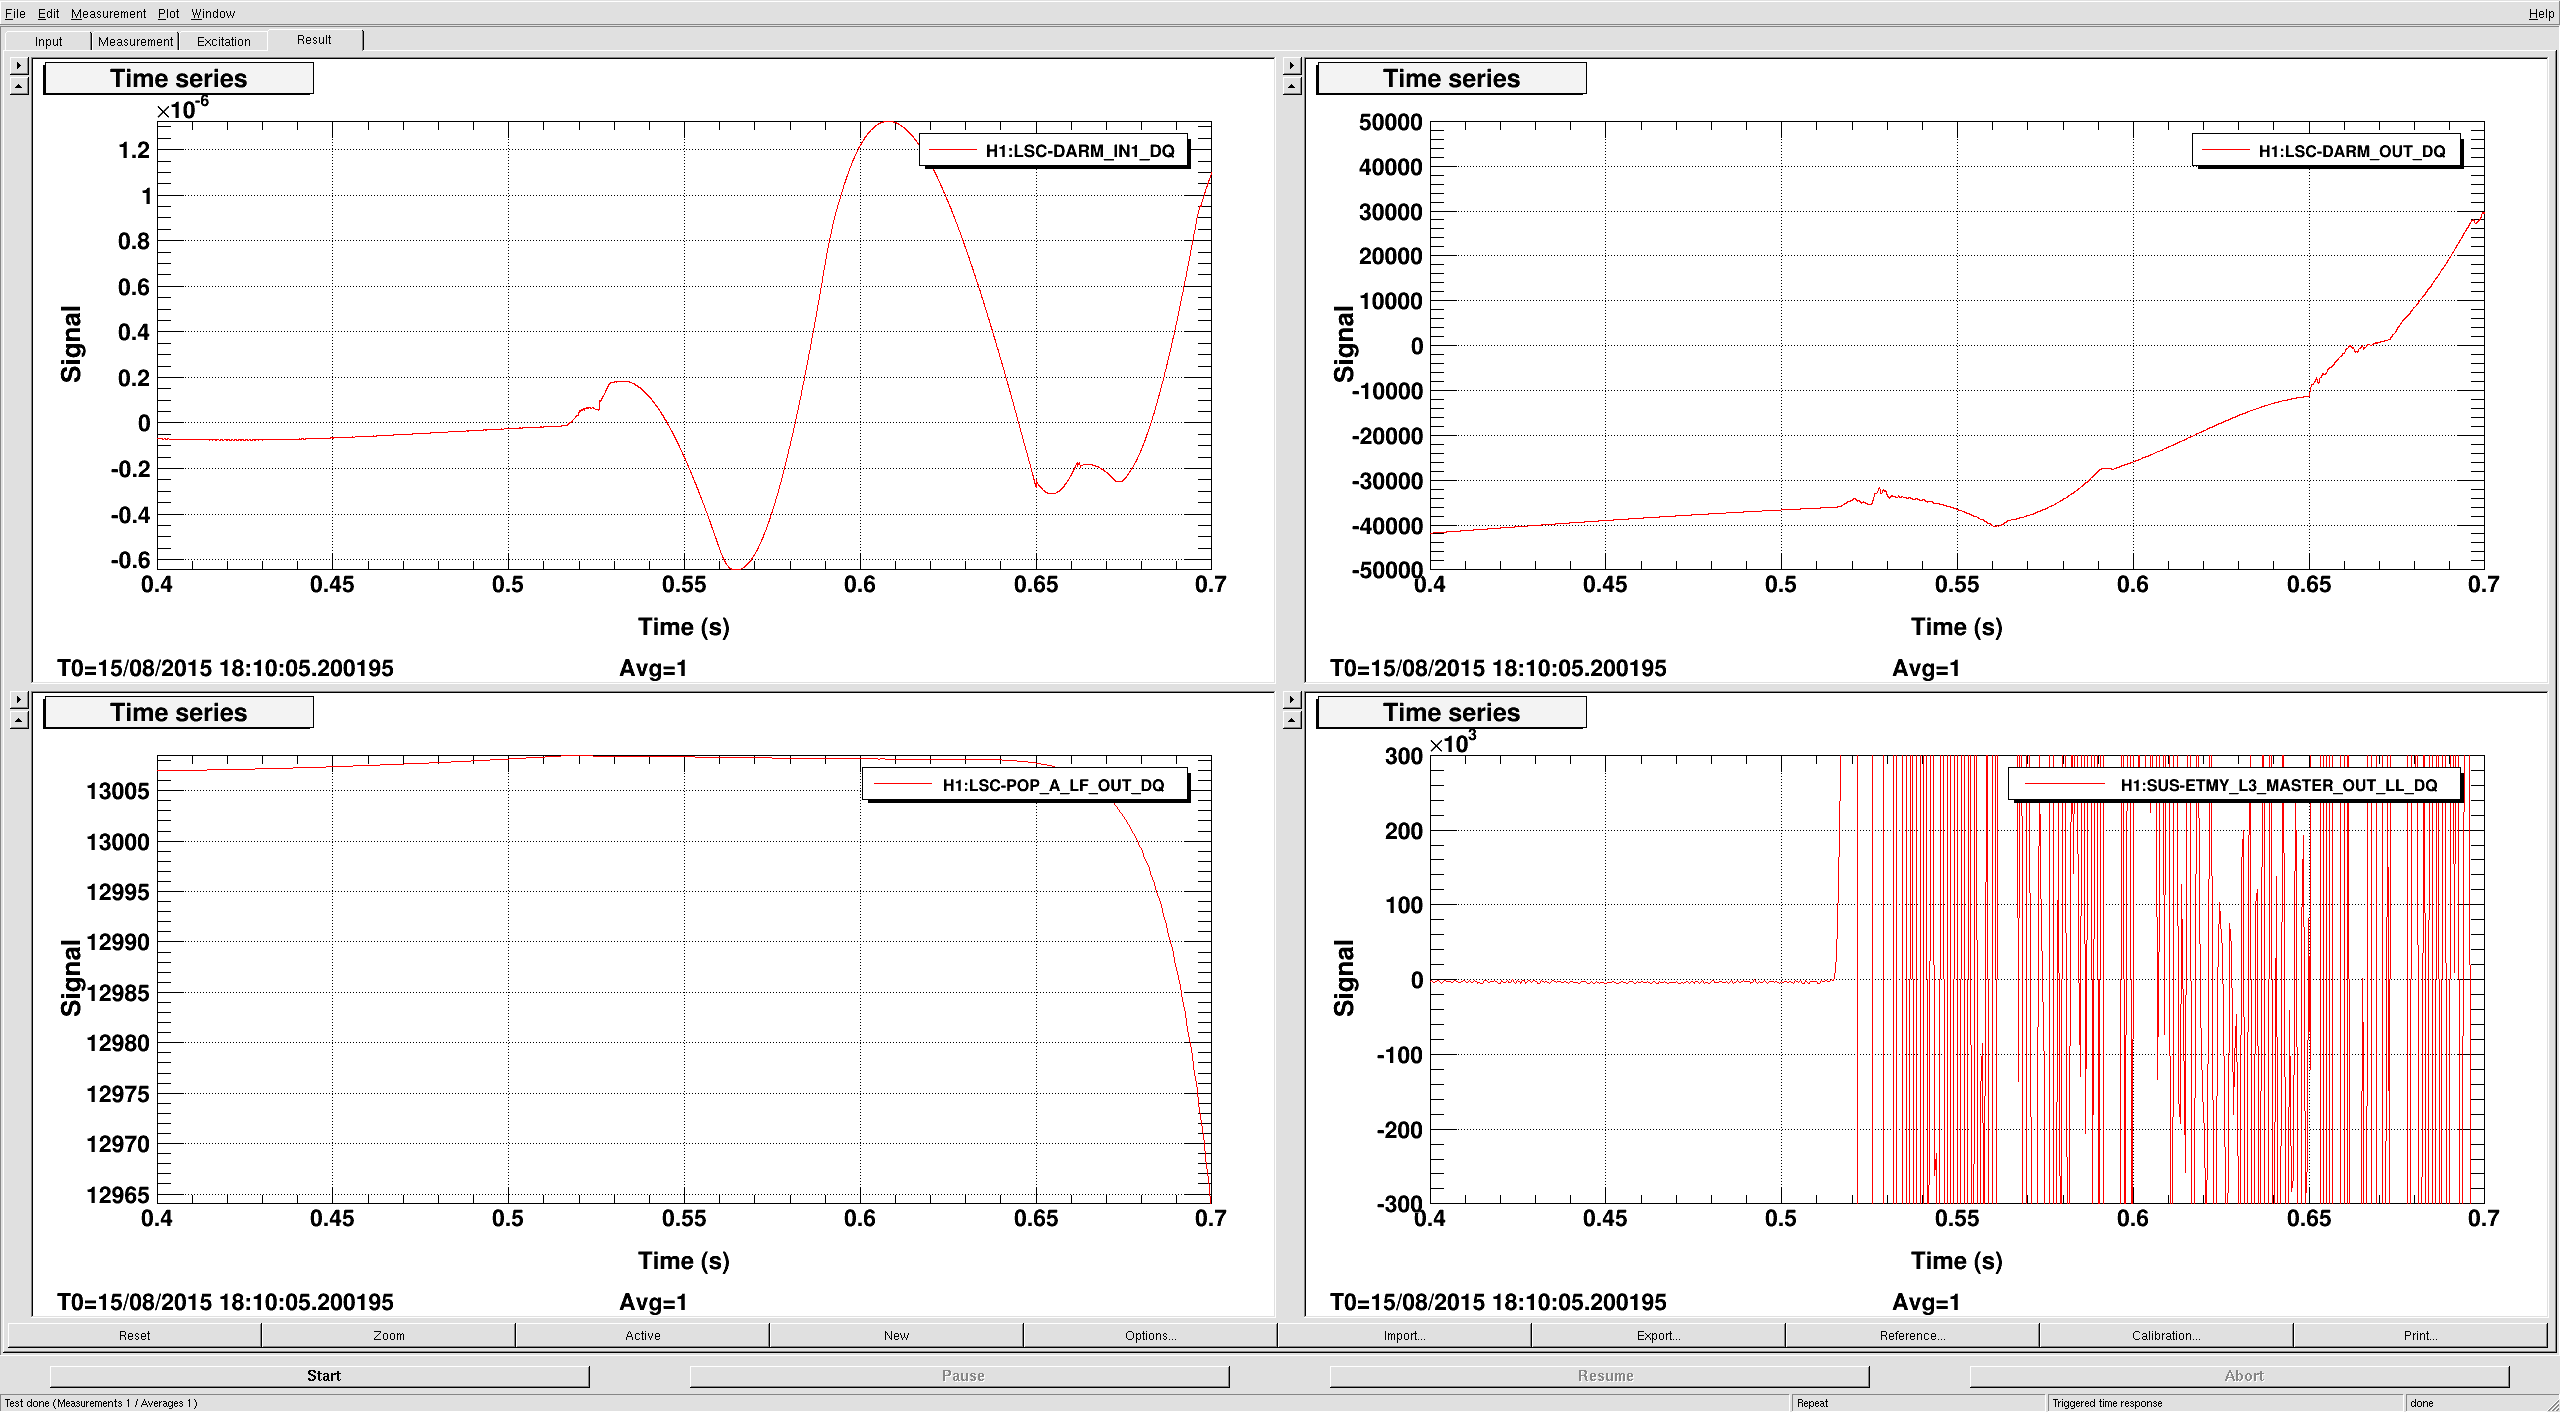
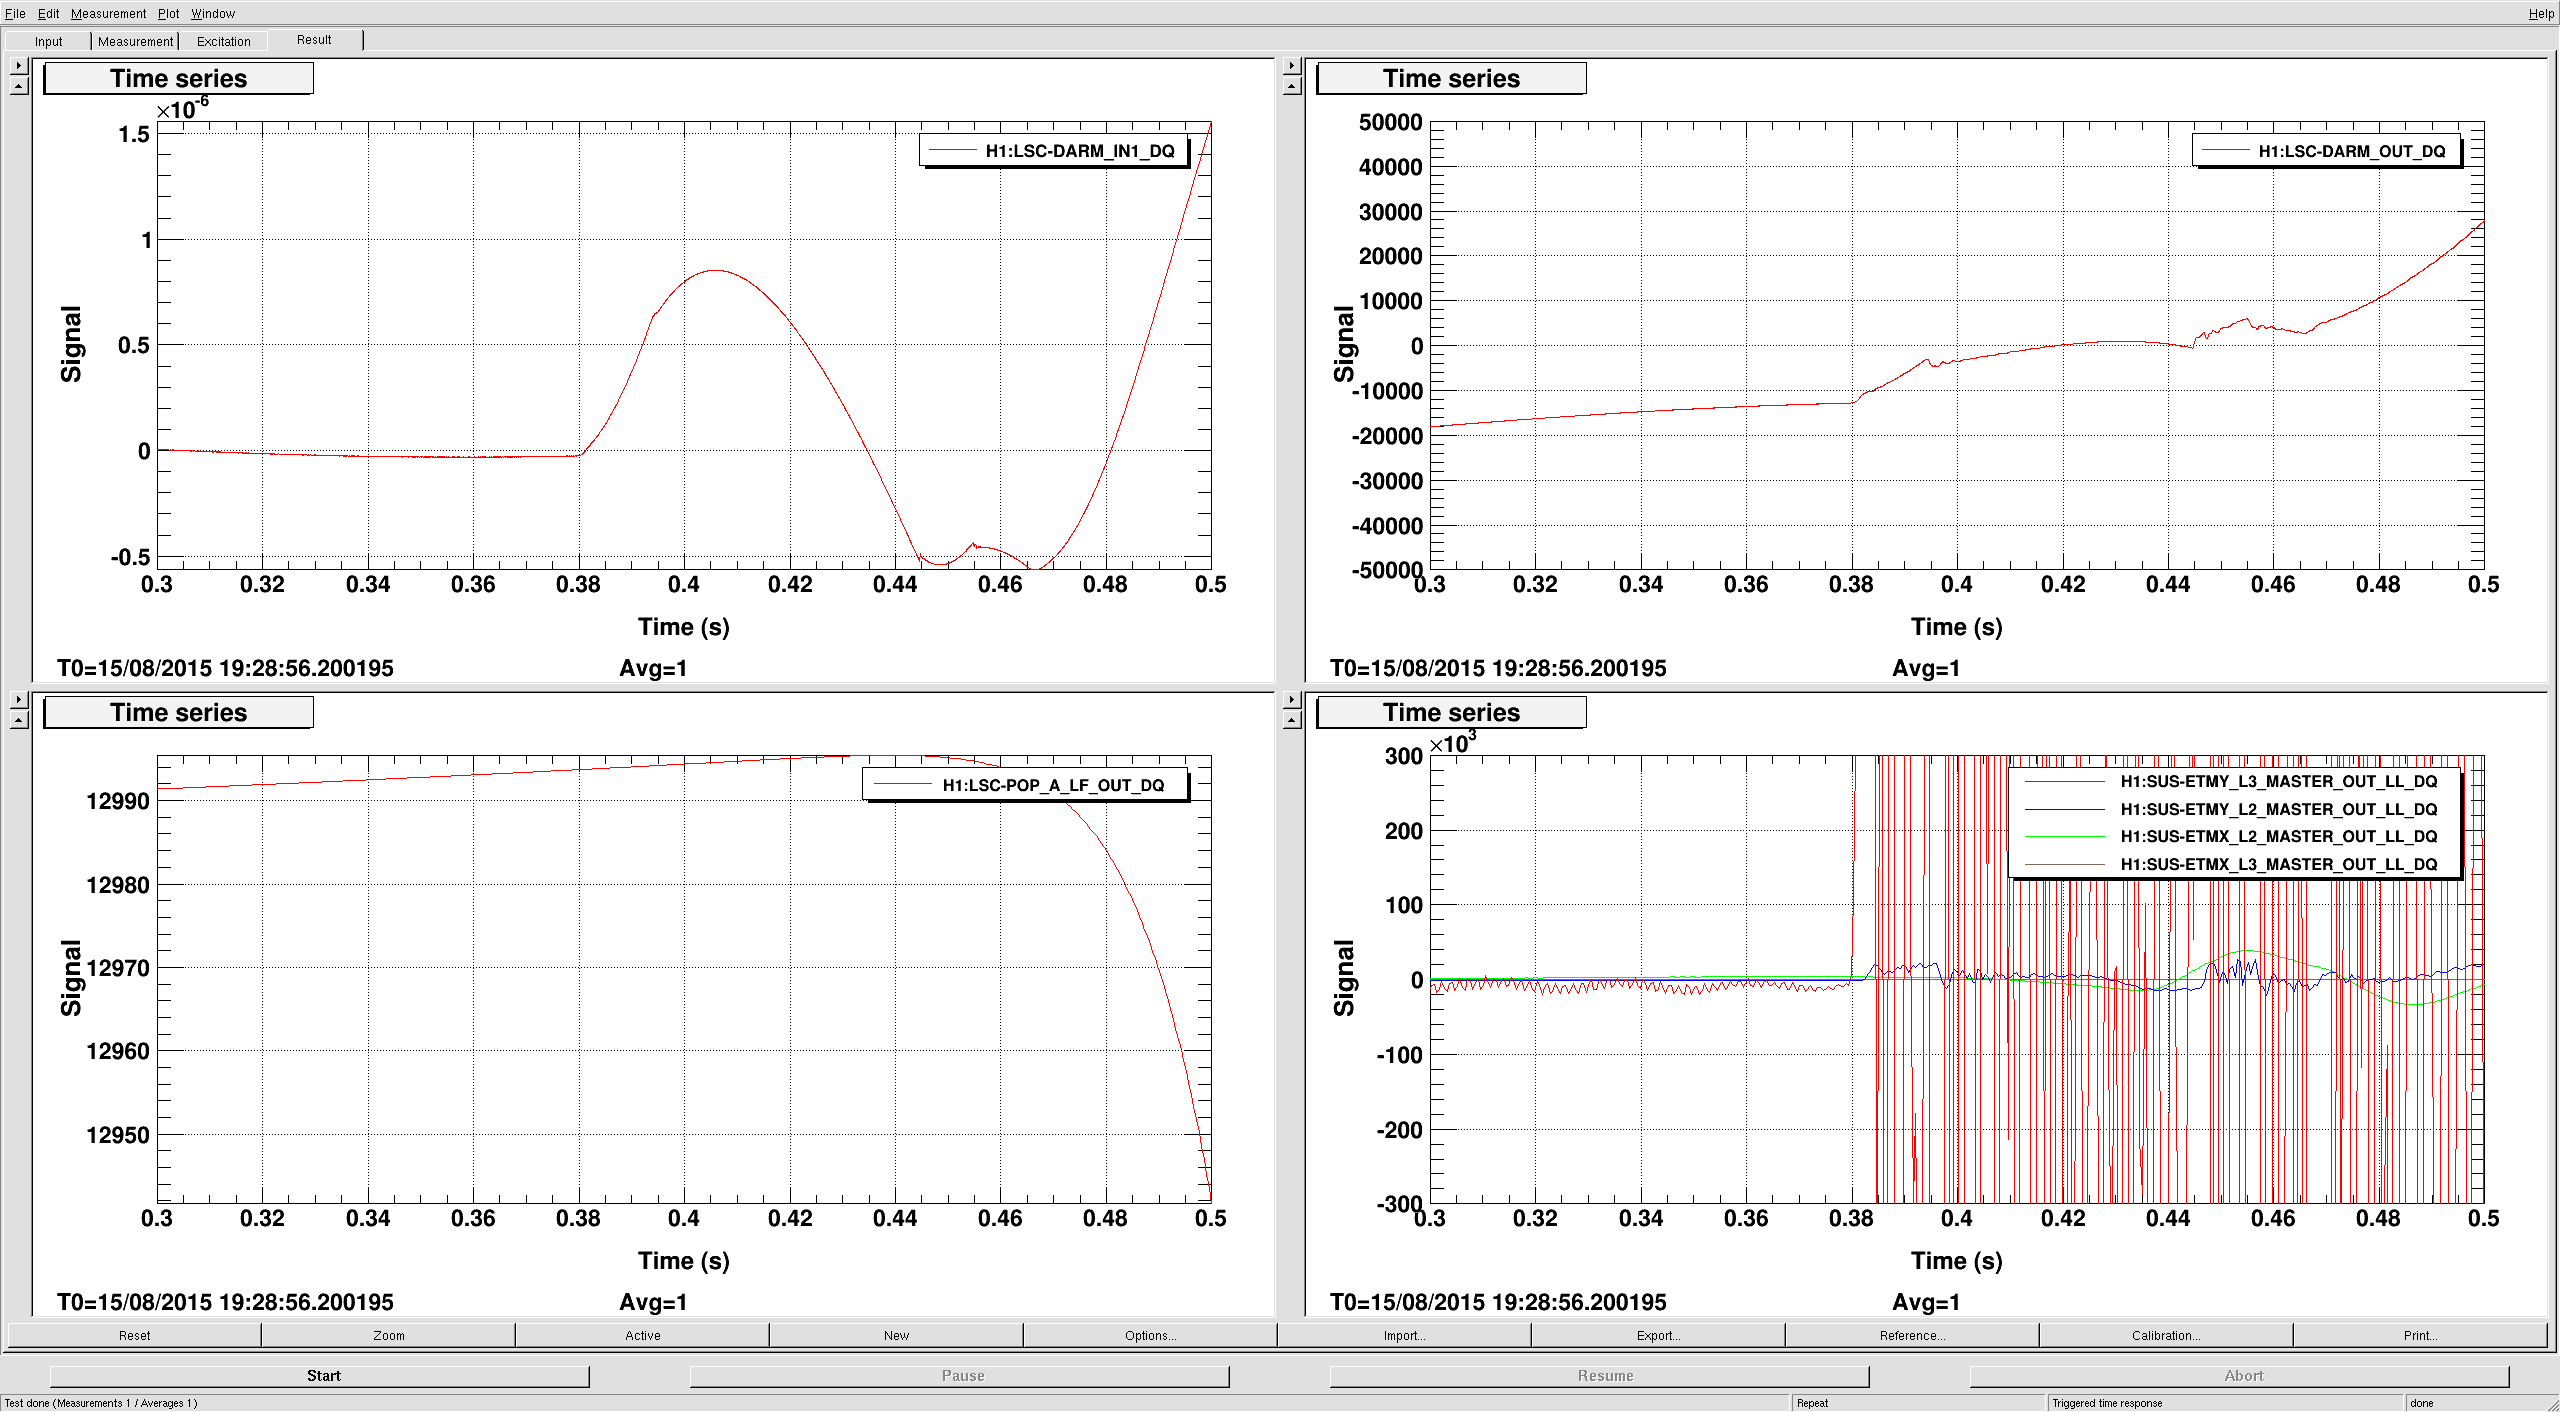
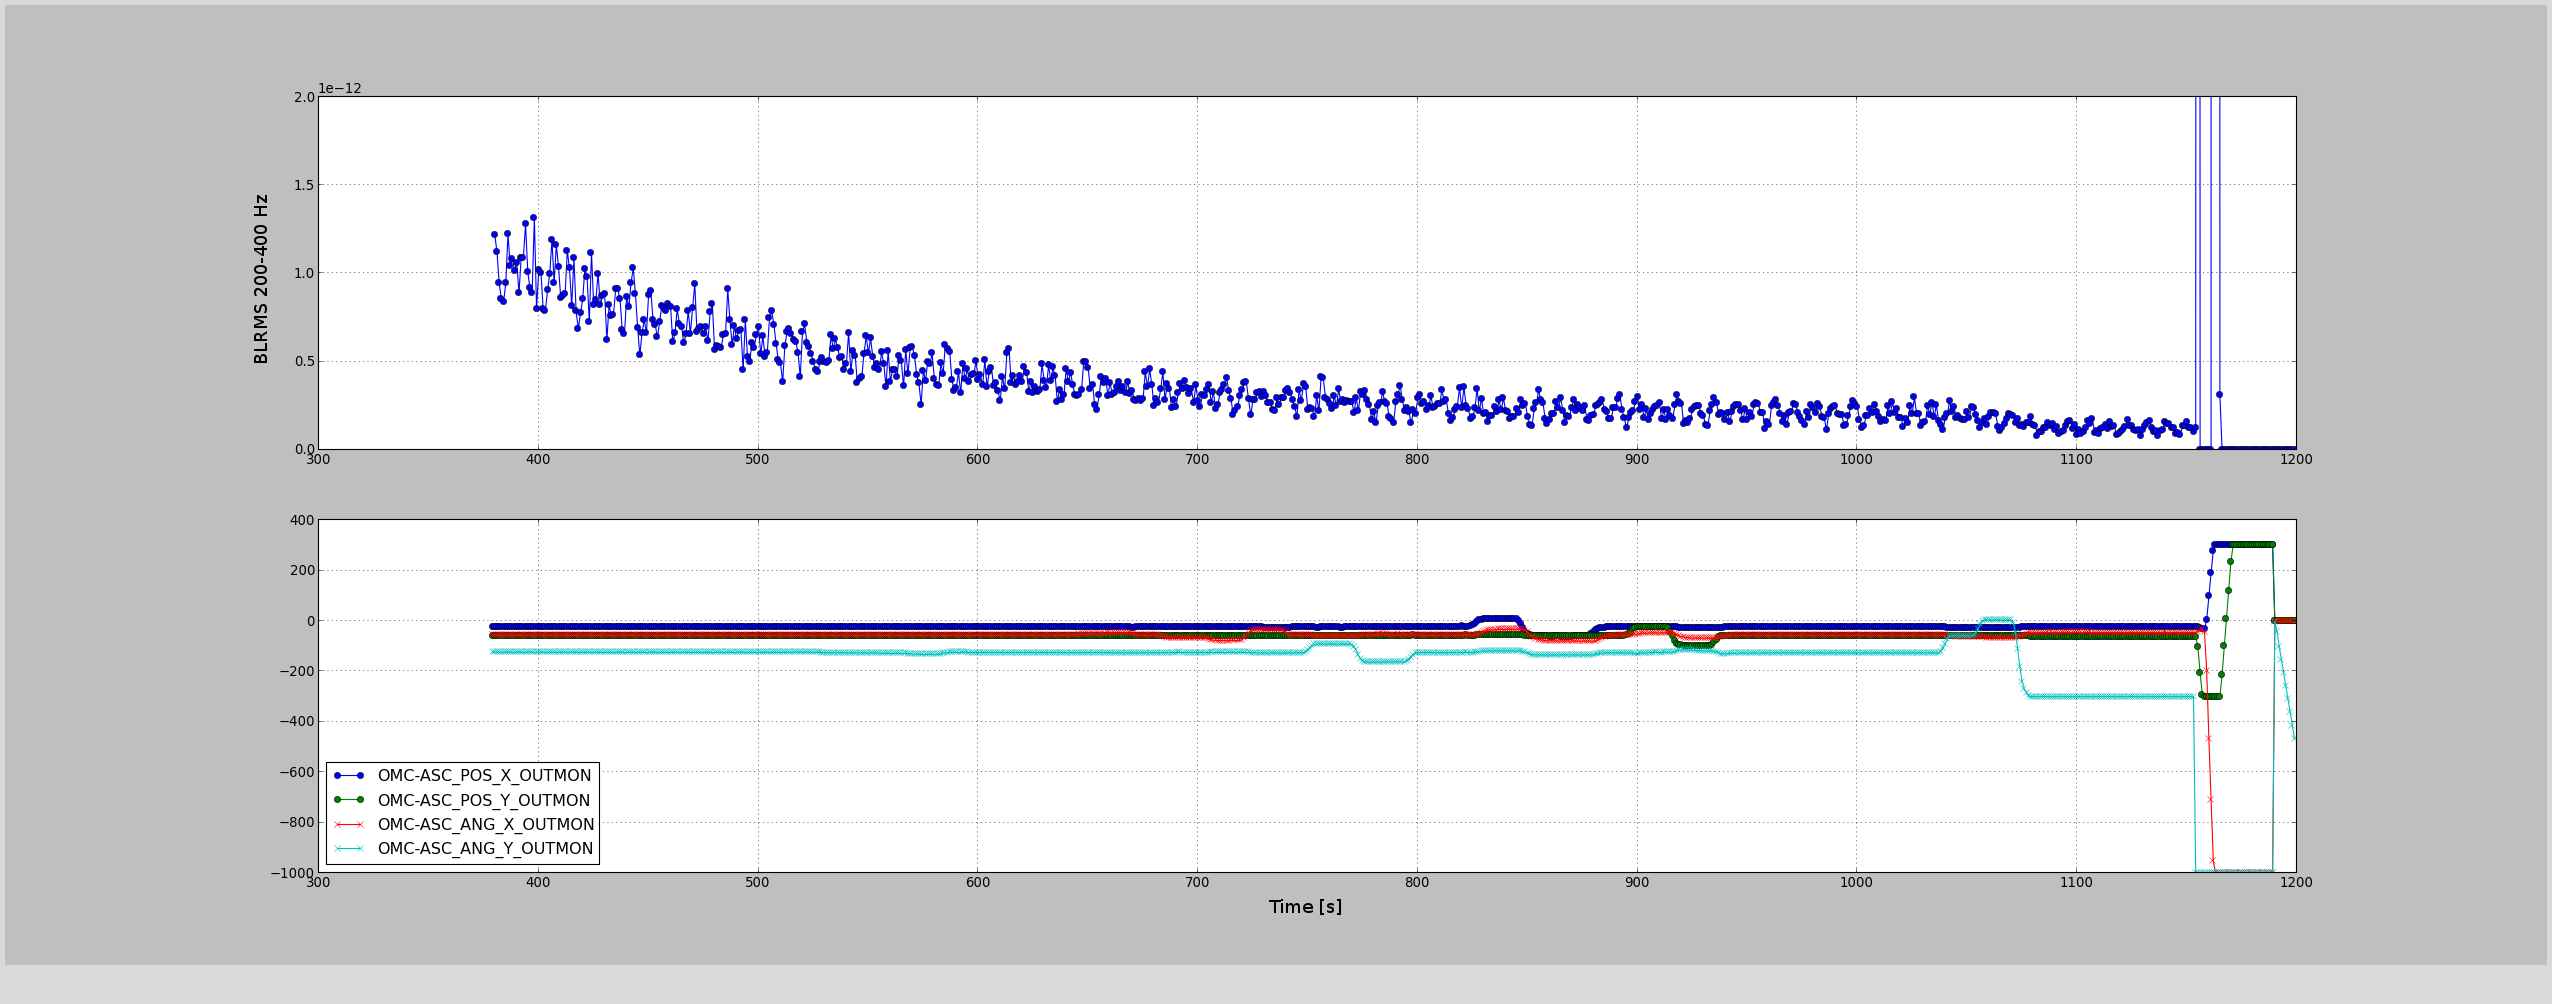
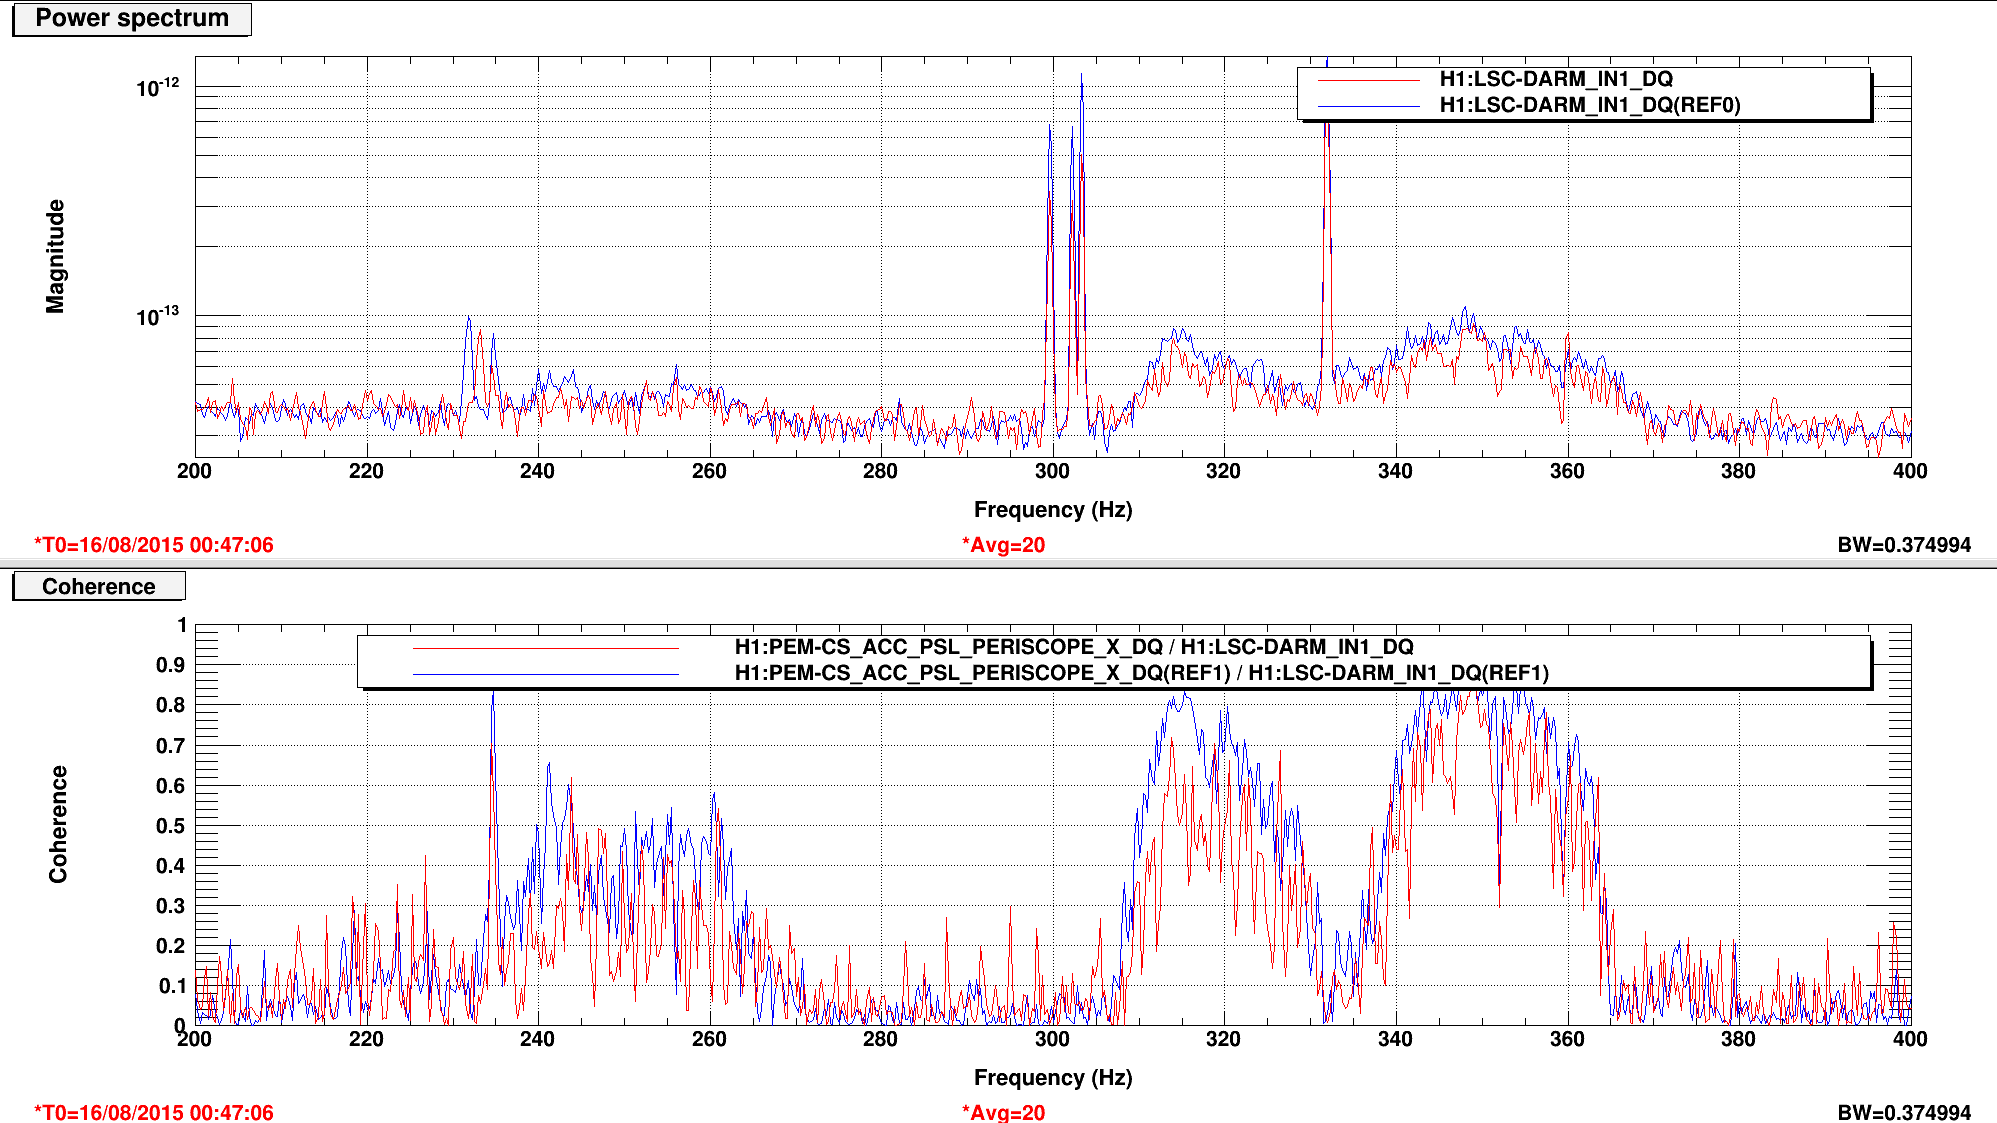
14:00 I'm starting to see glitches in DARM spectrum at low frequency. BNS range has been droping in the past hour and hasn't come back up.
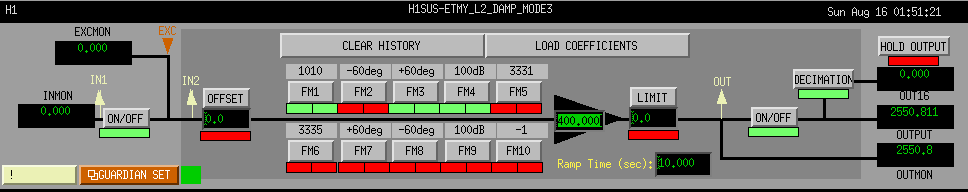
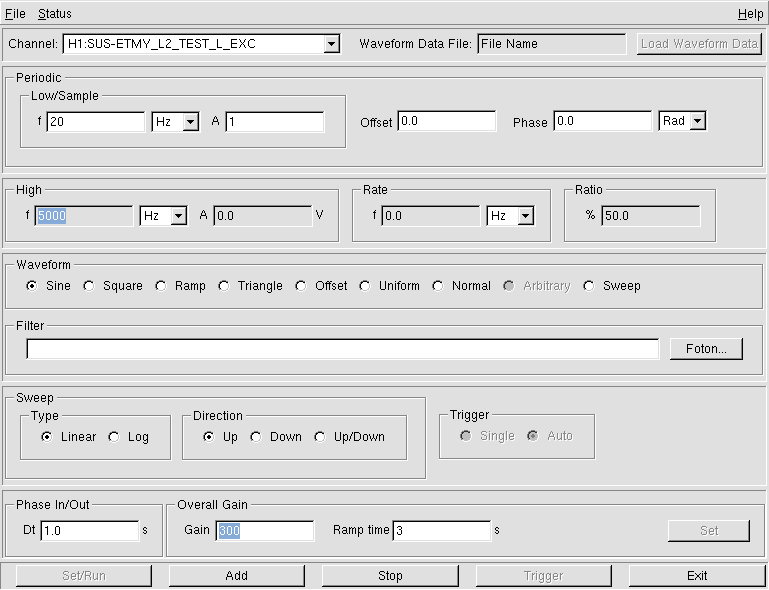
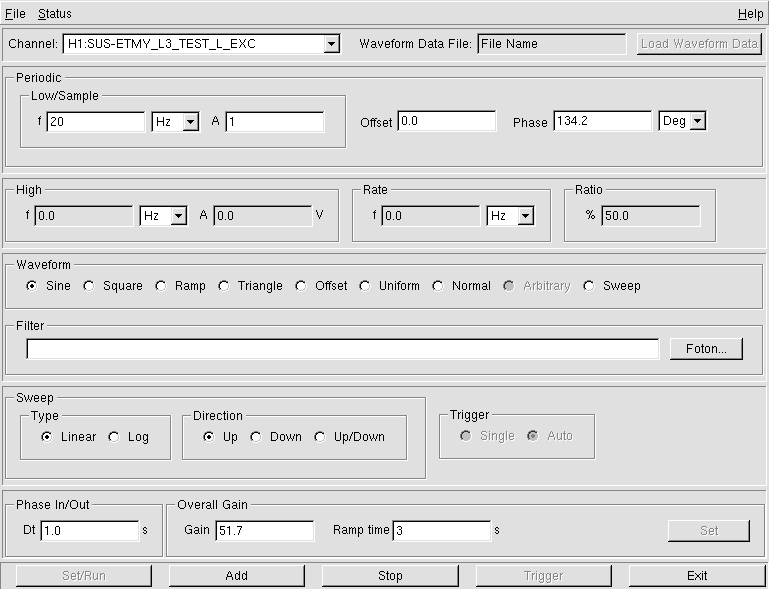
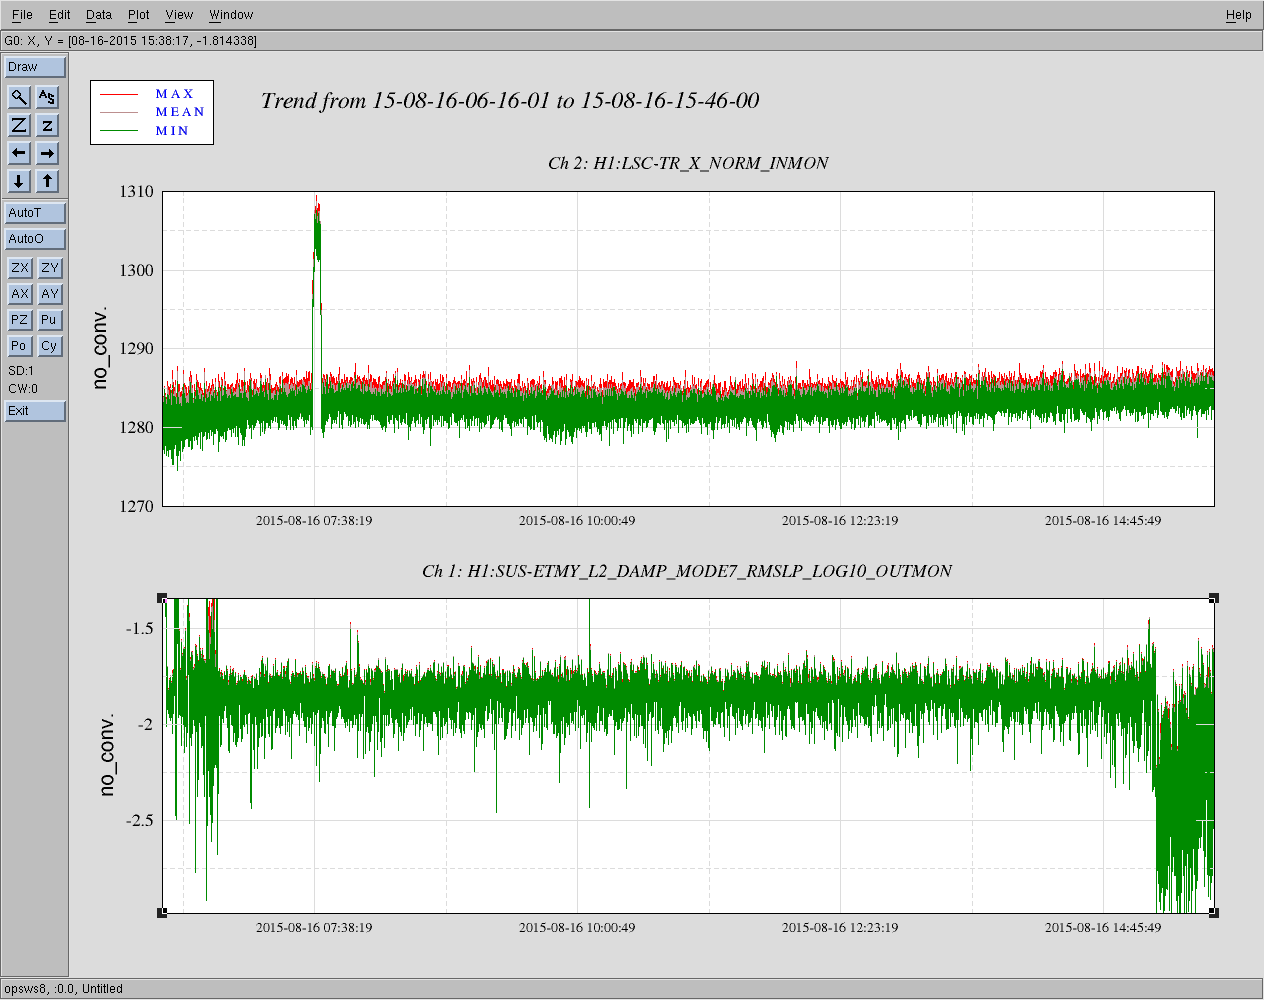
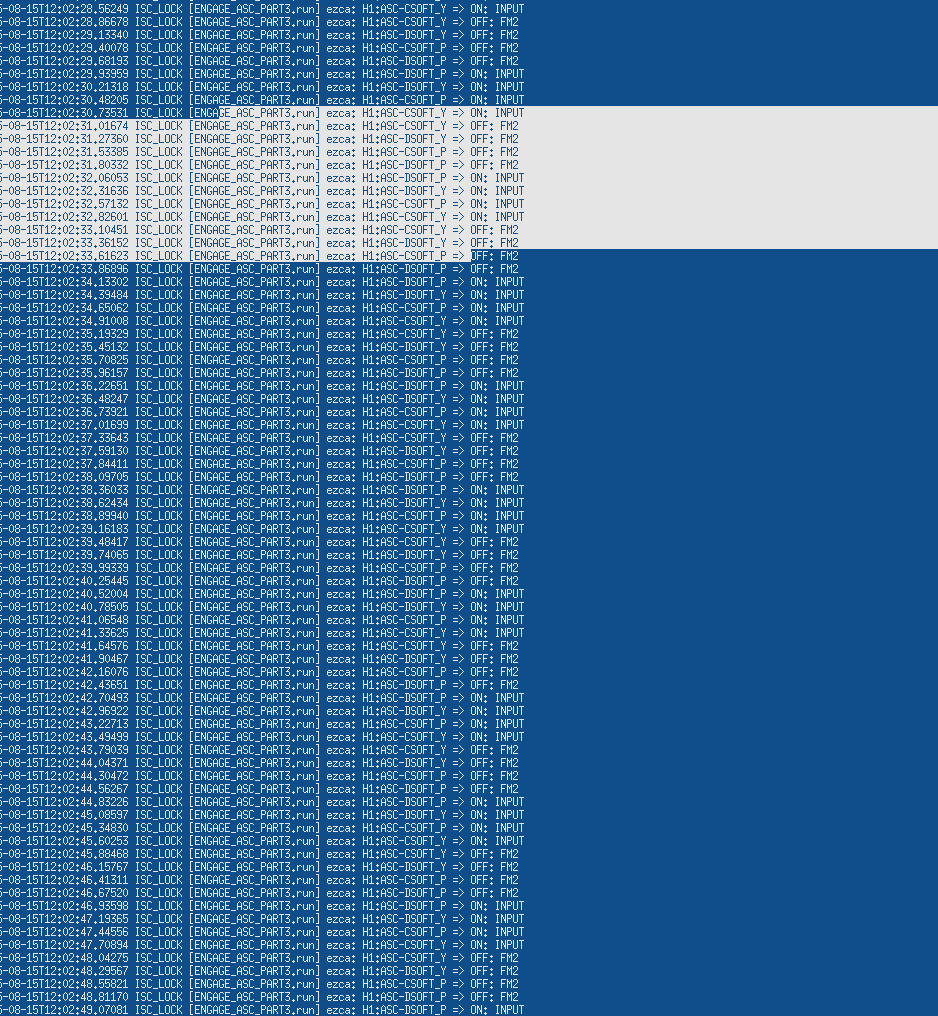
The violin modes hunting: Today I identified more ITM first harmonics. They have been added to the table. Including damping filters (which are subject to change). The ITMs are pretty much controlled.
Happy Sunday!
Images attached to this report