betsy.weaver@LIGO.ORG - posted 12:27, Thursday 04 June 2015 (18862)
SDF alarms before this lock stretched that were cleared
Just before setting the intent bit for the current lock stretch, Patrick, Kiwamu and I looked at SDF. A few red alarms needed attention. We set SDFs:
- H1:LSC-TR_X_NORM set to be not MON, since GRD manges this channel.
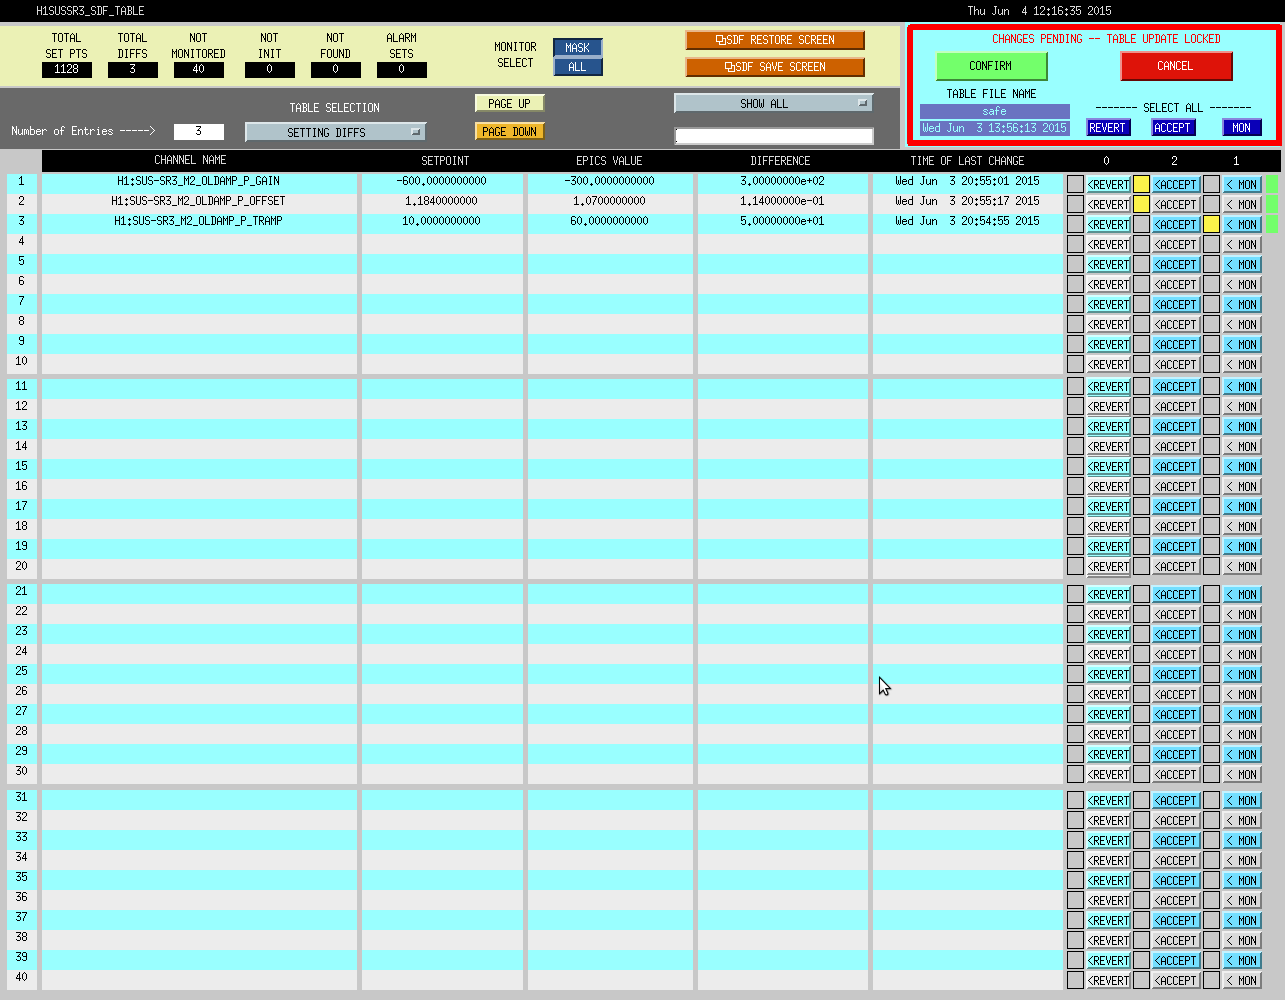
- ACCEPTED SR3 M2 OPLEV damping loop arrangement revised by Sheila yesterday - see snapshot of what values were accepted.
- OMC DITHER button was ON, turned button OFF since actually no EXC was happening. Likely left over from work last night.
- SRM and PRM had gains changed to zero in the LOCK L loop that is unused. We set these to -0.02 as that was what SDF was expecting. Again, loops are off so no functional change.
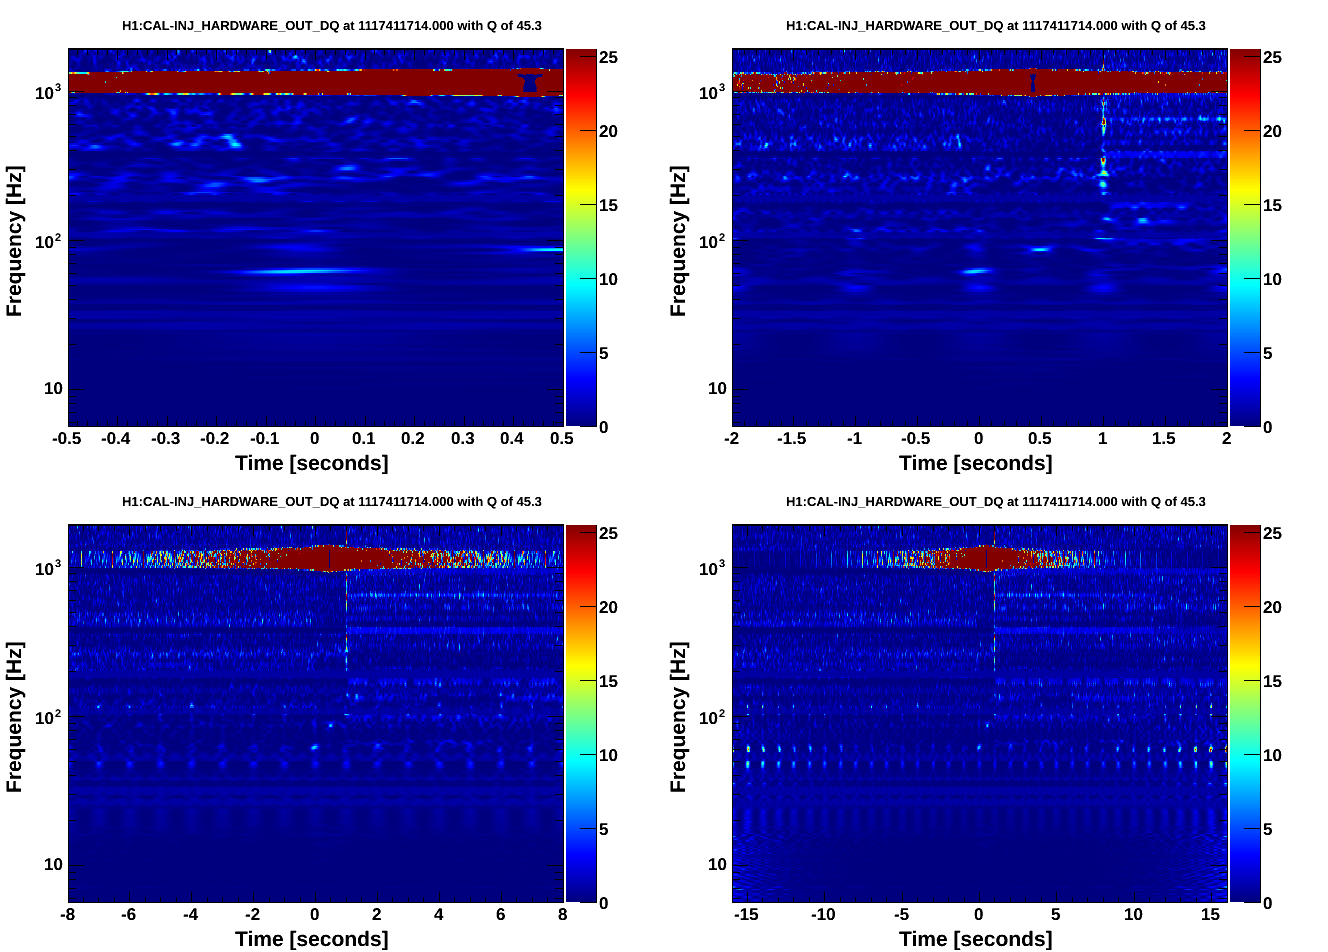
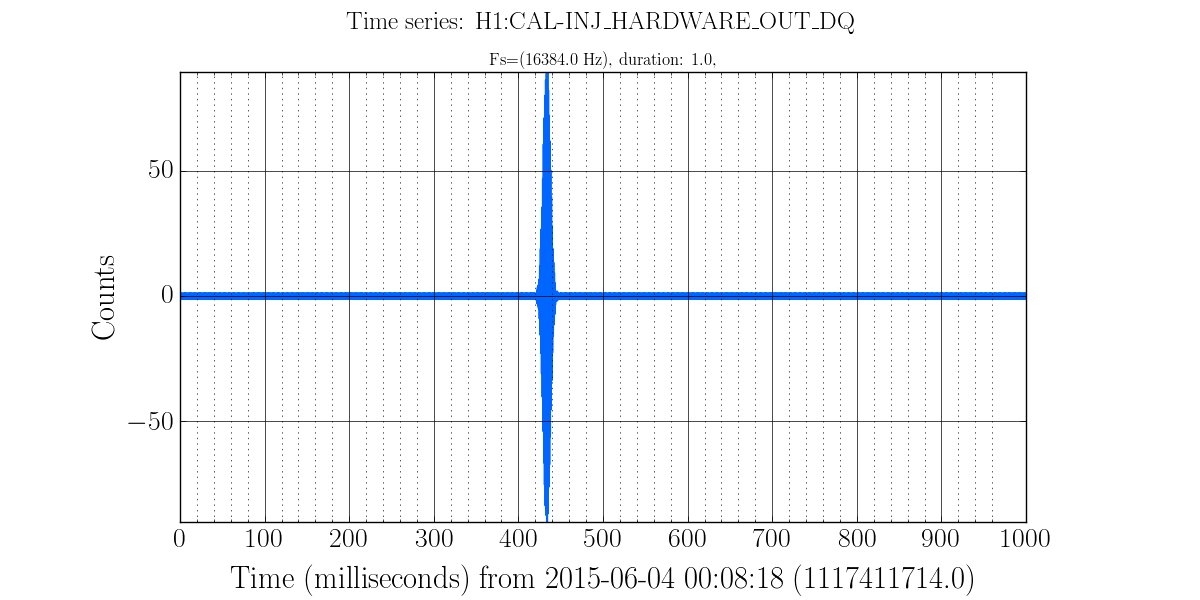
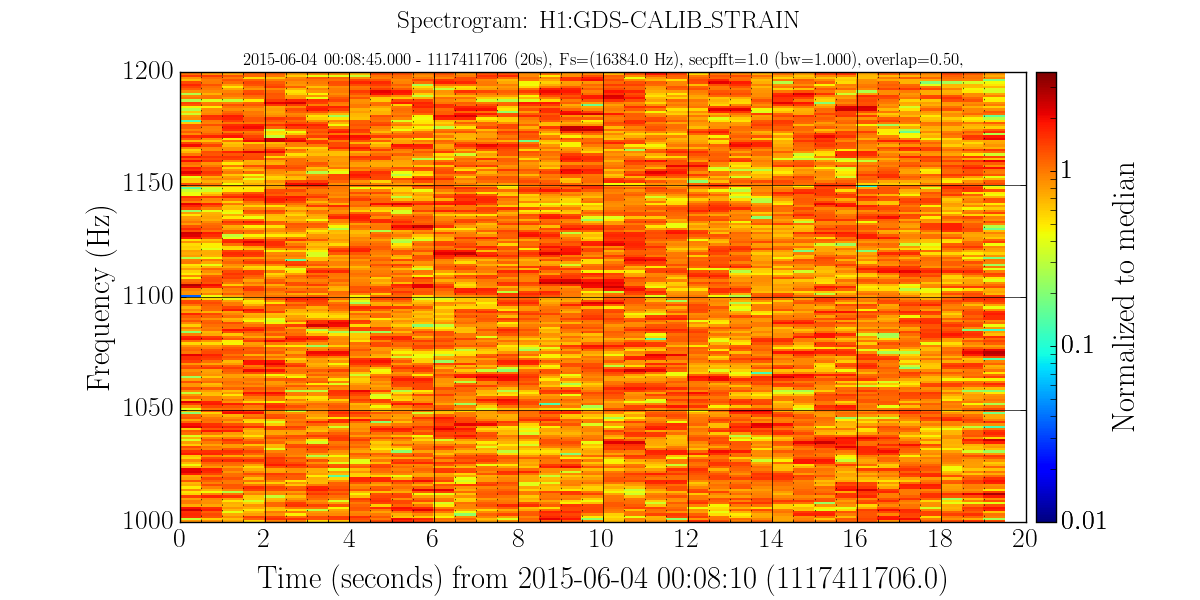
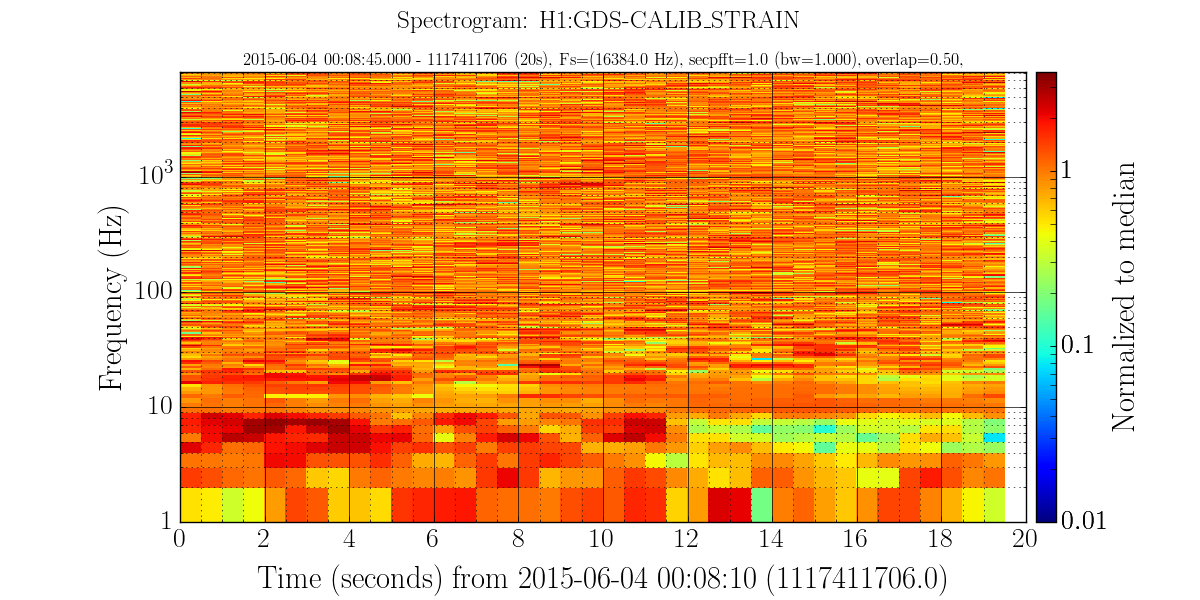
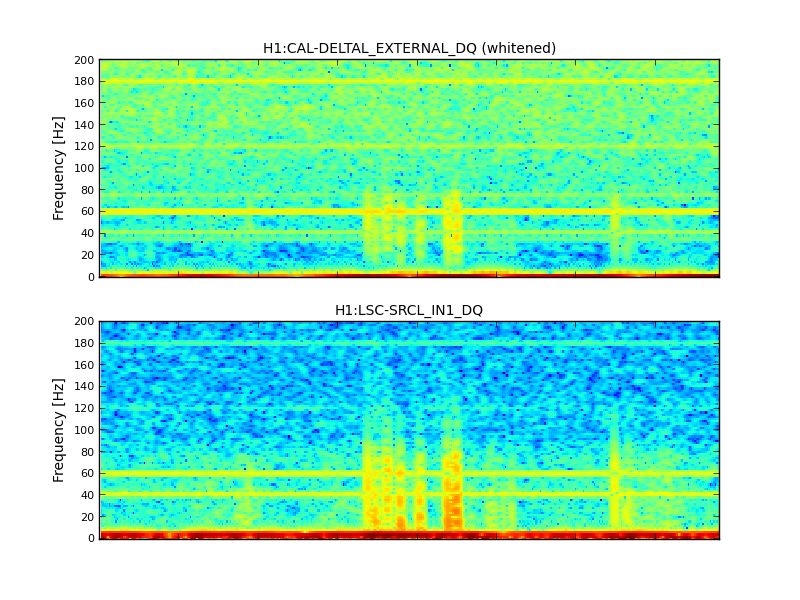
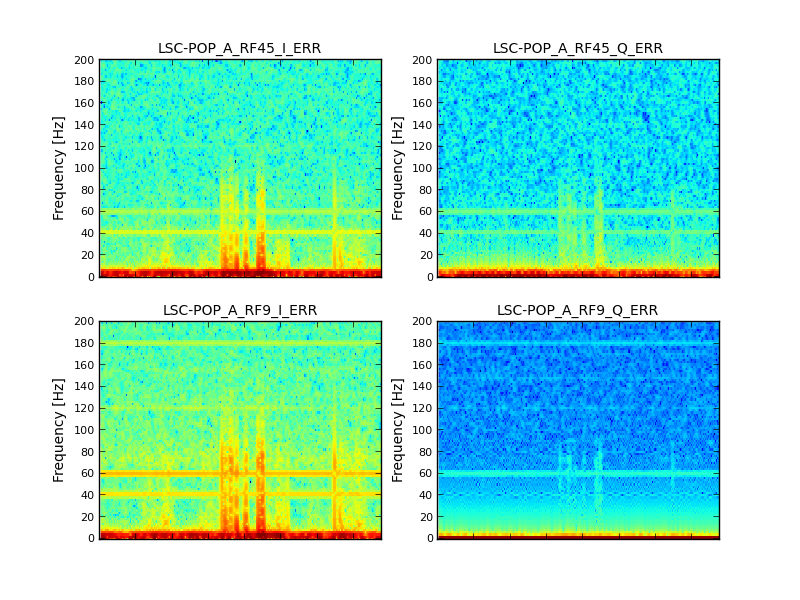
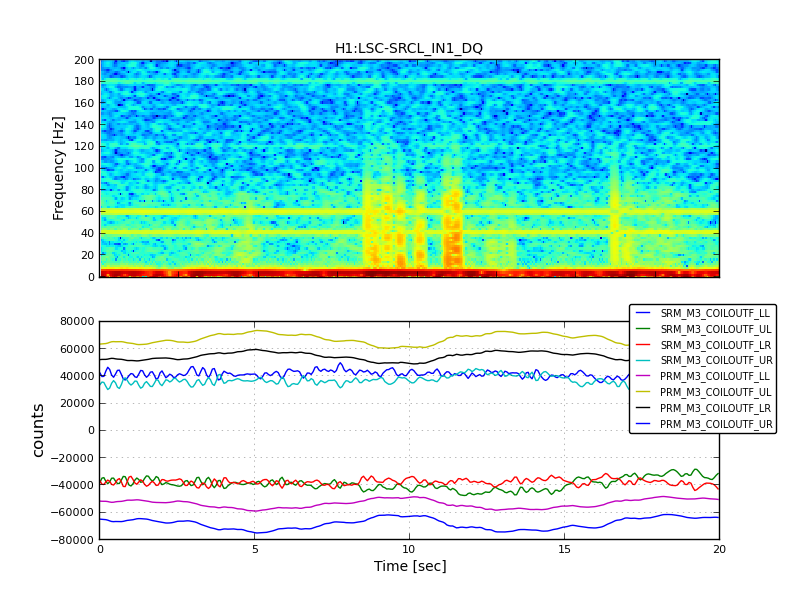
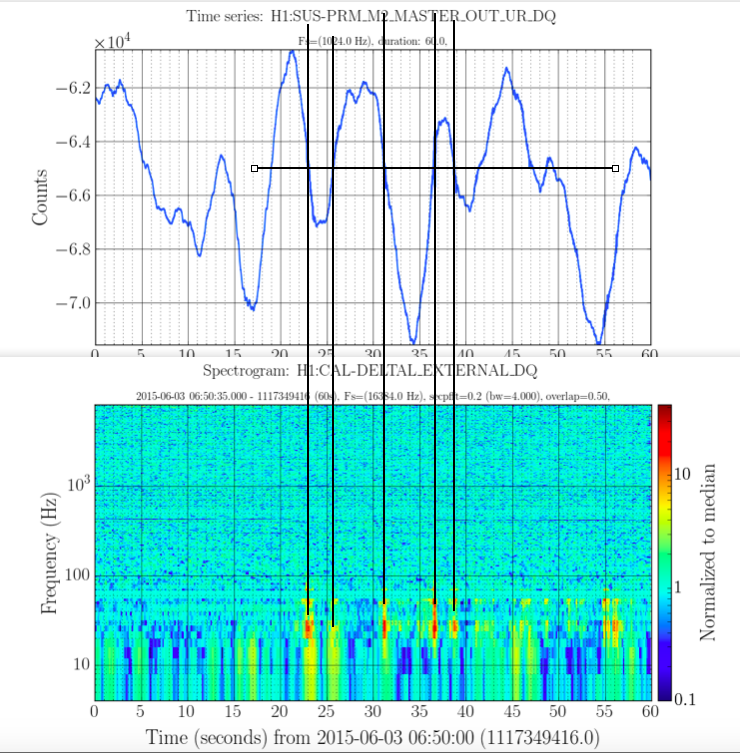
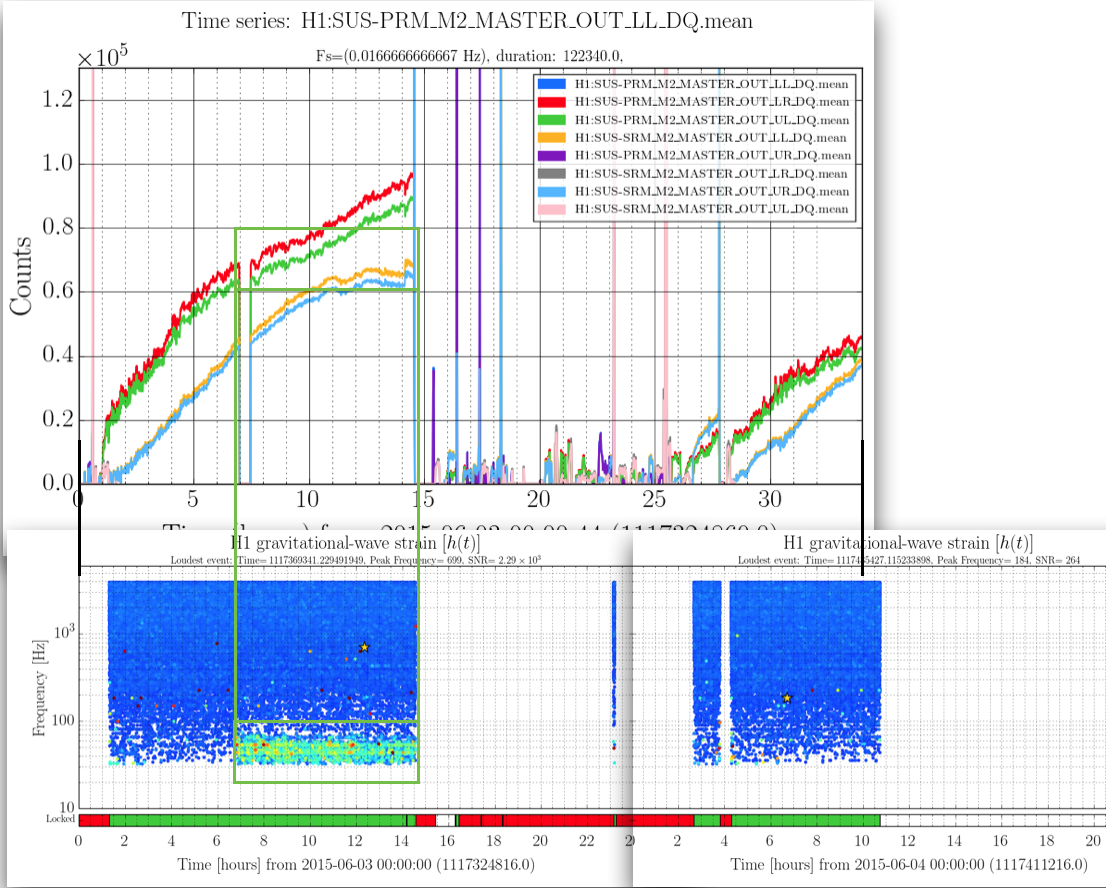
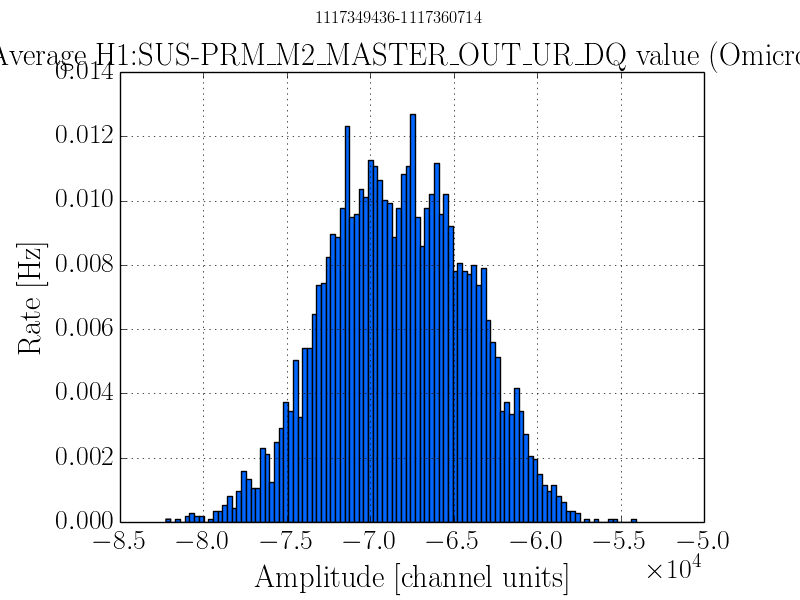
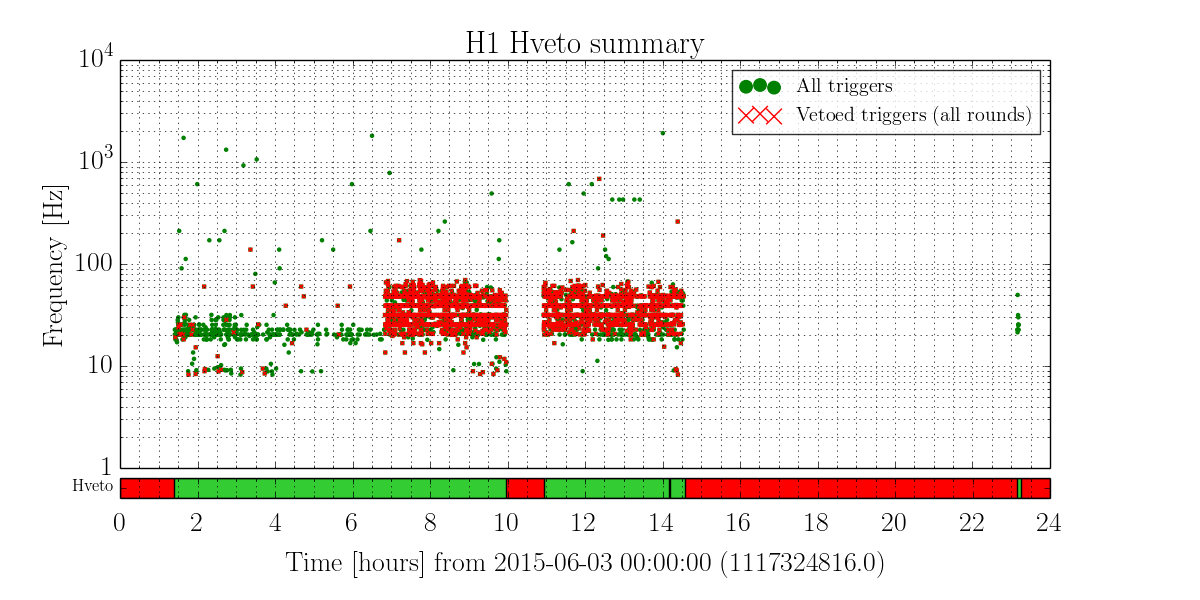
Images attached to this report