[Jim, Fabrice]
To help comparing and finding the best of the blend configurations used at each sites, we loaded the LLO blend configuration on ITMY. Unlike for previous transfers of filters from site to site, we did not export the filters from LLO foton files into different continuous or digital forms before to re-convert them, simplify and re-install them into LHO foton file. We directly copied and pasted the second order sections from one foton file to another. [We used the filter file logged in the repository Keith has set up (very useful!): https://daqsvn.ligo-la.caltech.edu/websvn/]. A few blend filters take two banks, we left it that way.
We performed measurements with the initial configurations (called "before" in the figures) and with the LLO filters configuration (called "after" in the figures). The blend configurations are summarized at the end of the report.
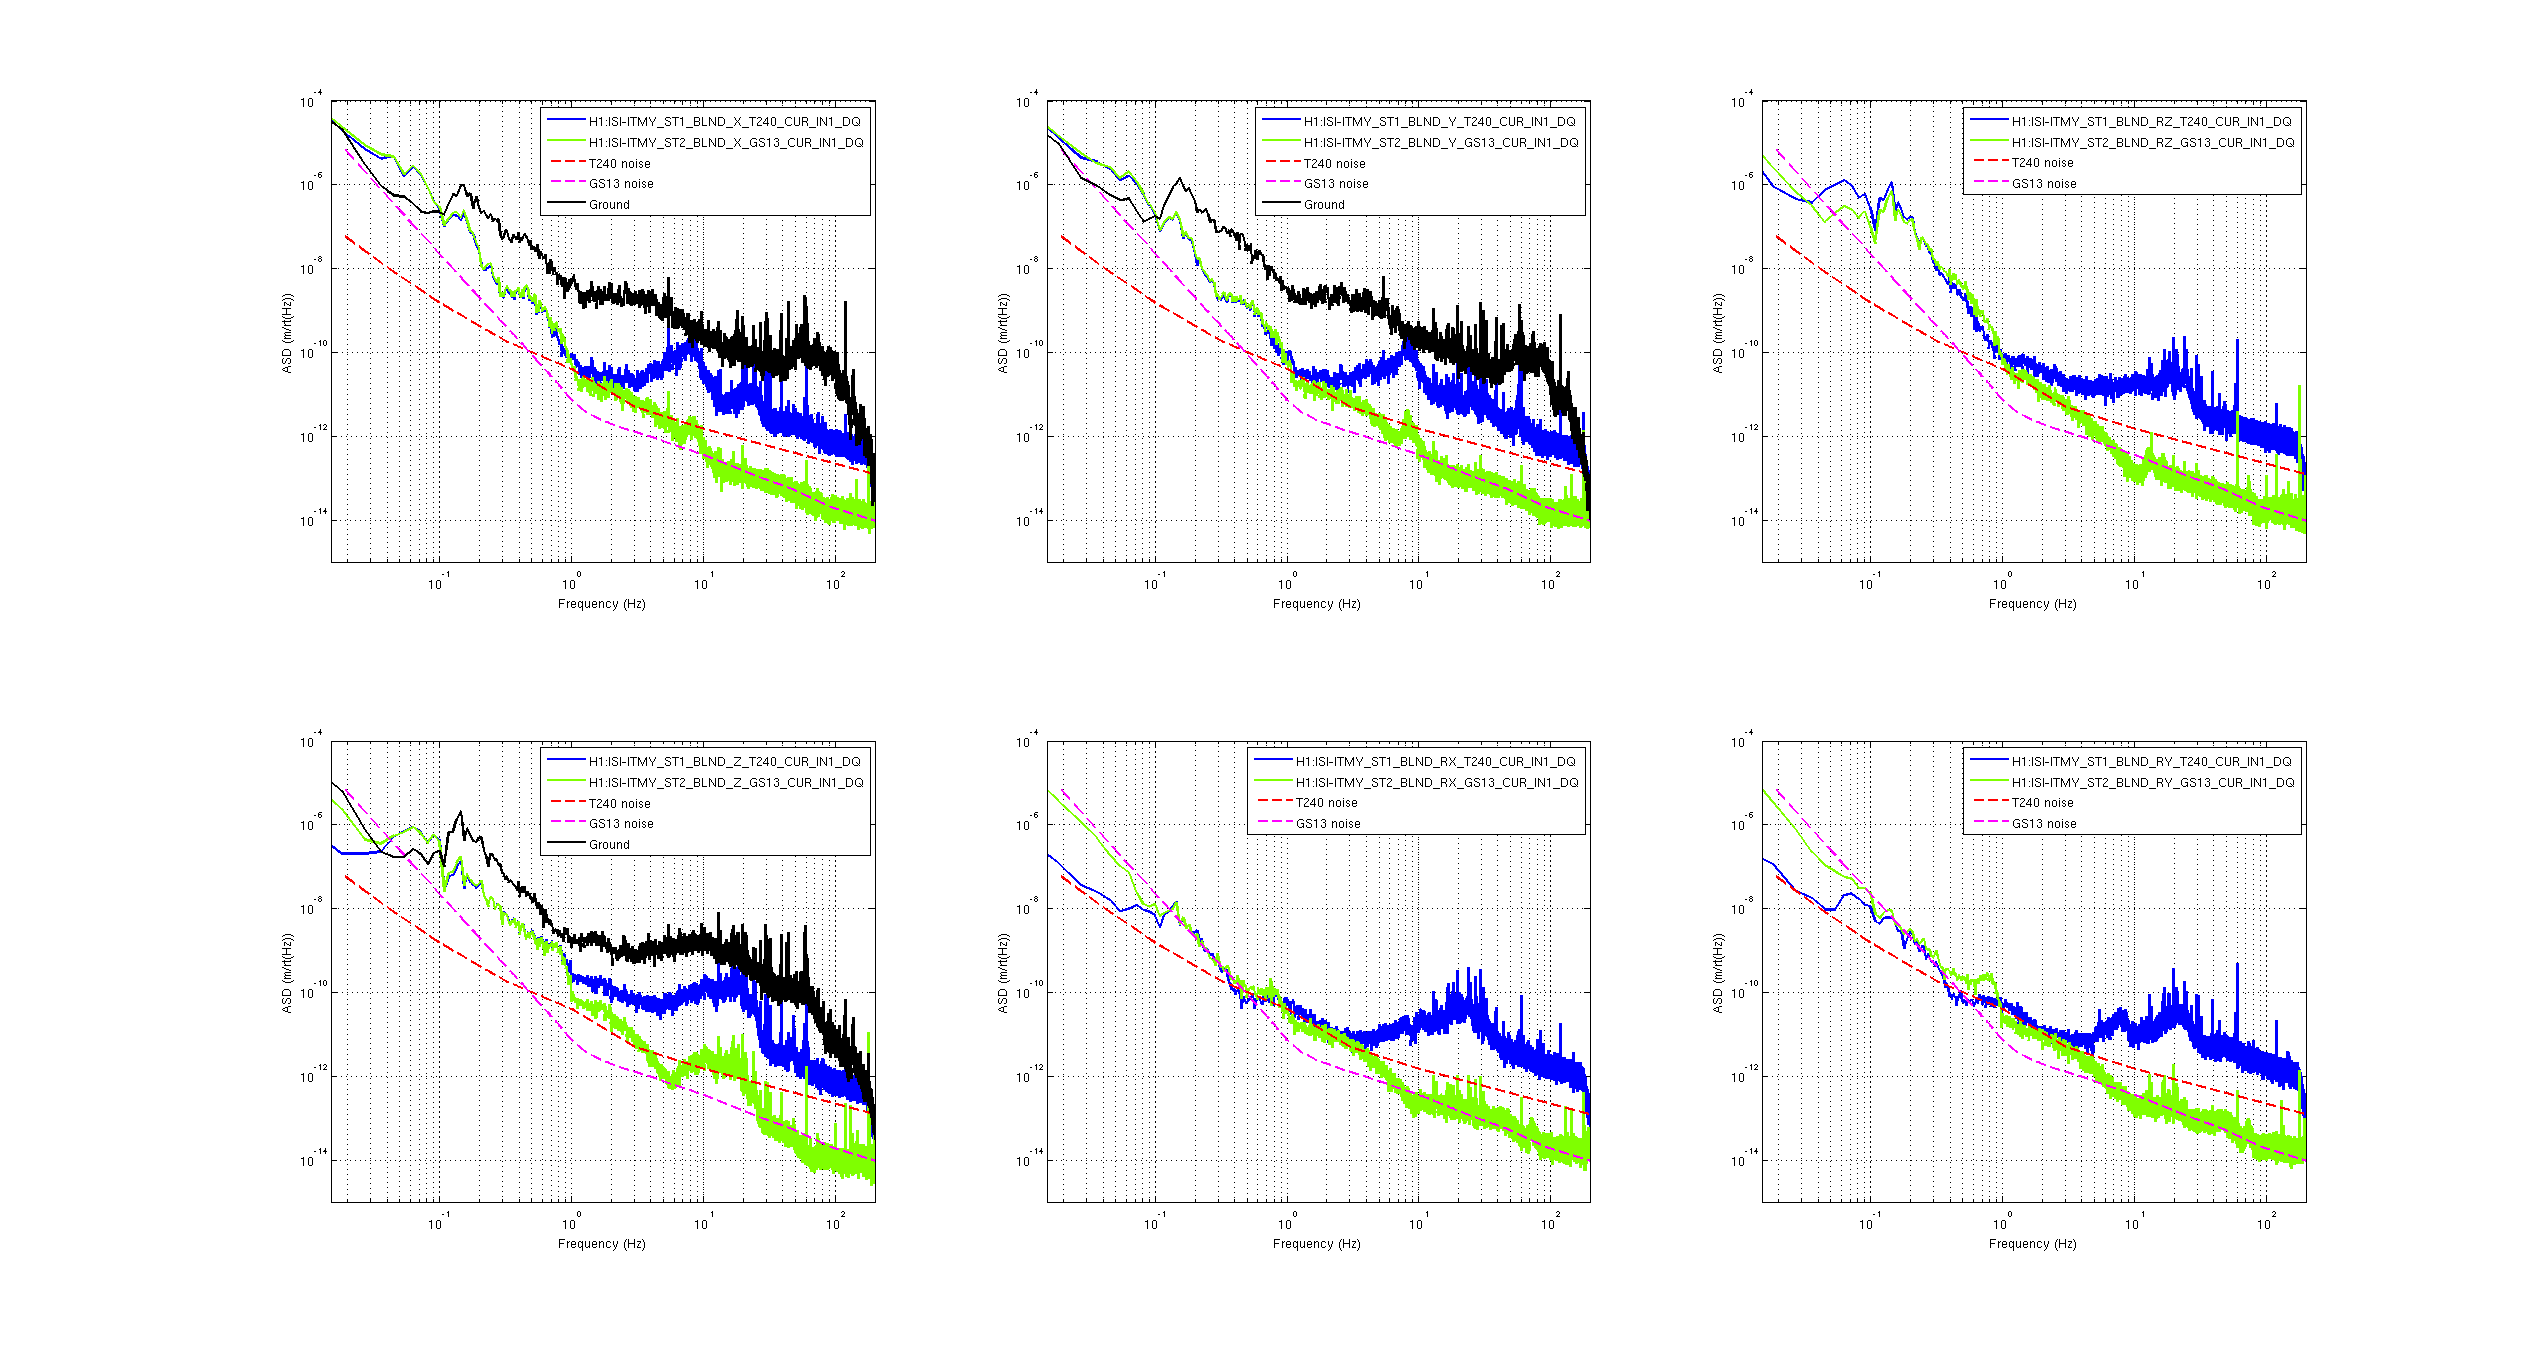
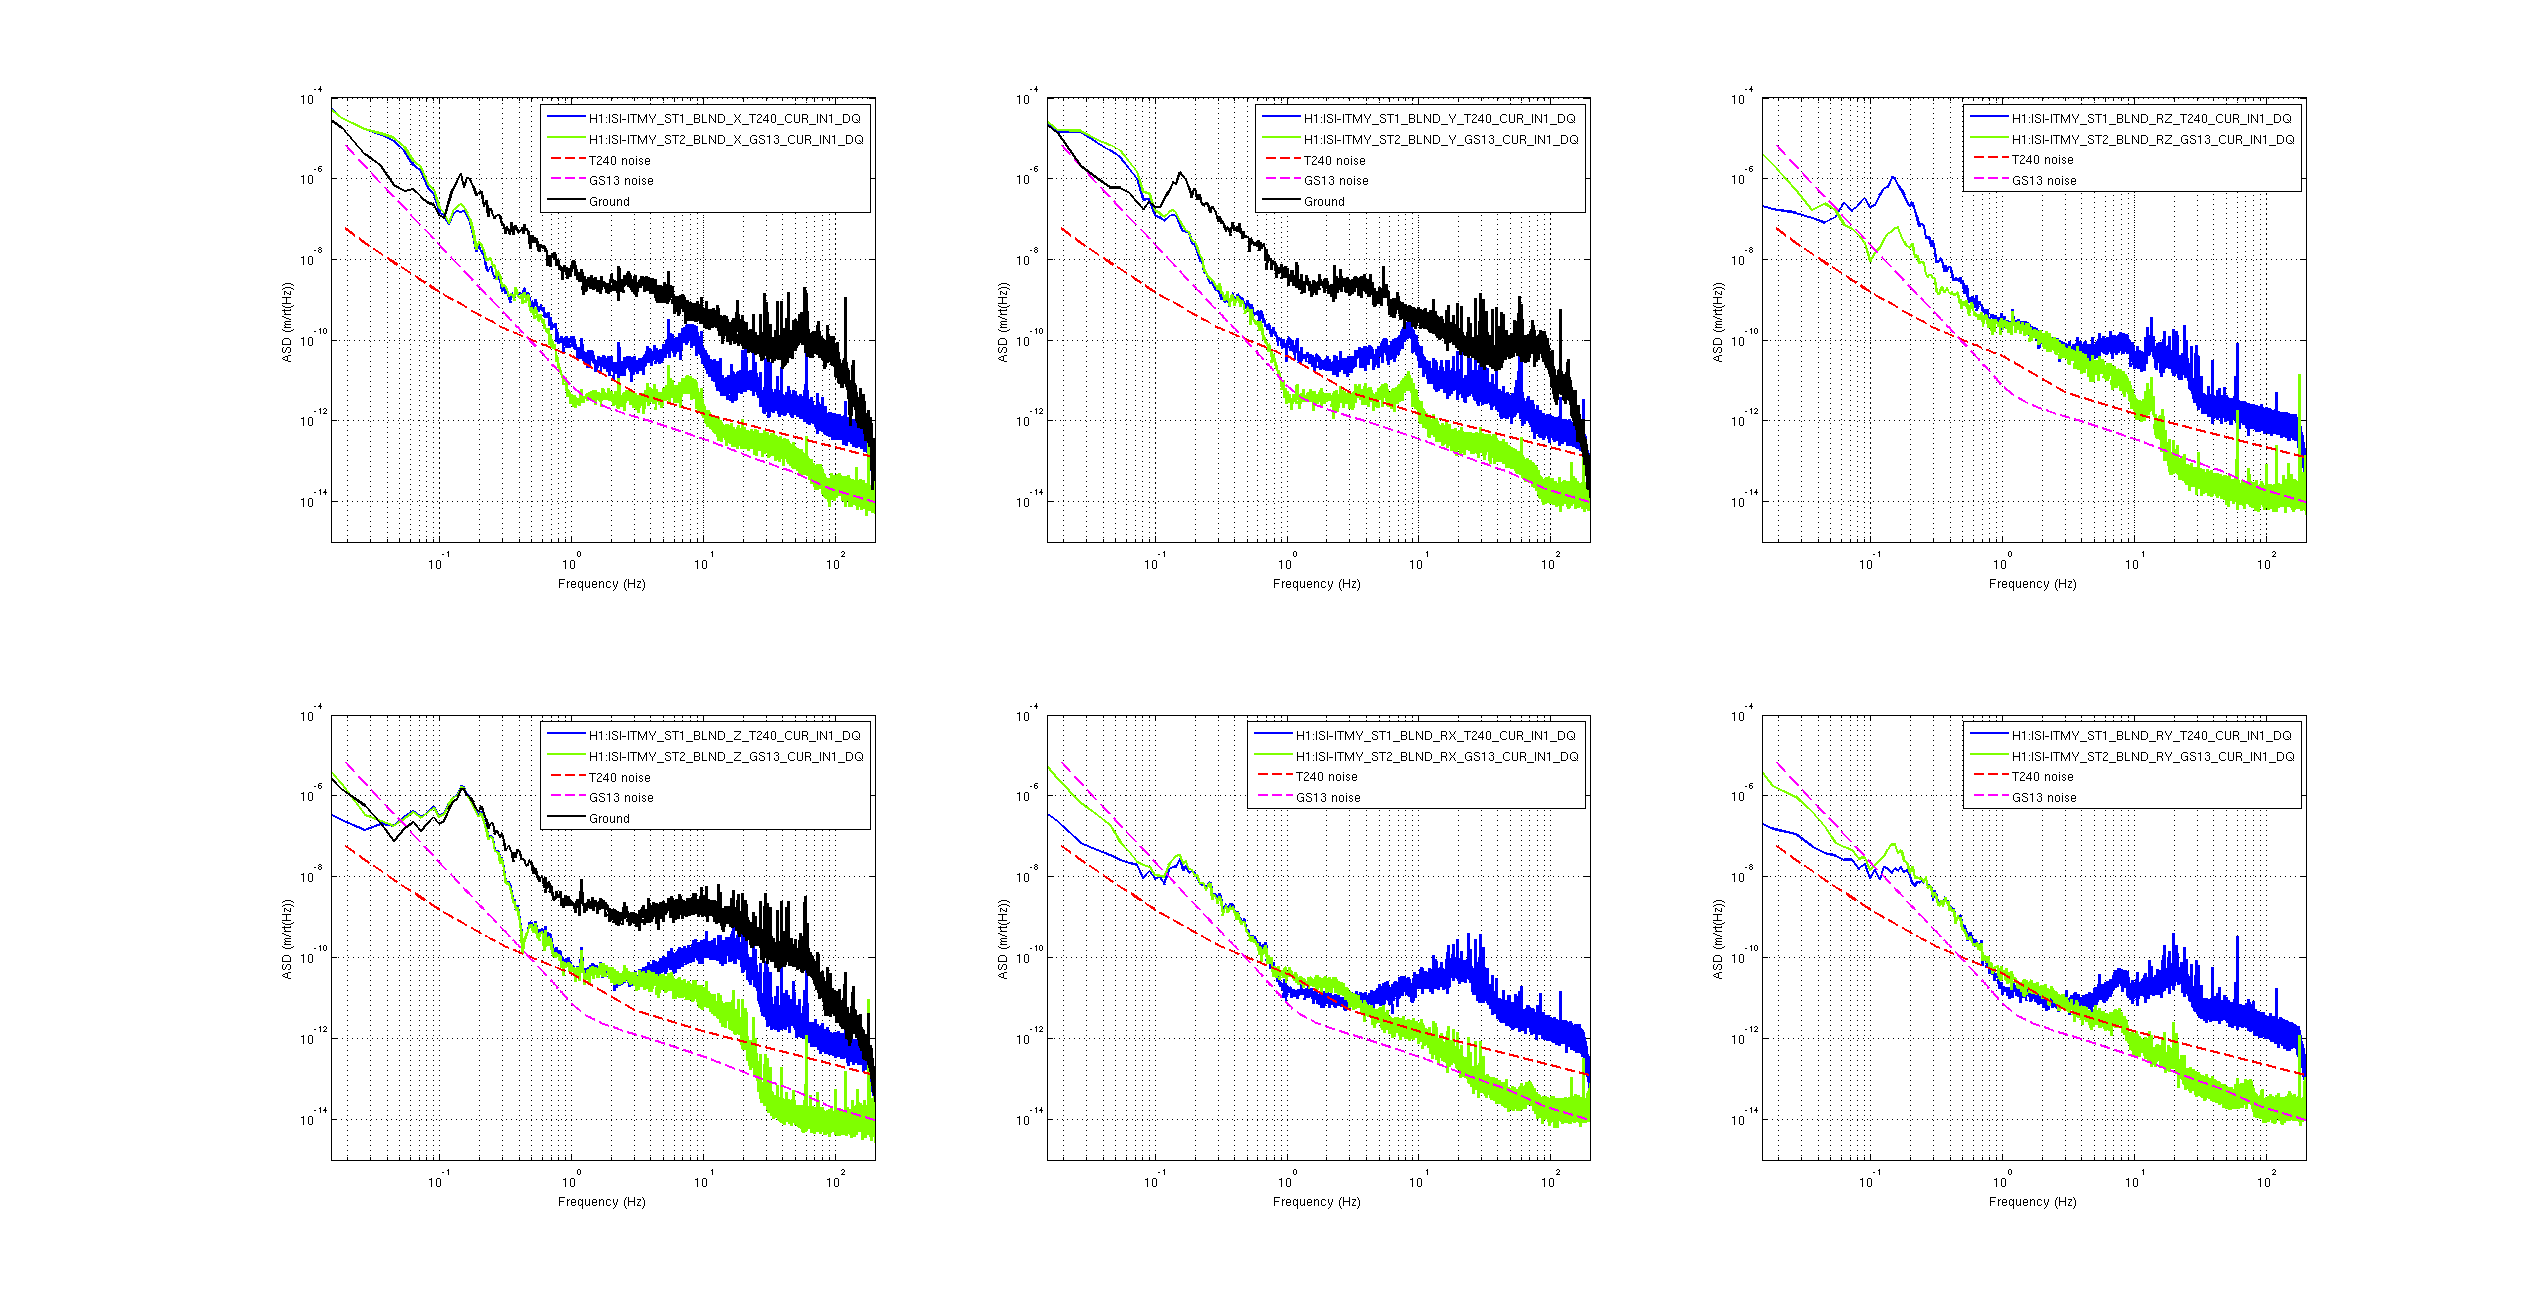
- The first two figures show the ISI motion for each configuration. Using the LLO config (after), the X and Y motion is lower at the suspension resonances at the cost of more motion at higher frequencies (good compromise). The rotational motions appear higher at most frequencies.
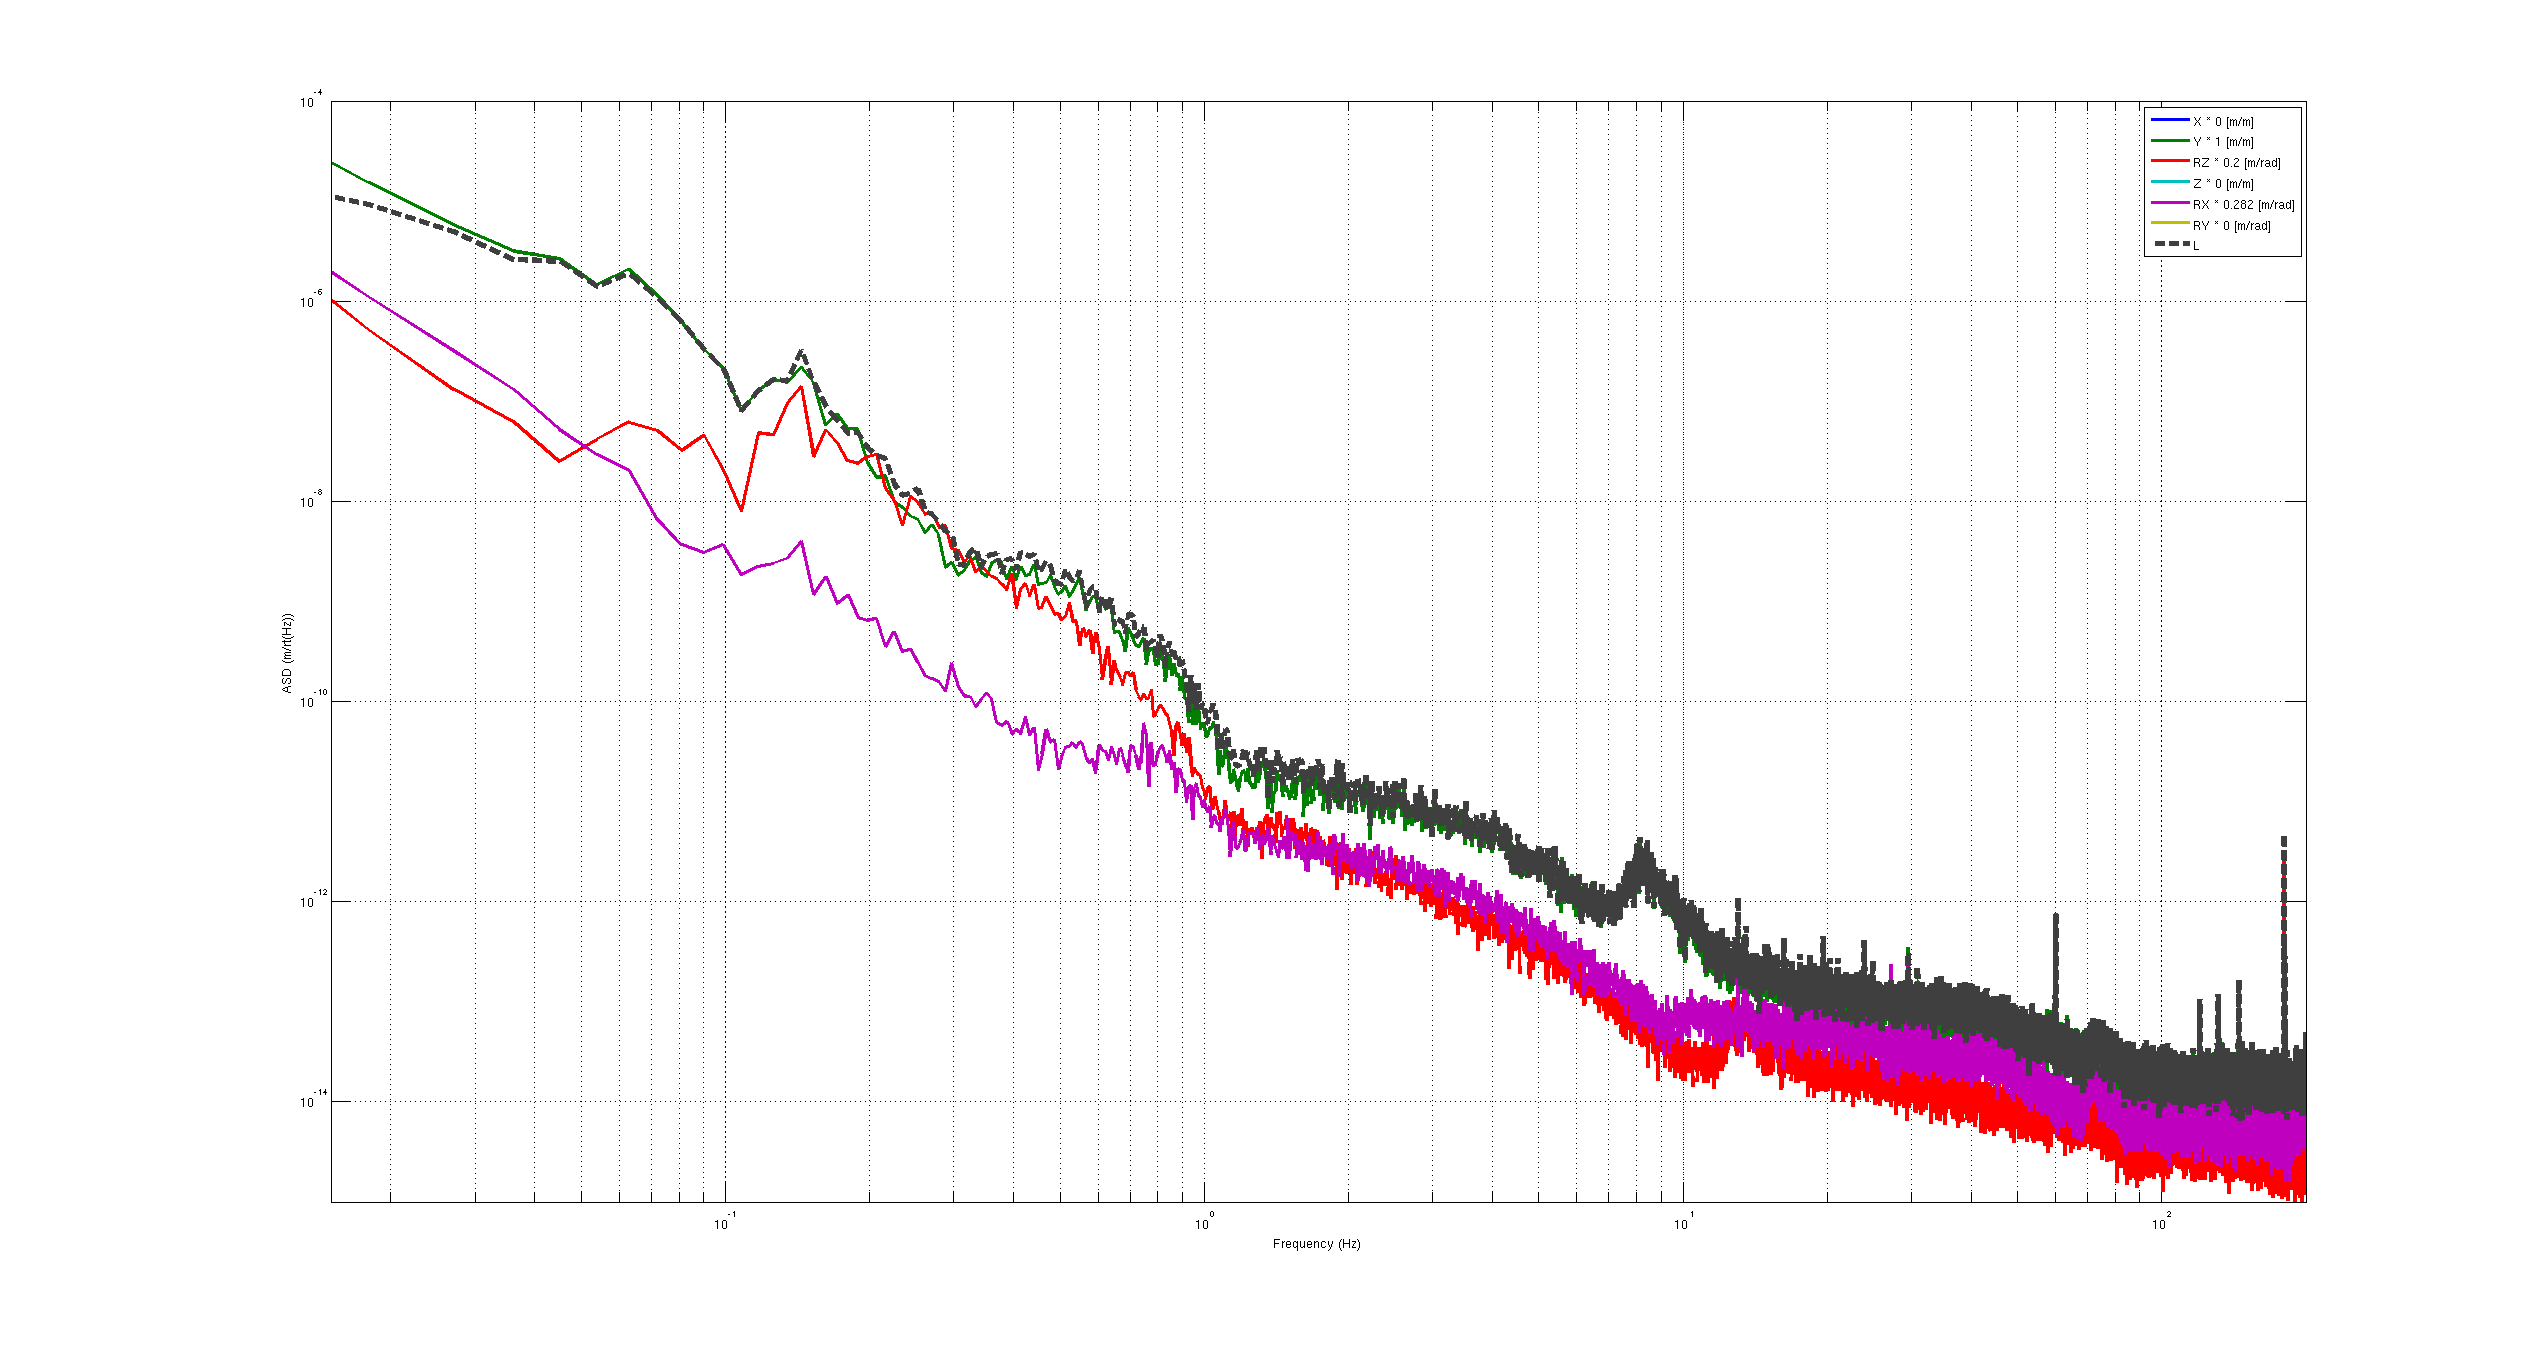
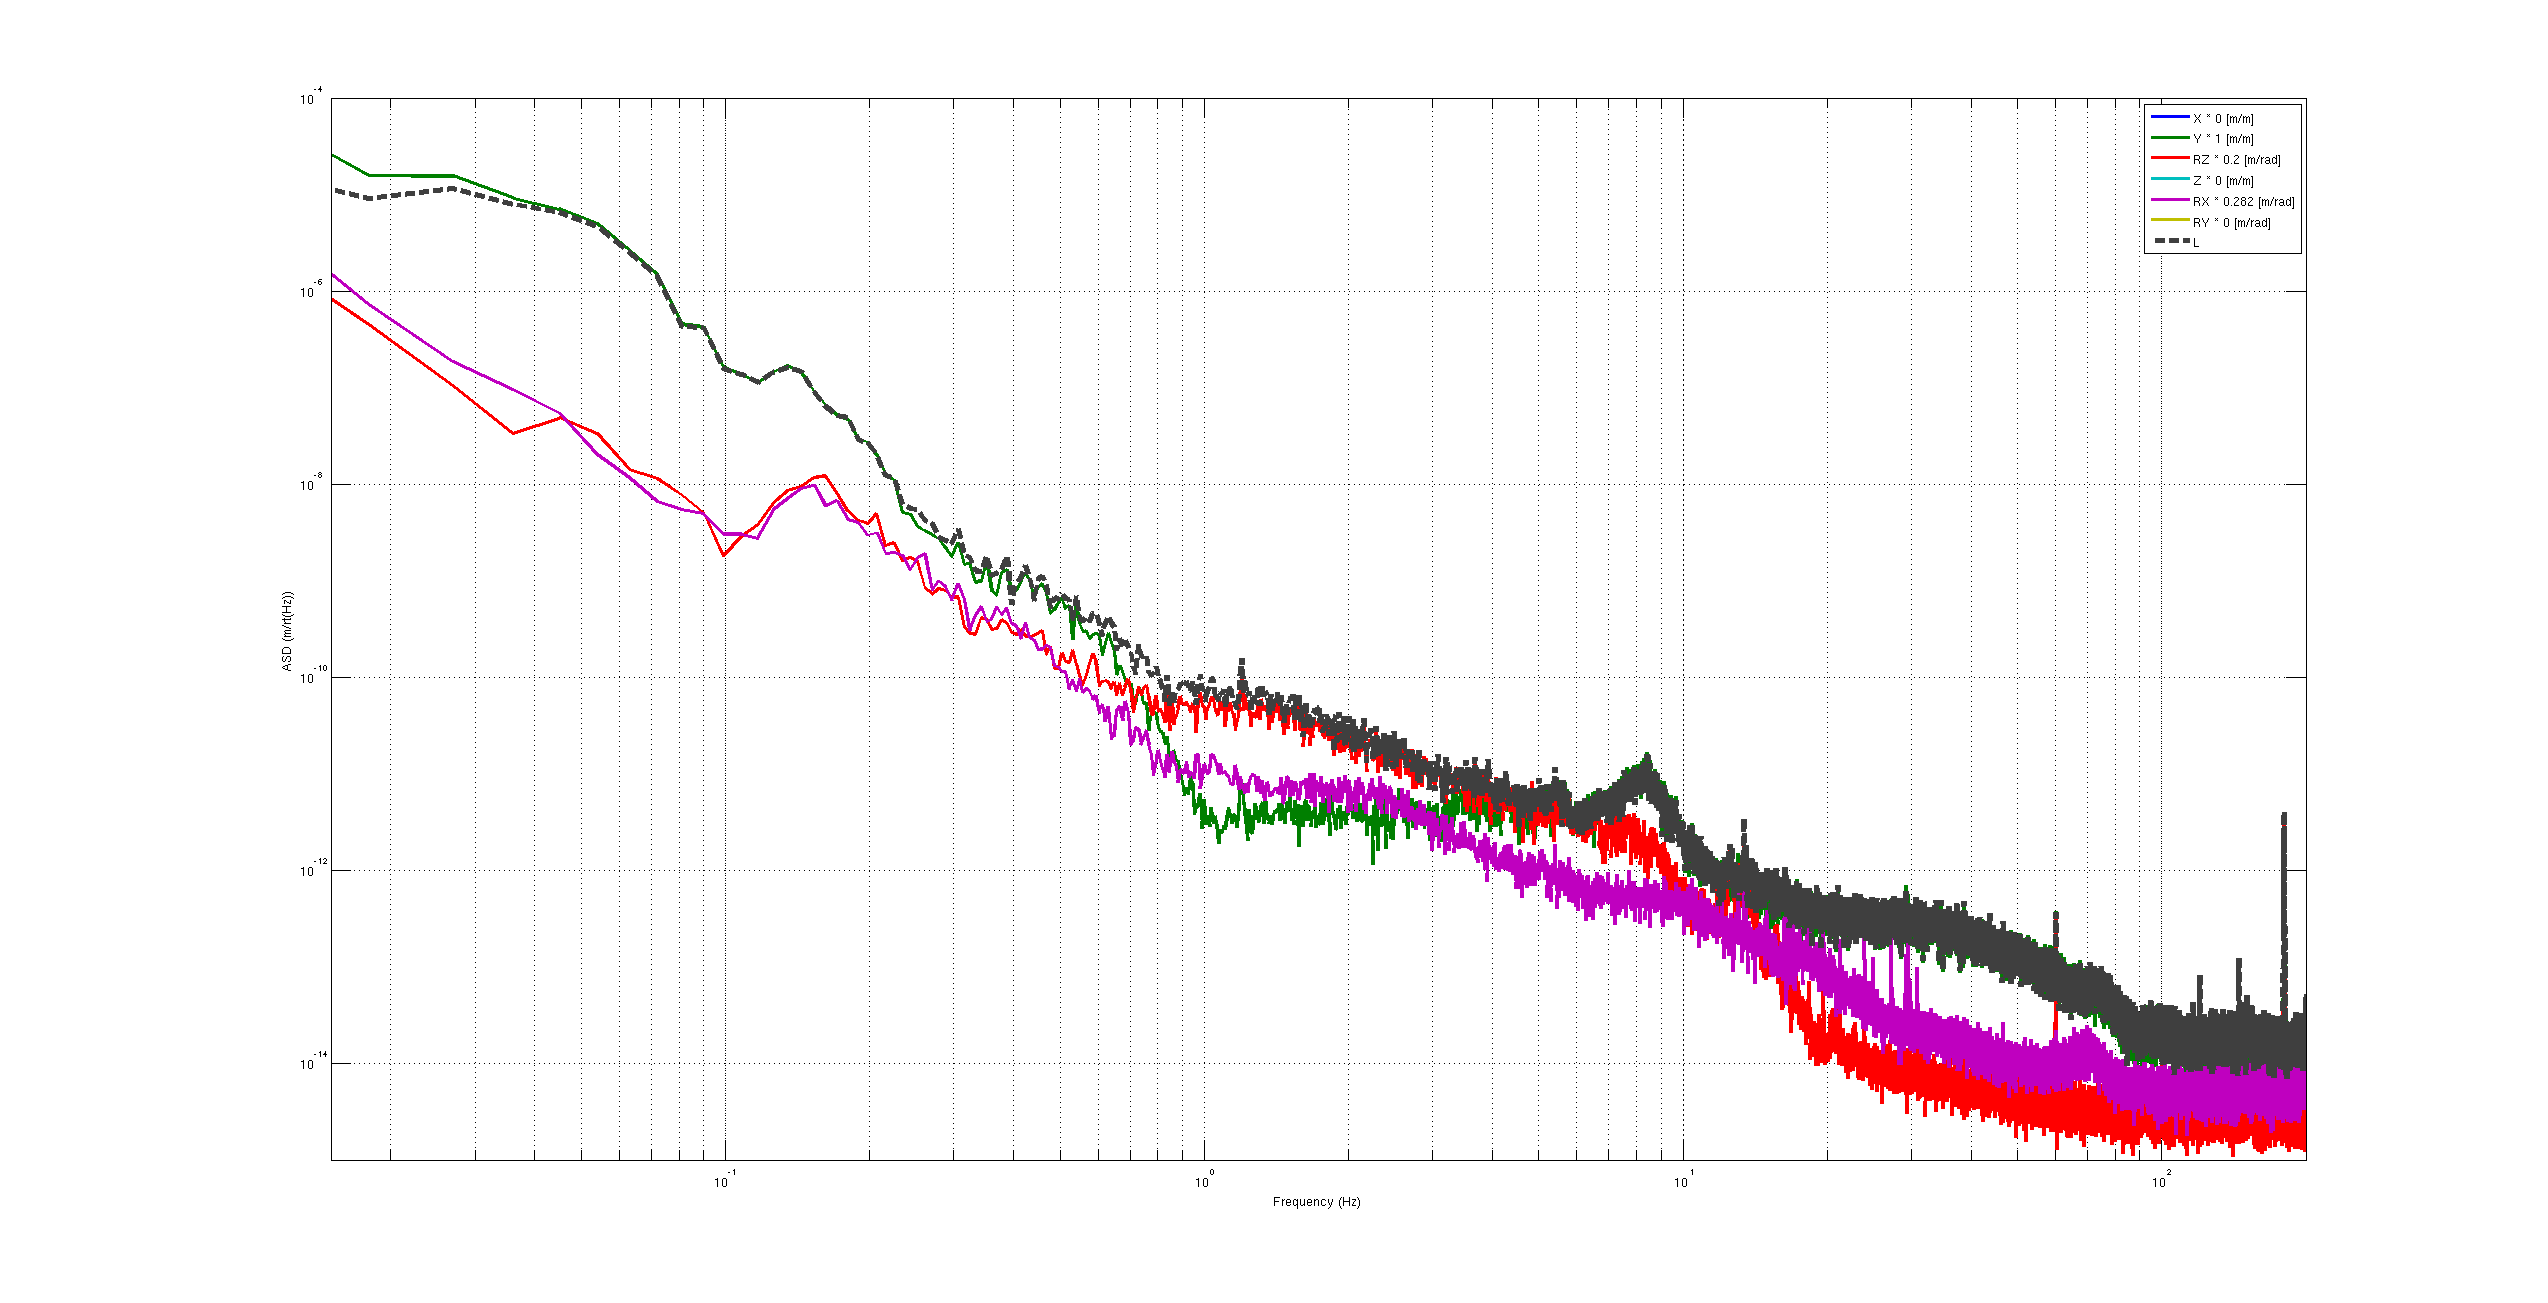
- The next two figures show the suspension point motion for each configuration. In the initial configuration, the suspension point motion is dominated by ISI longitudinal motion at almost all frequencies. With the LLO blend, the RZ motion takes over around 1 Hz.
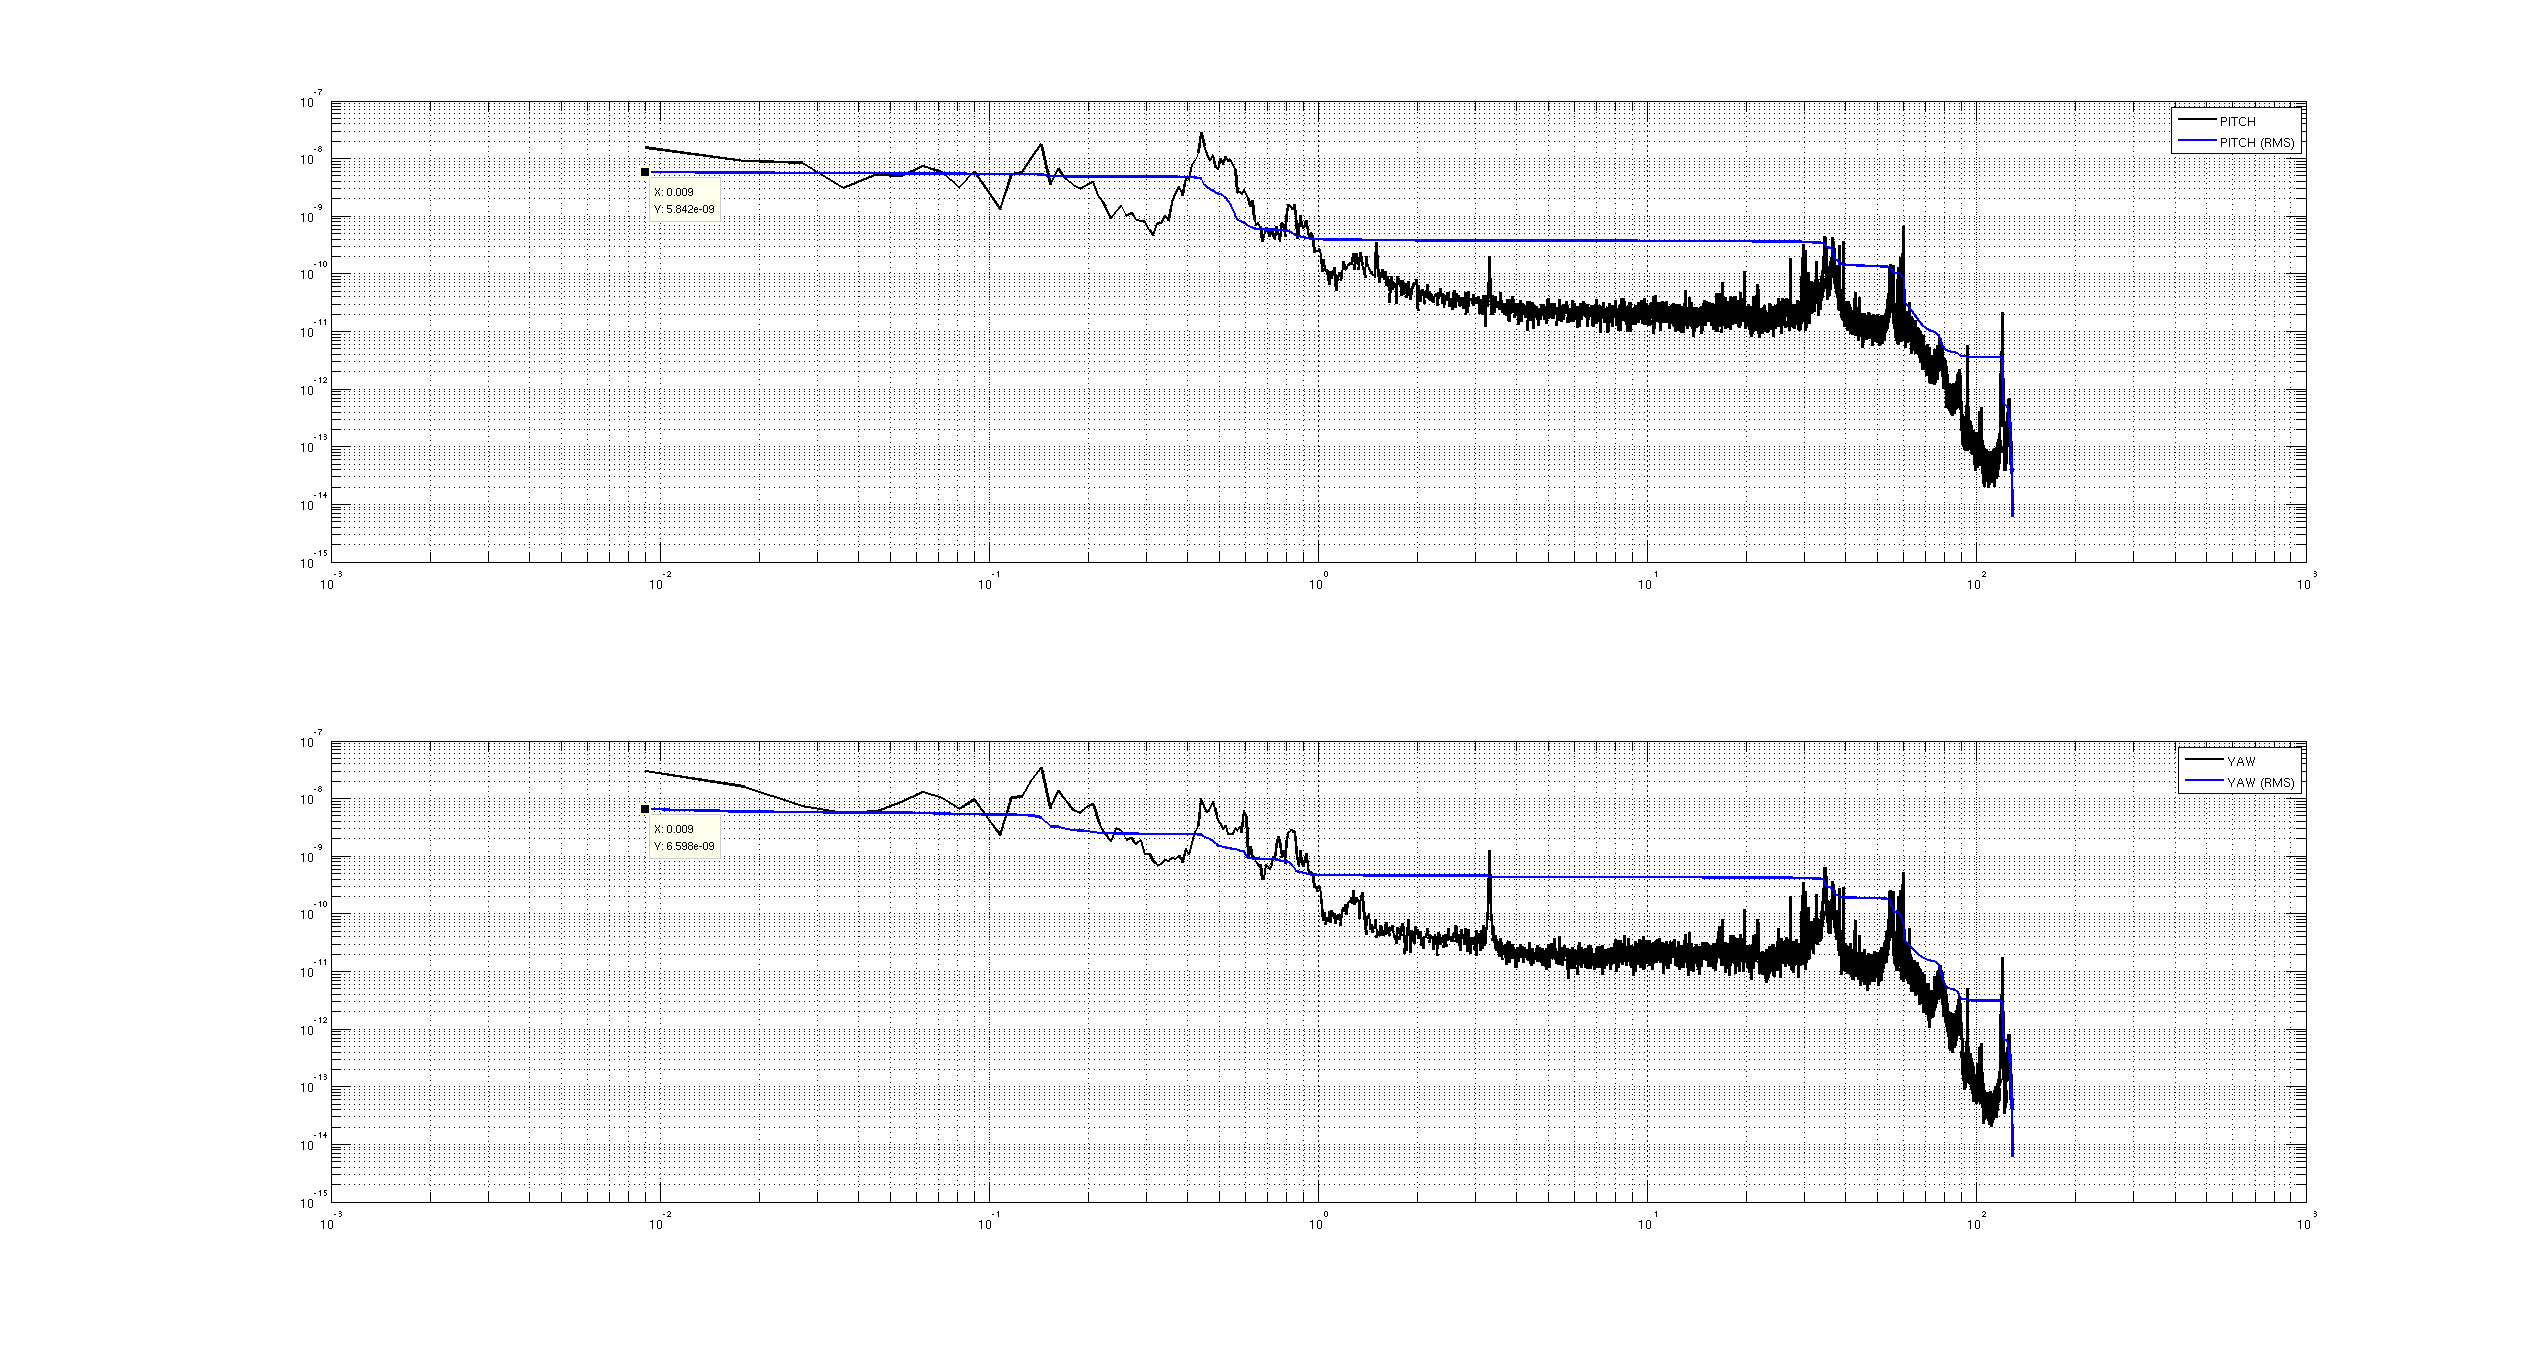
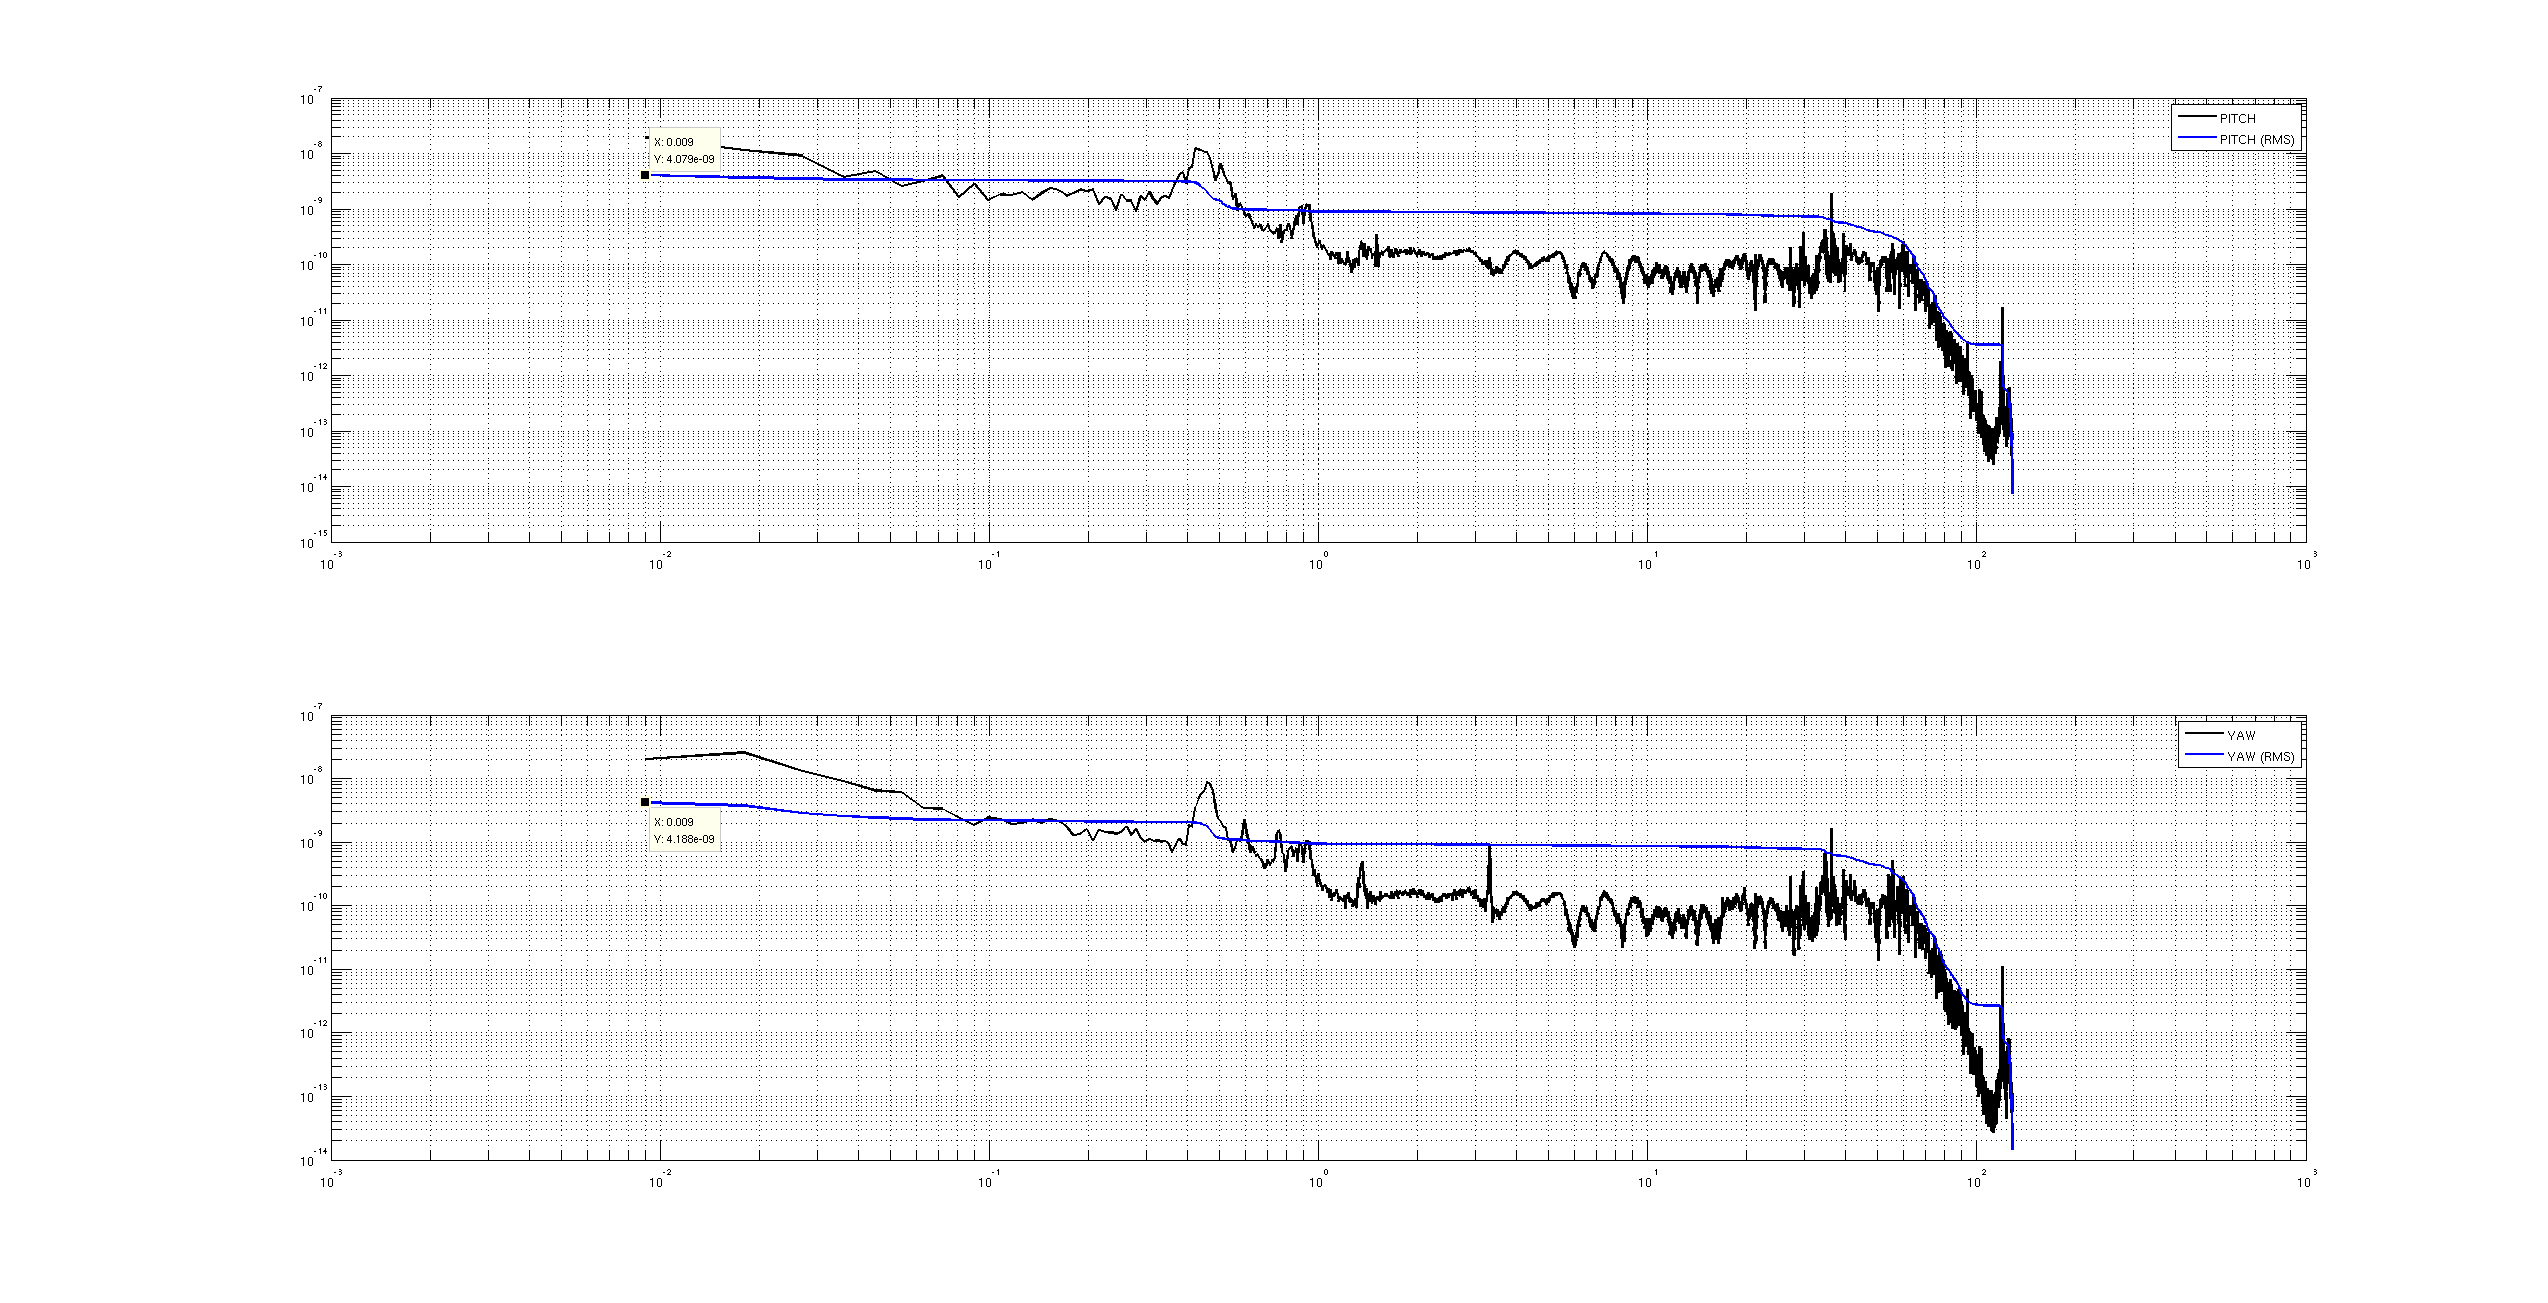
- The last two figures show the optical lever motion for each configuration. In this example the Pitch RMS motion went from 5.8 nRad (before) to 4.1 nRad (after). The Yaw RMS motion went from 6.6 nRad to 4.2 nRad. [These numbers seem very small (calibration issue?) but the relative comparison is probably fair.]
We leave it on for tonight for making a comparison over a longer stretch of time.
---------------
Blend configuration used for the "before" and 'after" measurements.
DOF: Before / After
Stage 1 X : Tbetter / 45mHz
Stage 1 Y: Tbetter / 45mHz
Stage 1 RZ: TCrappy / Off
Stage 1 Z: T750mHz / 90mHz
Stage 1 RX: Tbetter / [250a & 250b for CPS and T240, 250 for L4C]
Stage 1 RY: Tbetter / [250a & 250b for CPS and T240, 250 for L4C]
Stage 2 X : T750mHz / 250 mHz
Stage 2 Y: T750mHz / 250 mHz
Stage 2 RZ: T750mHz / Off
Stage 2 Z: T750mHz / Off
Stage 2 RX: T750mHz / Off
Stage 2 RY: T750mHz / Off