corey.gray@LIGO.ORG - posted 16:01, Tuesday 03 January 2017 (32909)
Ops Day Summary
TITLE: 01/03 Day Shift: 16:00-00:00 UTC (08:00-16:00 PST), all times posted in UTC
STATE of H1: Preventitive Maintenance
INCOMING OPERATOR: Ed
SHIFT SUMMARY:
Had snowy roads/parking lot & Hanford site had DELAY of 60-90min.
Spent first few hours recovering from Holiday Mode; around lunch time started an INITIAL ALIGNMENT; minor trouble shooting; made it to NOMINAL_LOW_NOISE for 1-min and then 7.2 EQ took us down & will keep us down for a while.
LOG:
- Apollo working on HVAC Controls (with Bubba)
- 16:19 Charging LVEA forklift batteries (Joe D)
- 16:25 Addressing ISIs & getting back to NOMINAL (JeffK)
- 16:38 Opening PSL Shutter (Corey)
- 17:24 Checking on PSL & TCS
- 17:30 Norco truck heading to CP6 (MX's -4379)
- 17:39 2nd Norco truck also heading to MX (CP5, -4377)
- 18:10 Fixing Leap Second issue which affects python operations (Jim)
- 18:15 Picking Up STS at EY (Jim)
- 18:33 MY cable inventory
- 18:59 Paradise water
- 19:15-20:56 Alignment
- 19:18 Gerardo removing snow of solar panels down both arms (Actually he found out John/Kyle took care of it)
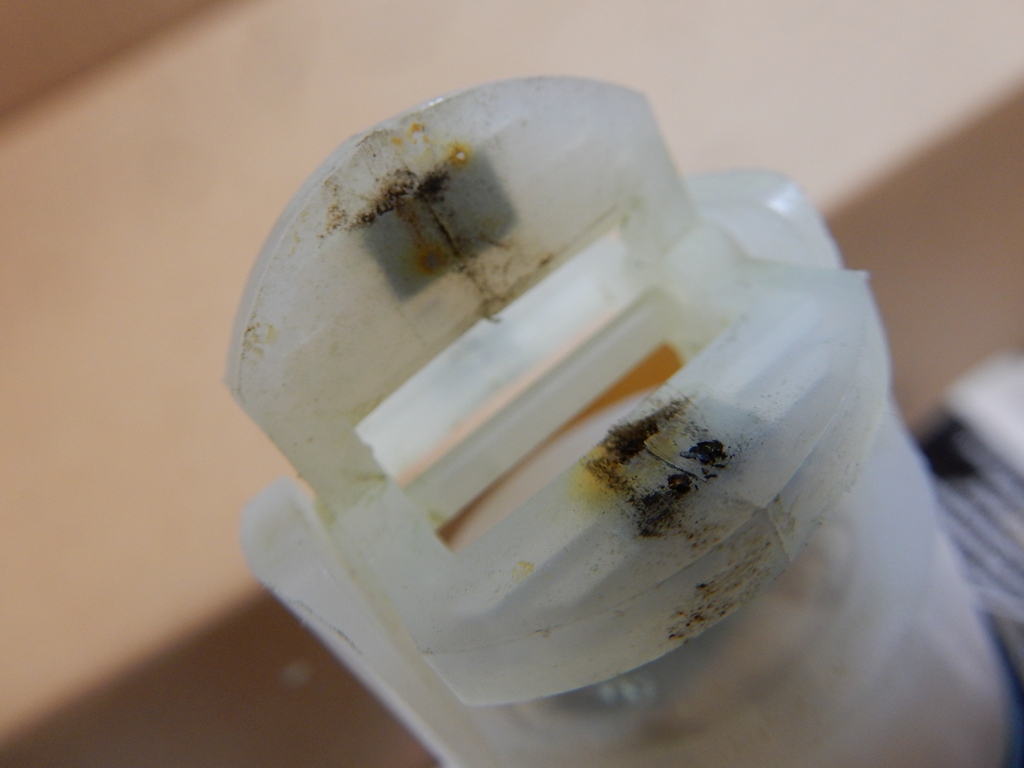
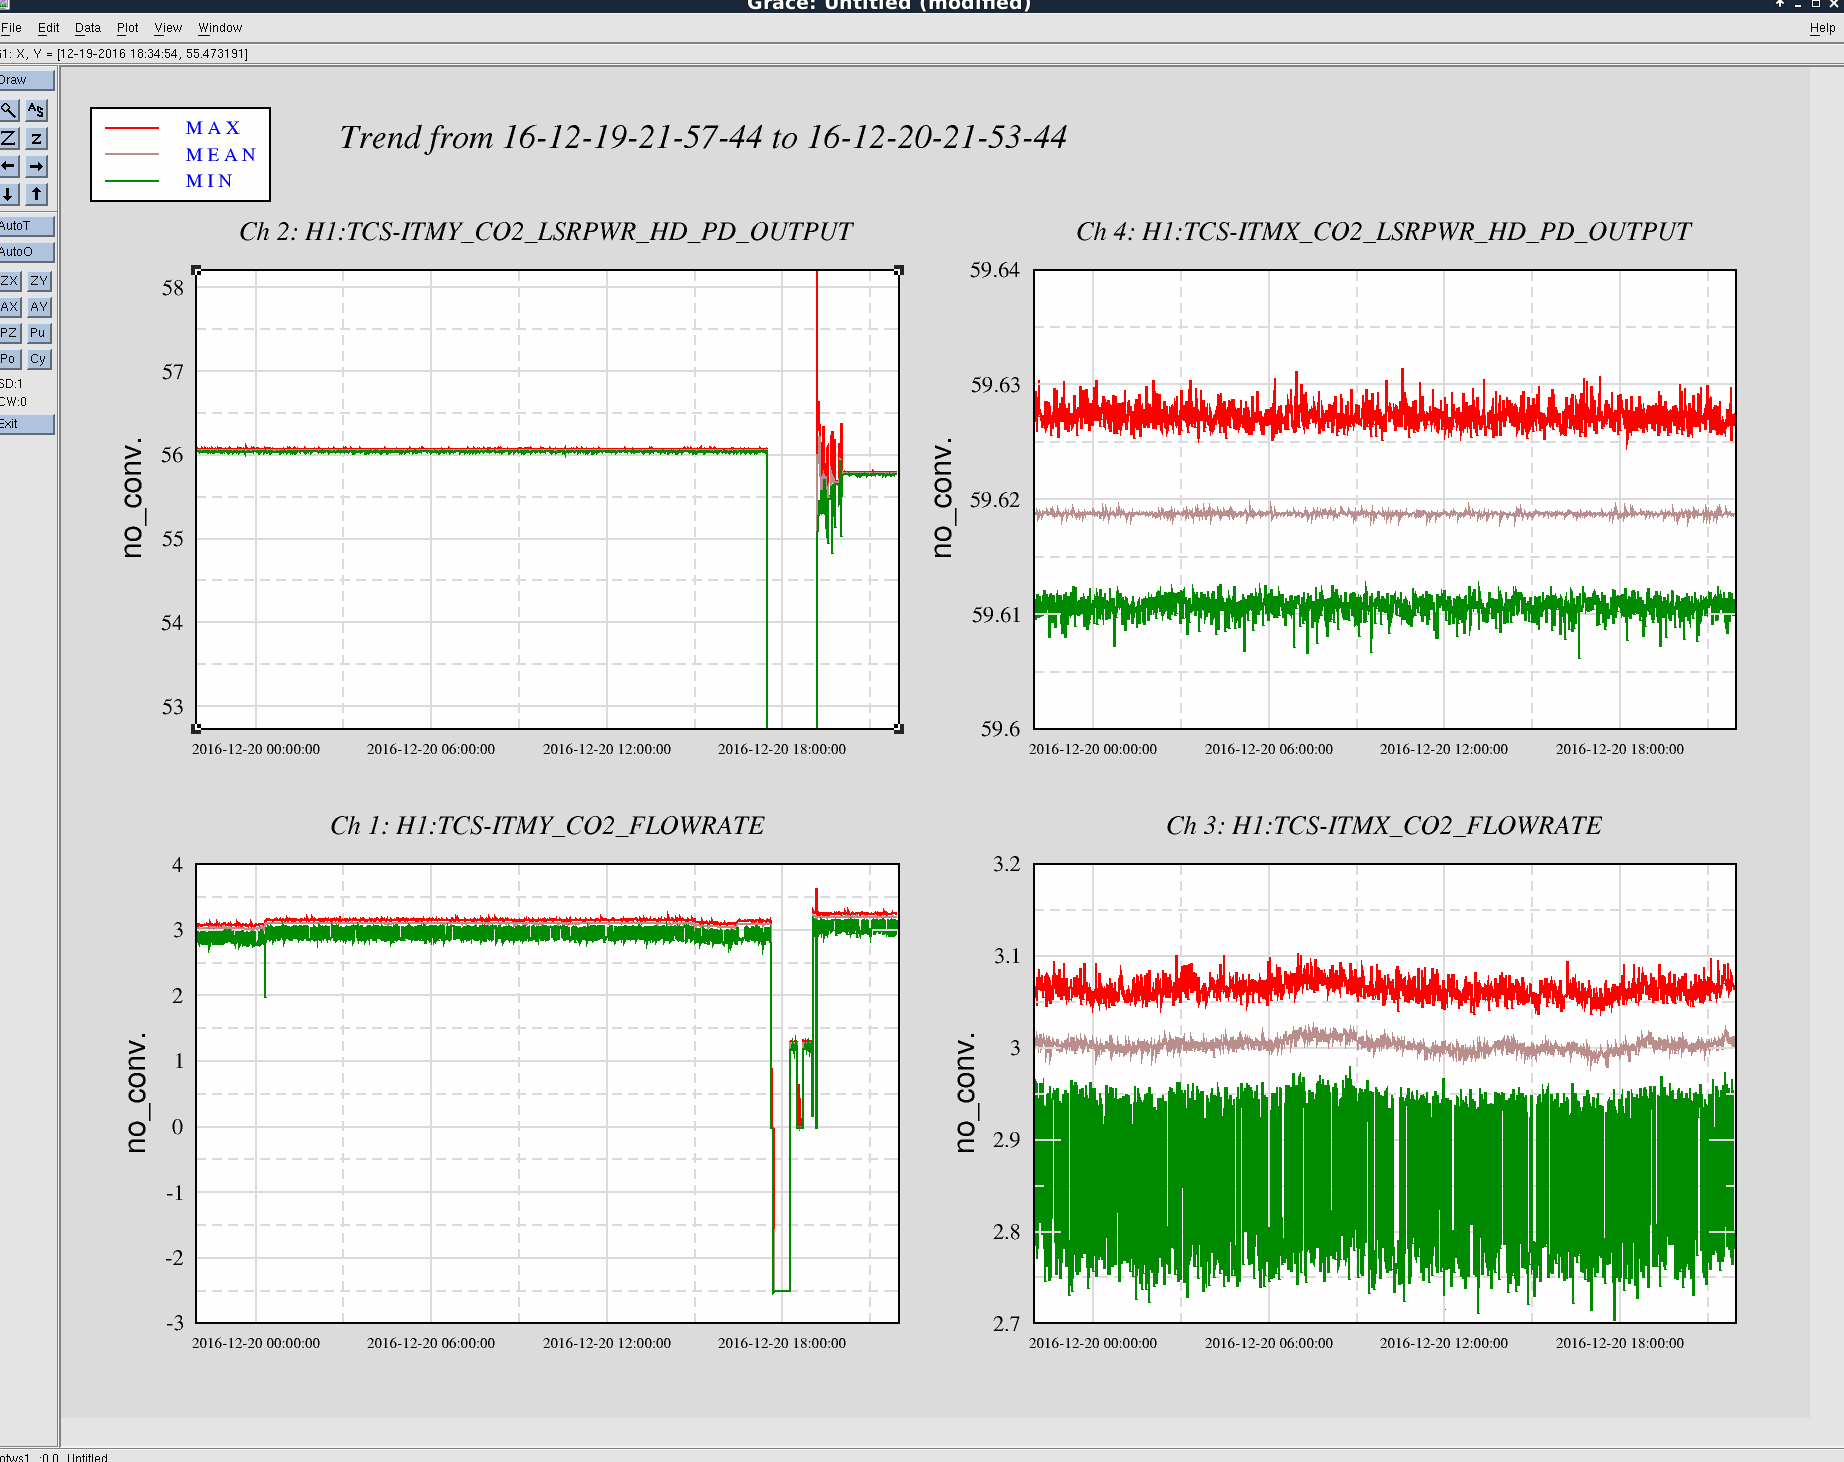
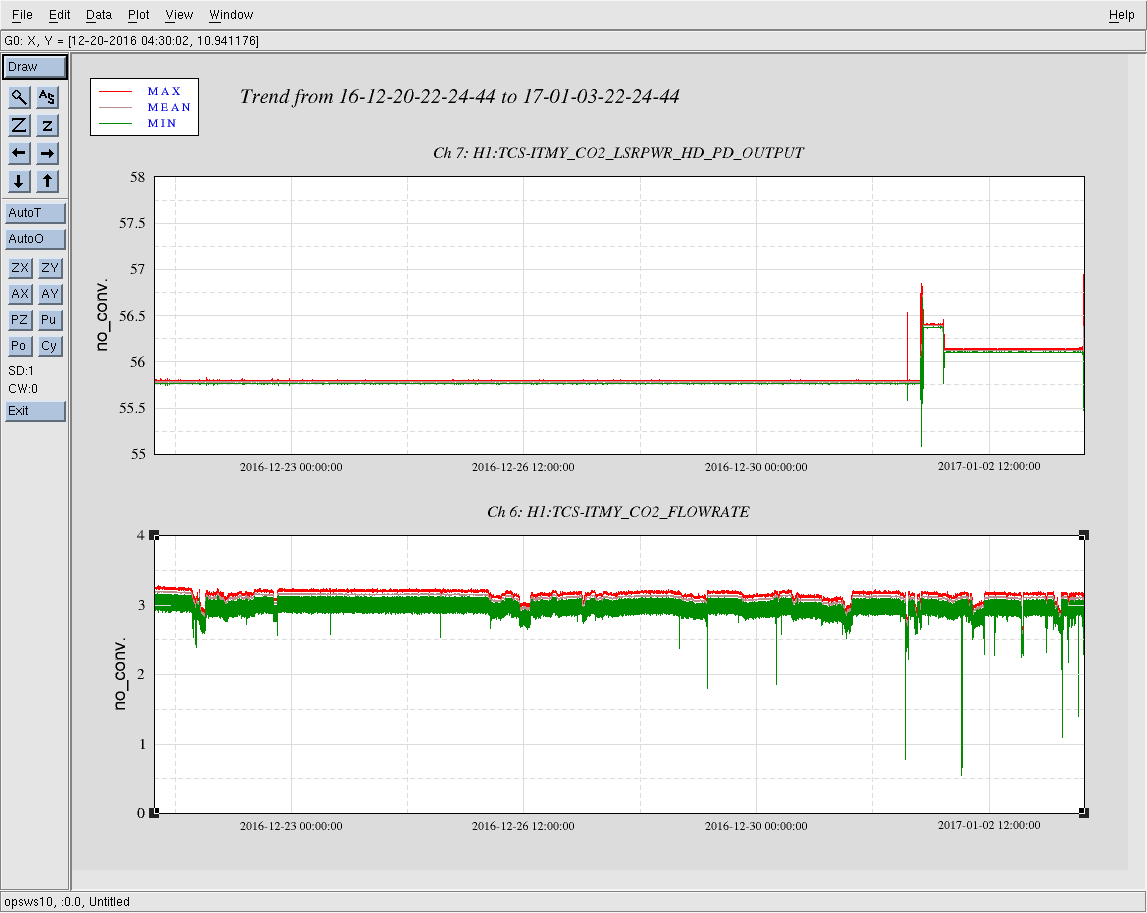
- 20:13 TCSy Chiller Flow Is Low Verbal Alarm (Jason notified)
-
22:05 7.2 EQ in Fiji hits us---->Observatory Mode: EARTHQUAKE
- Charge Measurement (Kissel)
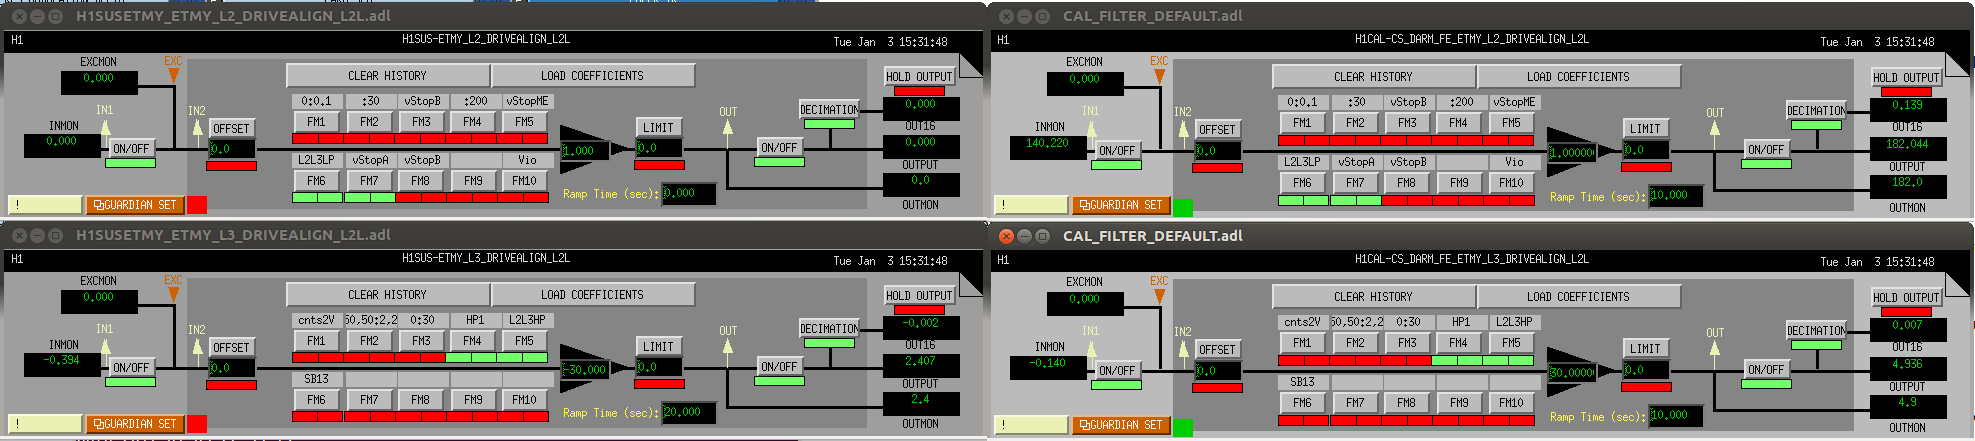
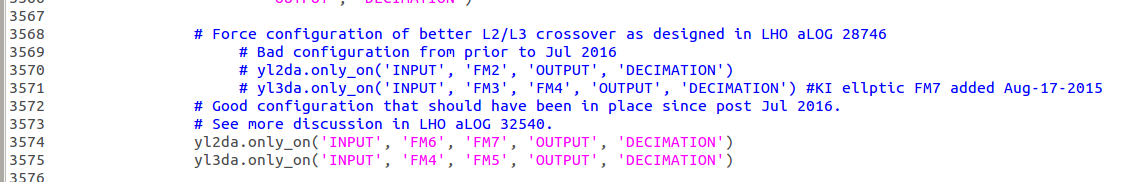
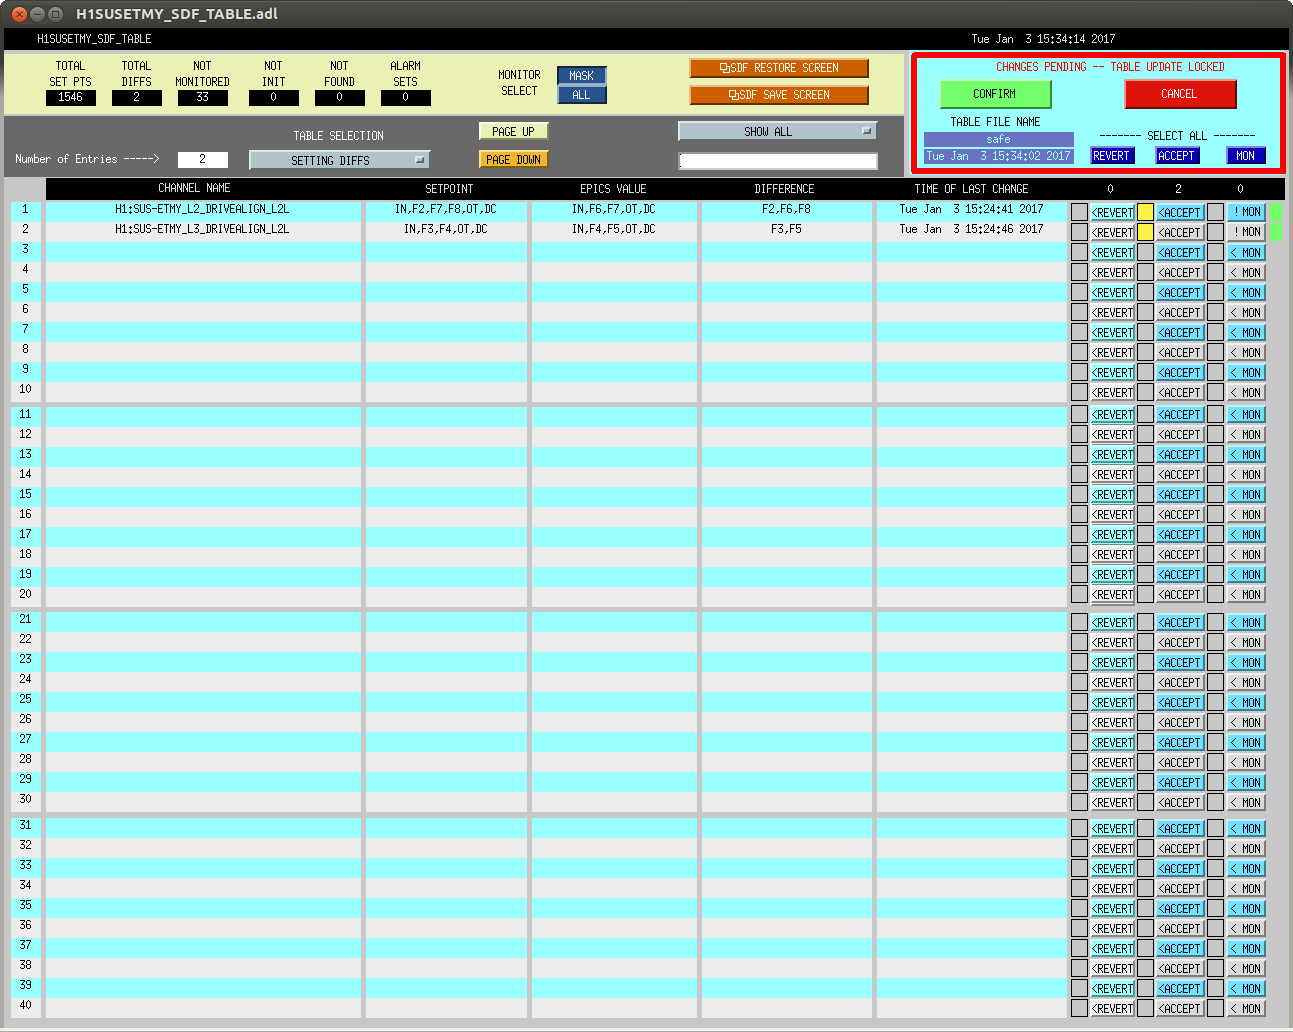
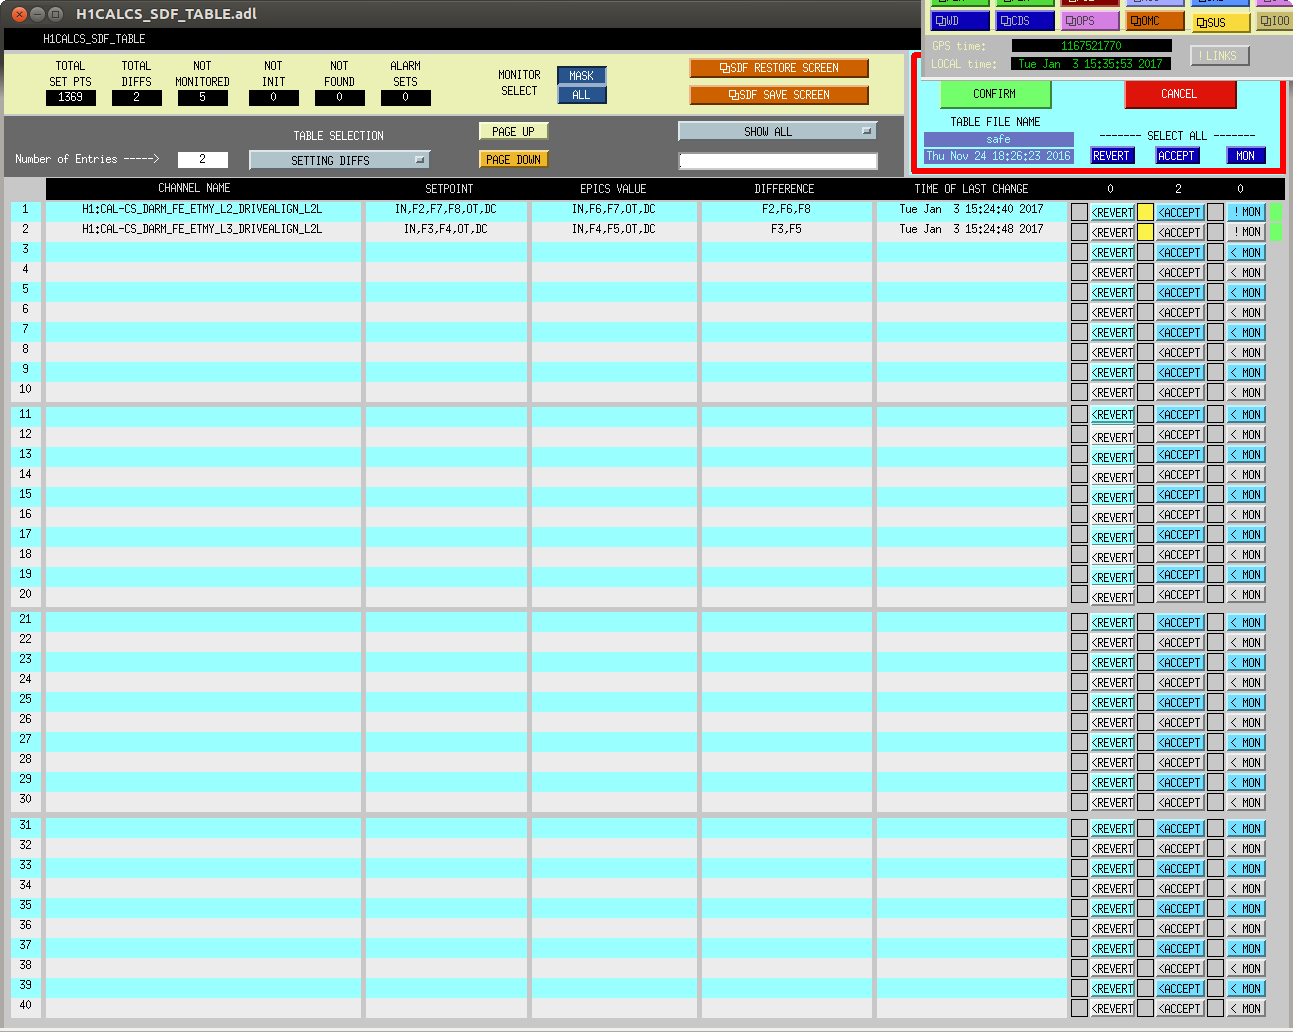
- PUM work (Kissel)
- 22:45 LVEA Swept (Jim)
- 23:50 EY Temp High alarm
- Toward end of shift, went for relocking & handing Ed a locked DRMI
Restoring From Holiday Log Notes:
- LVEA Temperature checked & OK (Kissel)
- PSL Shutter opened (Corey)
- ISIs restored individually (Kissel)
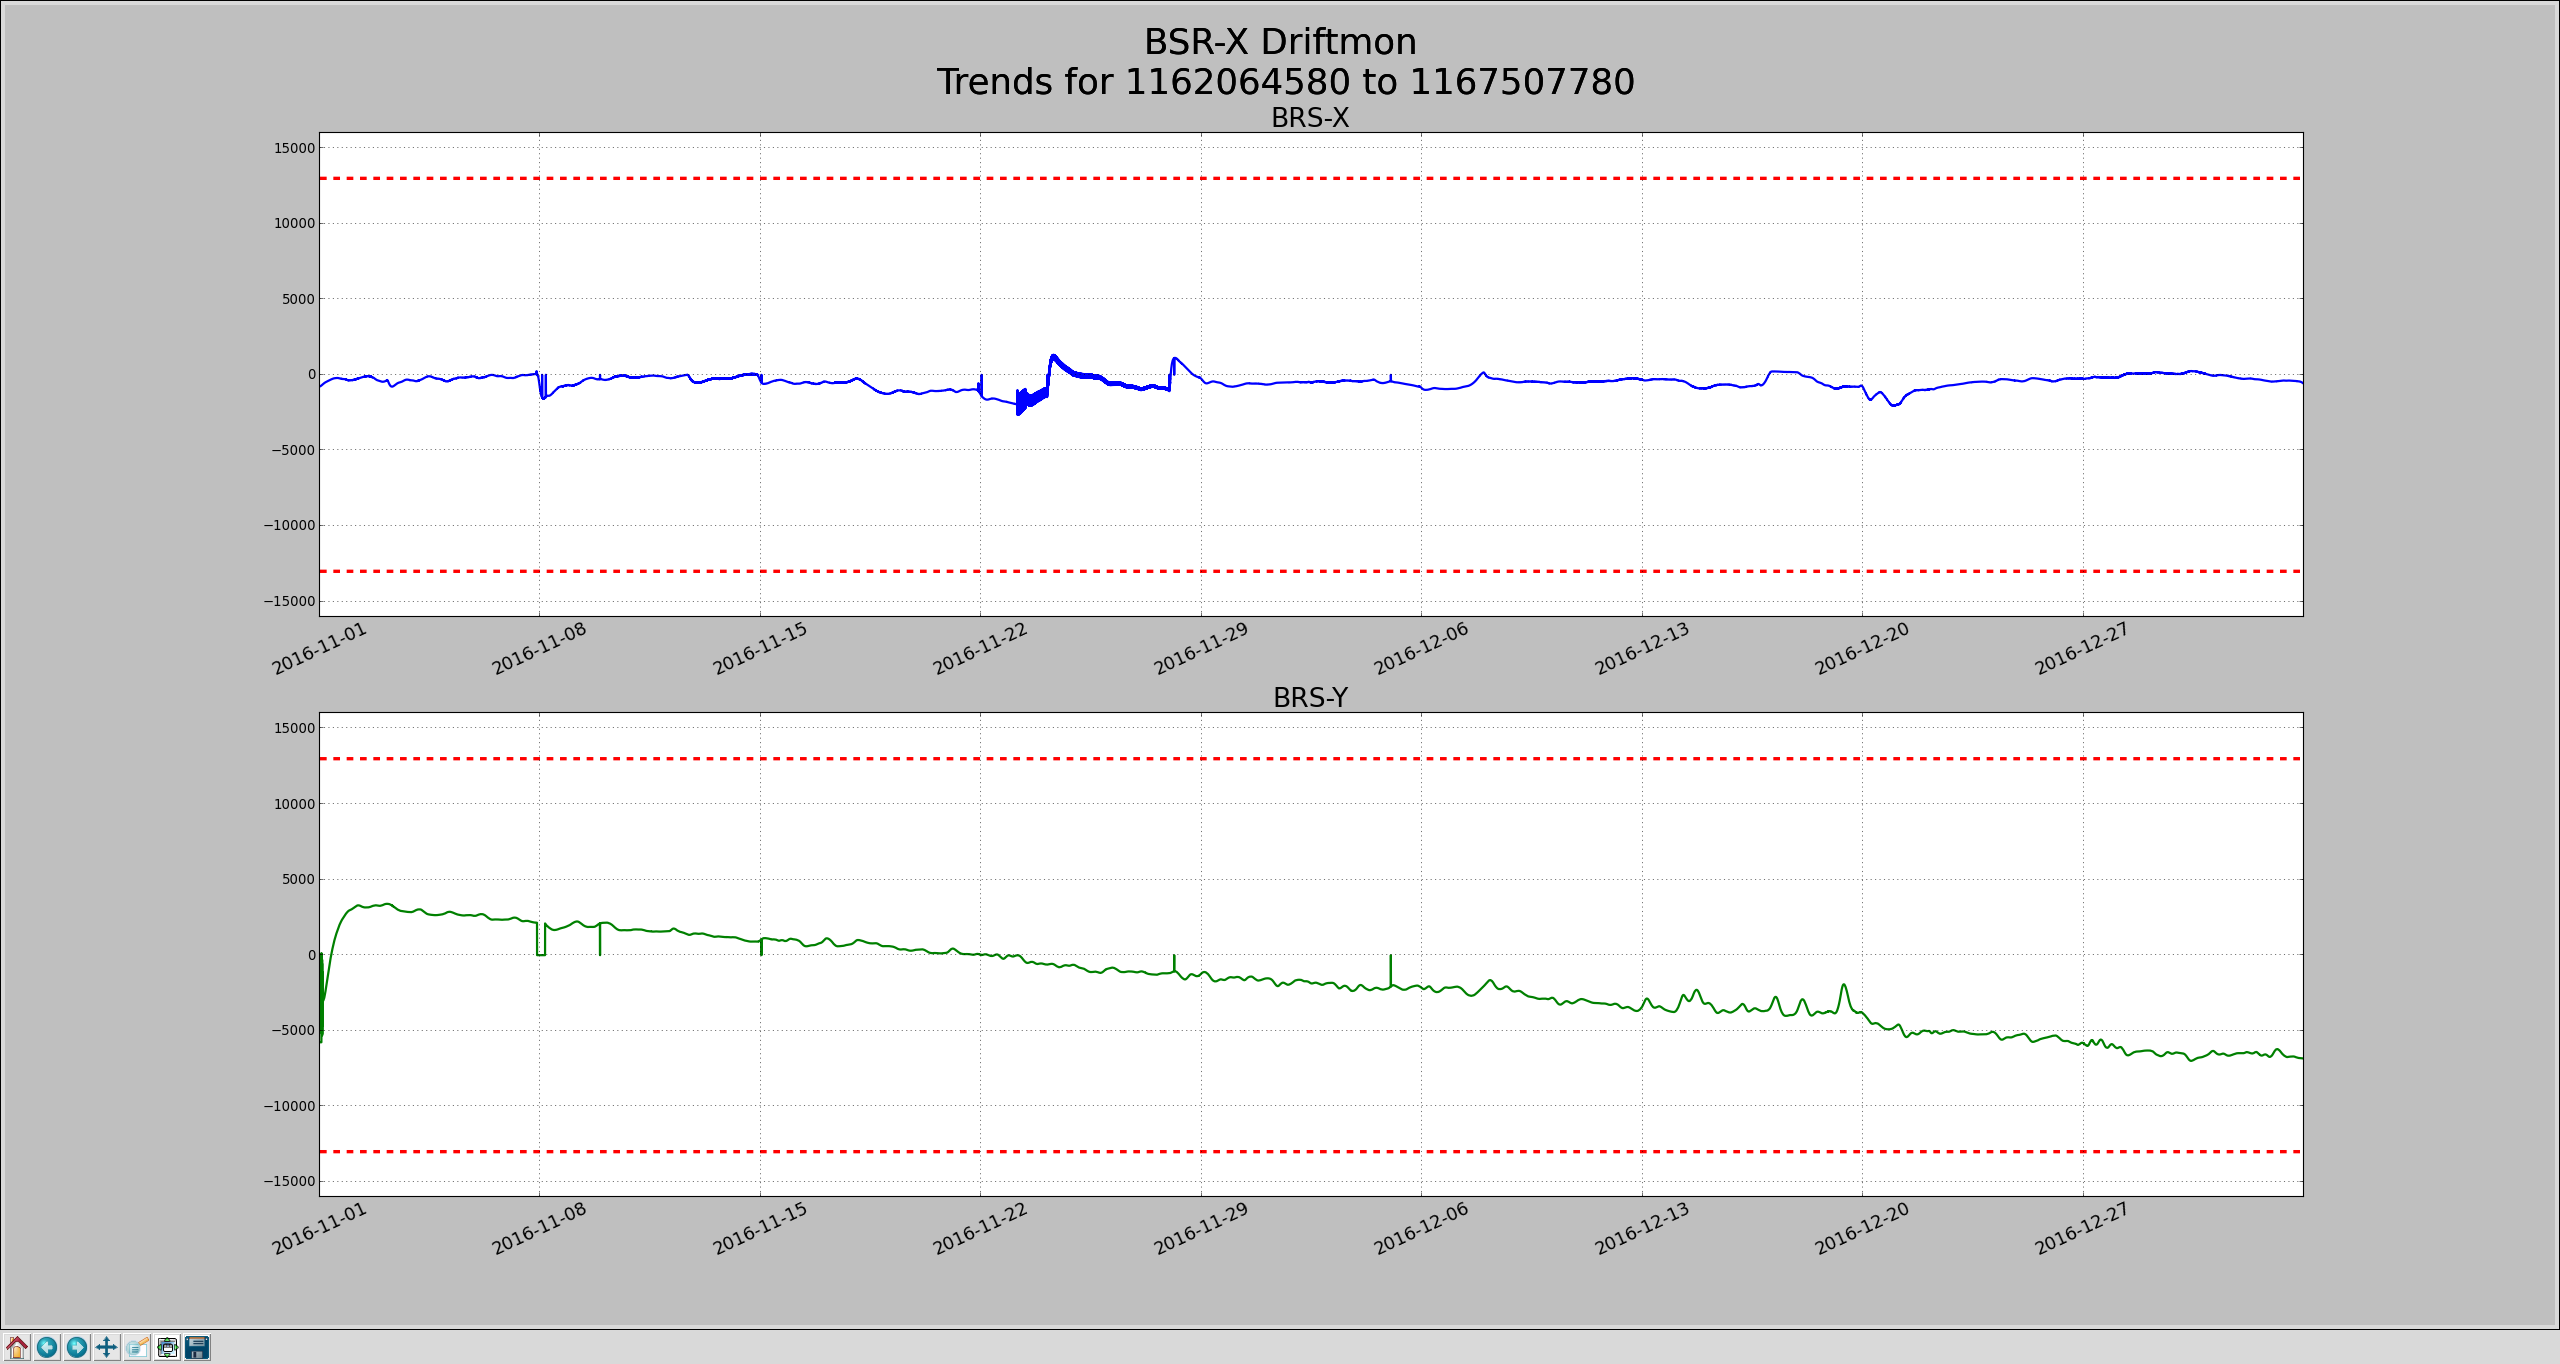
- BRSx has damping OFF (Kissel)
- SEI_CONFIG taken to WINDY (Kissel)
- TCS Ring Heater powers have no change over last 20days (Corey)
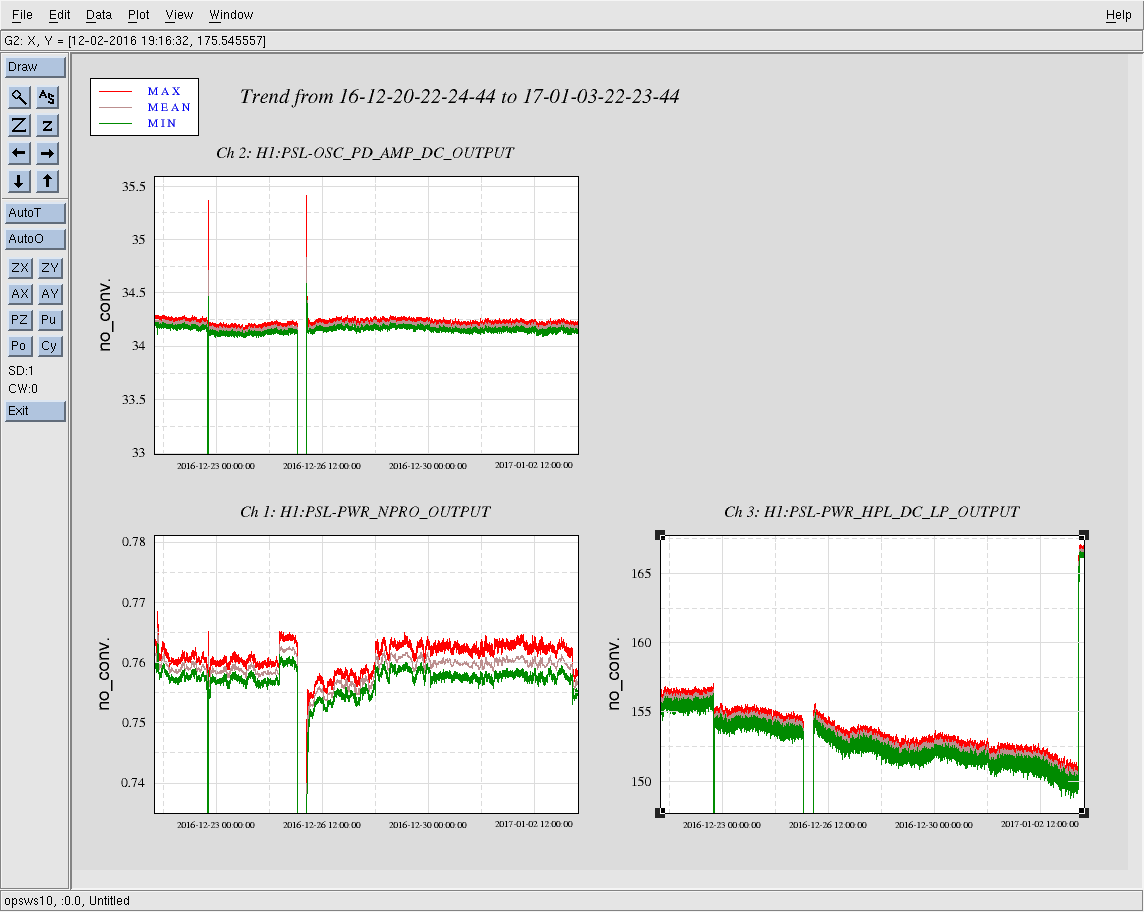
- PSL Chillers OK (Corey & Jason)
- PSL being checked (Jason)
-
Initial Alignment Notes
- 19:15- 20:56 alignment
- TMSx moves were needed to lock up ALSx
- Beatnote was at -30! But Keita asked if we opened the ALS Pipe (I had only opened the PSL pipe! Went out to open the ALS pipe.)
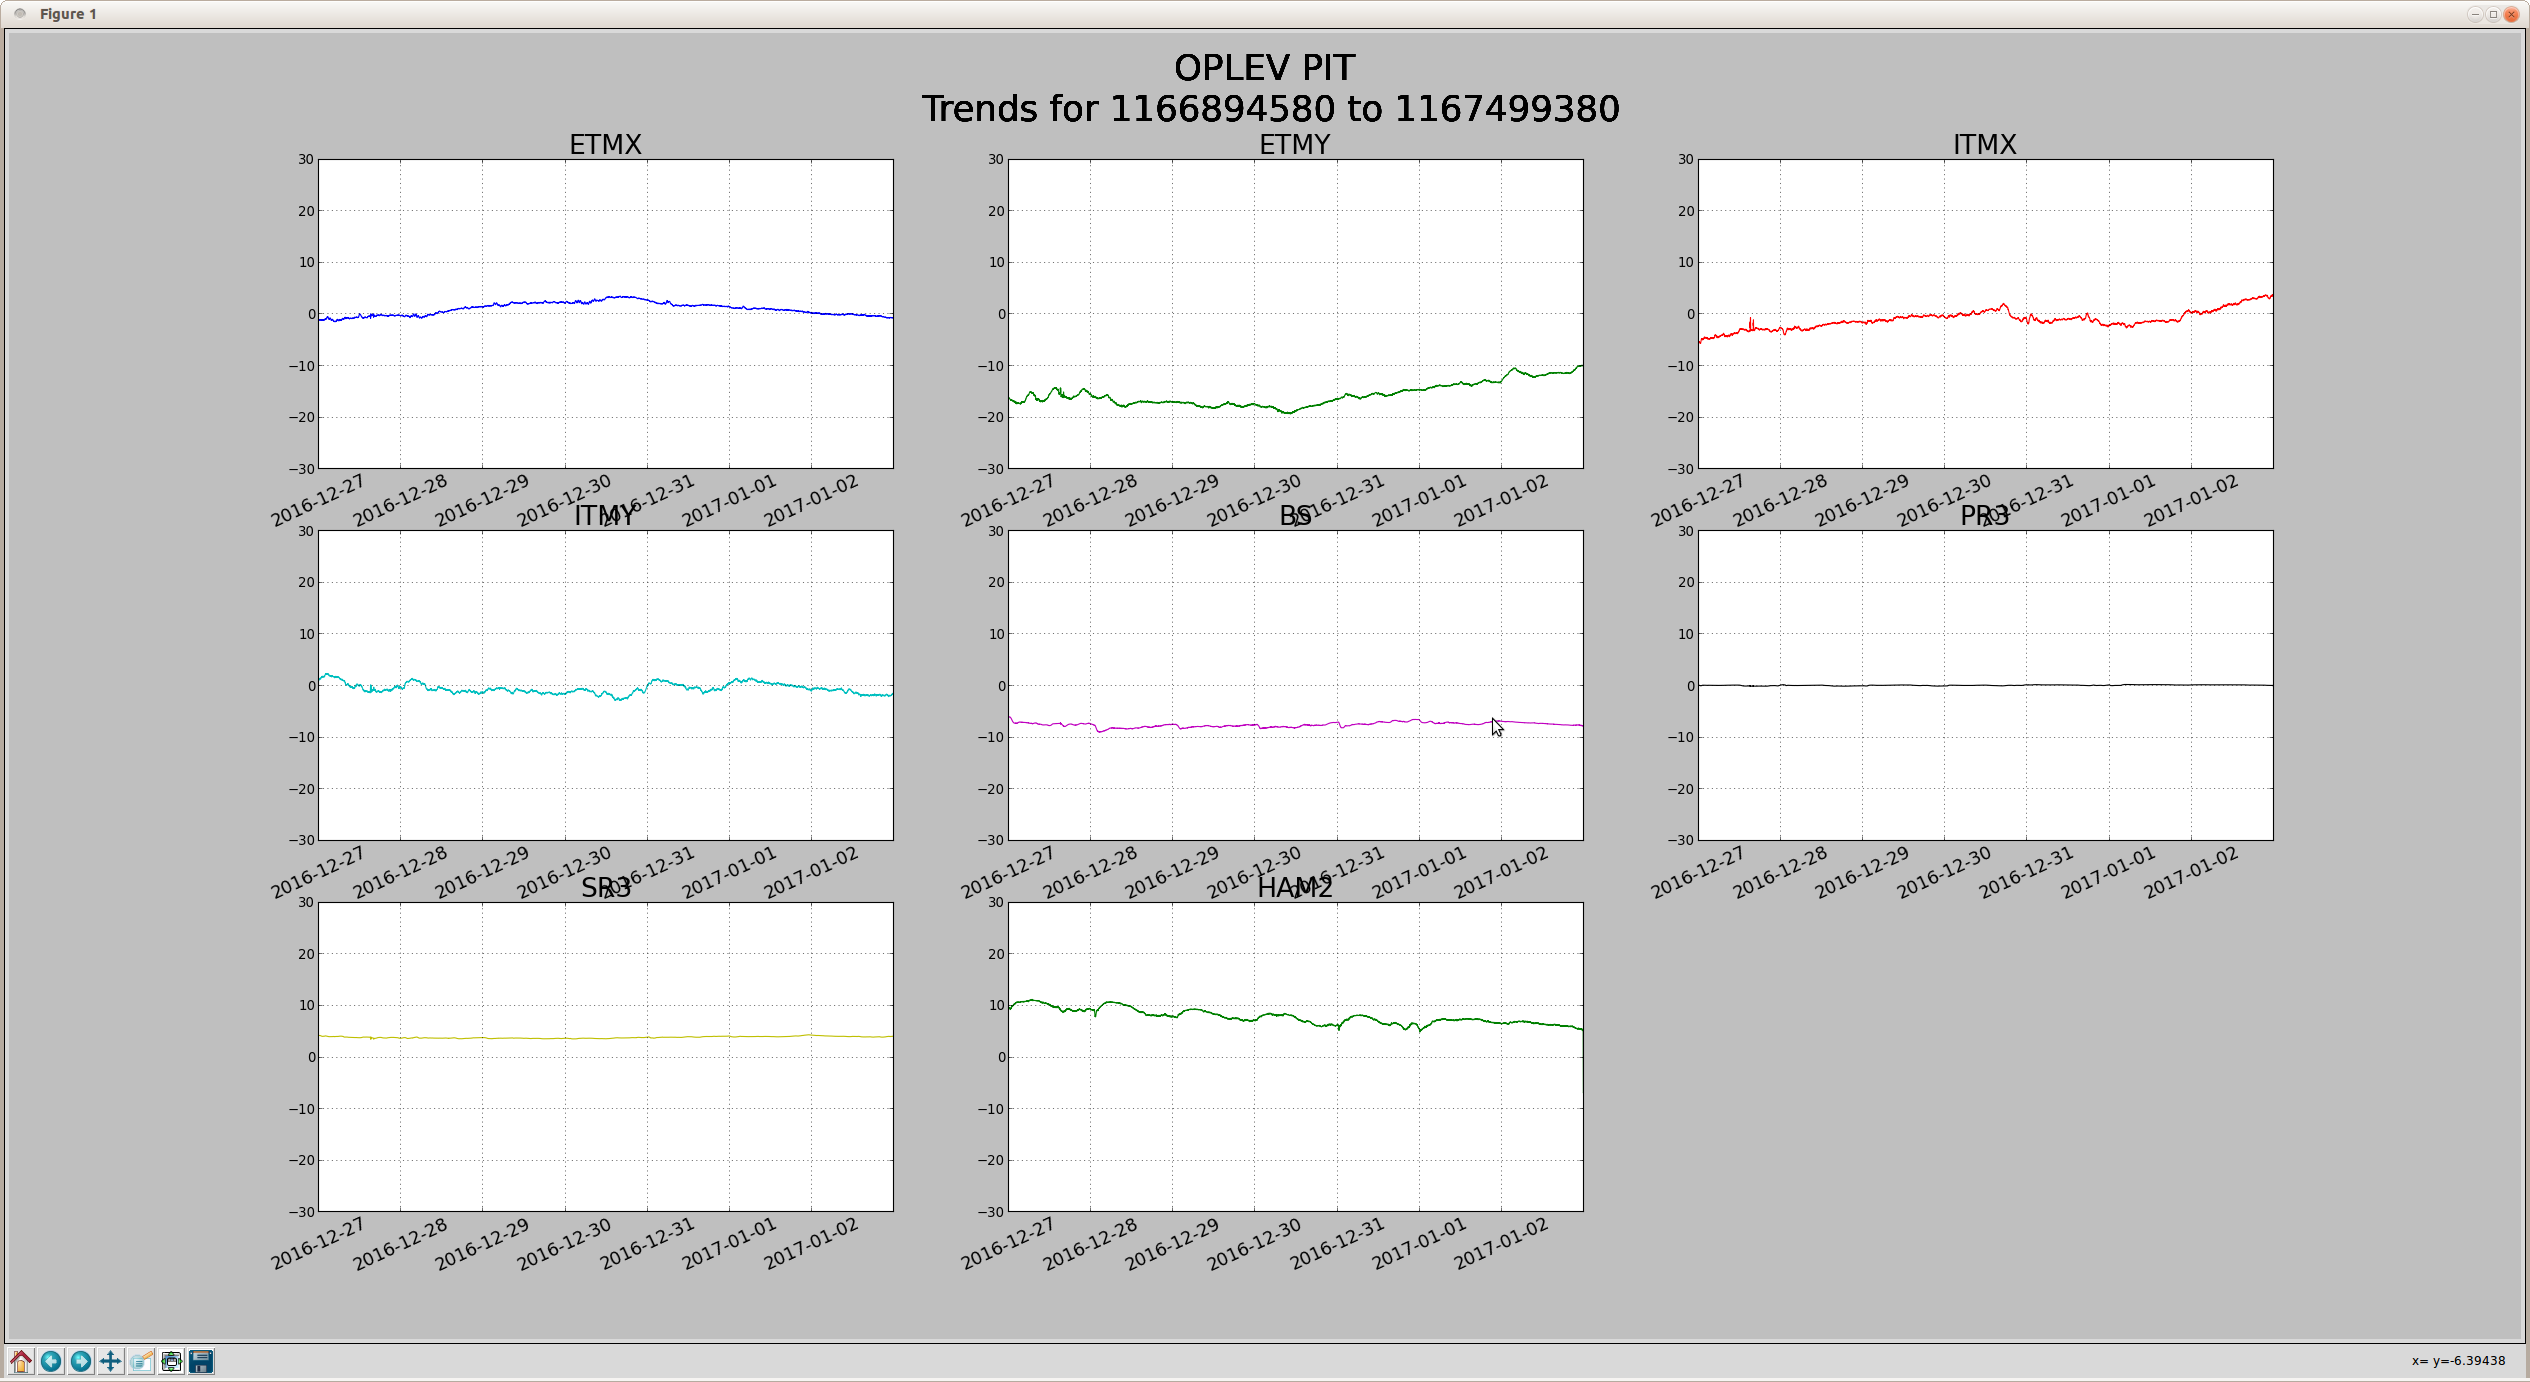
- BS was way off for the Michelson, but took to DOWN & tweaked BS in positive pitch until it looked good. Then took to MICH_DARK_LOCKED & proceeded normally.
- Dark Offset script run (Jenne)
- PSL Rotation Stage calibrated via script (Jenne)
- Had ALS troubles due to some settings (ESD ETMx) which remained from Jeff's charge measurement attempt earlier.