alexan.staley@LIGO.ORG - posted 00:49, Tuesday 25 November 2014 - last comment - 07:04, Tuesday 25 November 2014(15272)
ALS COMM HANDOFF to TRX+TRY
Stefan, Matt, Kiwamu, Evan, Alexa
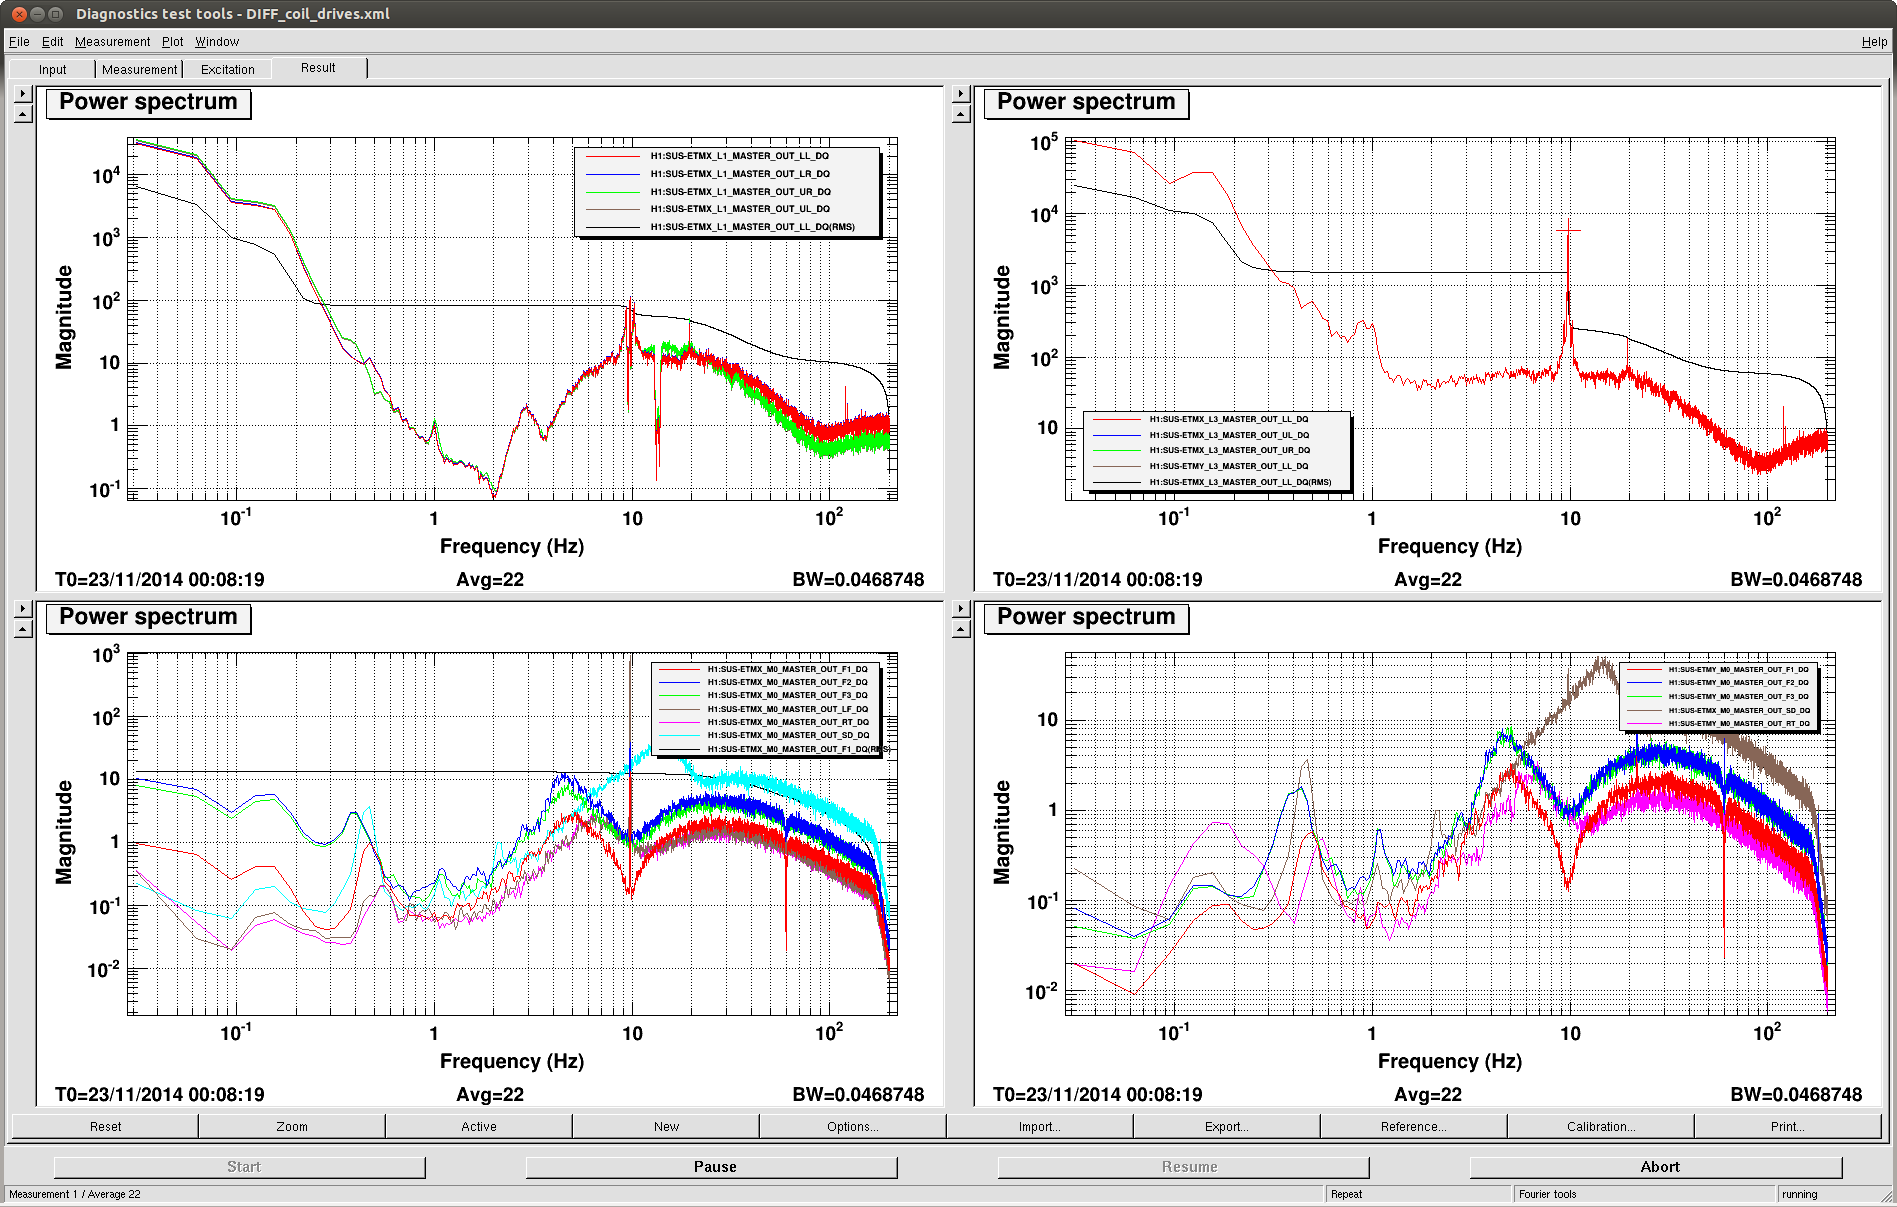
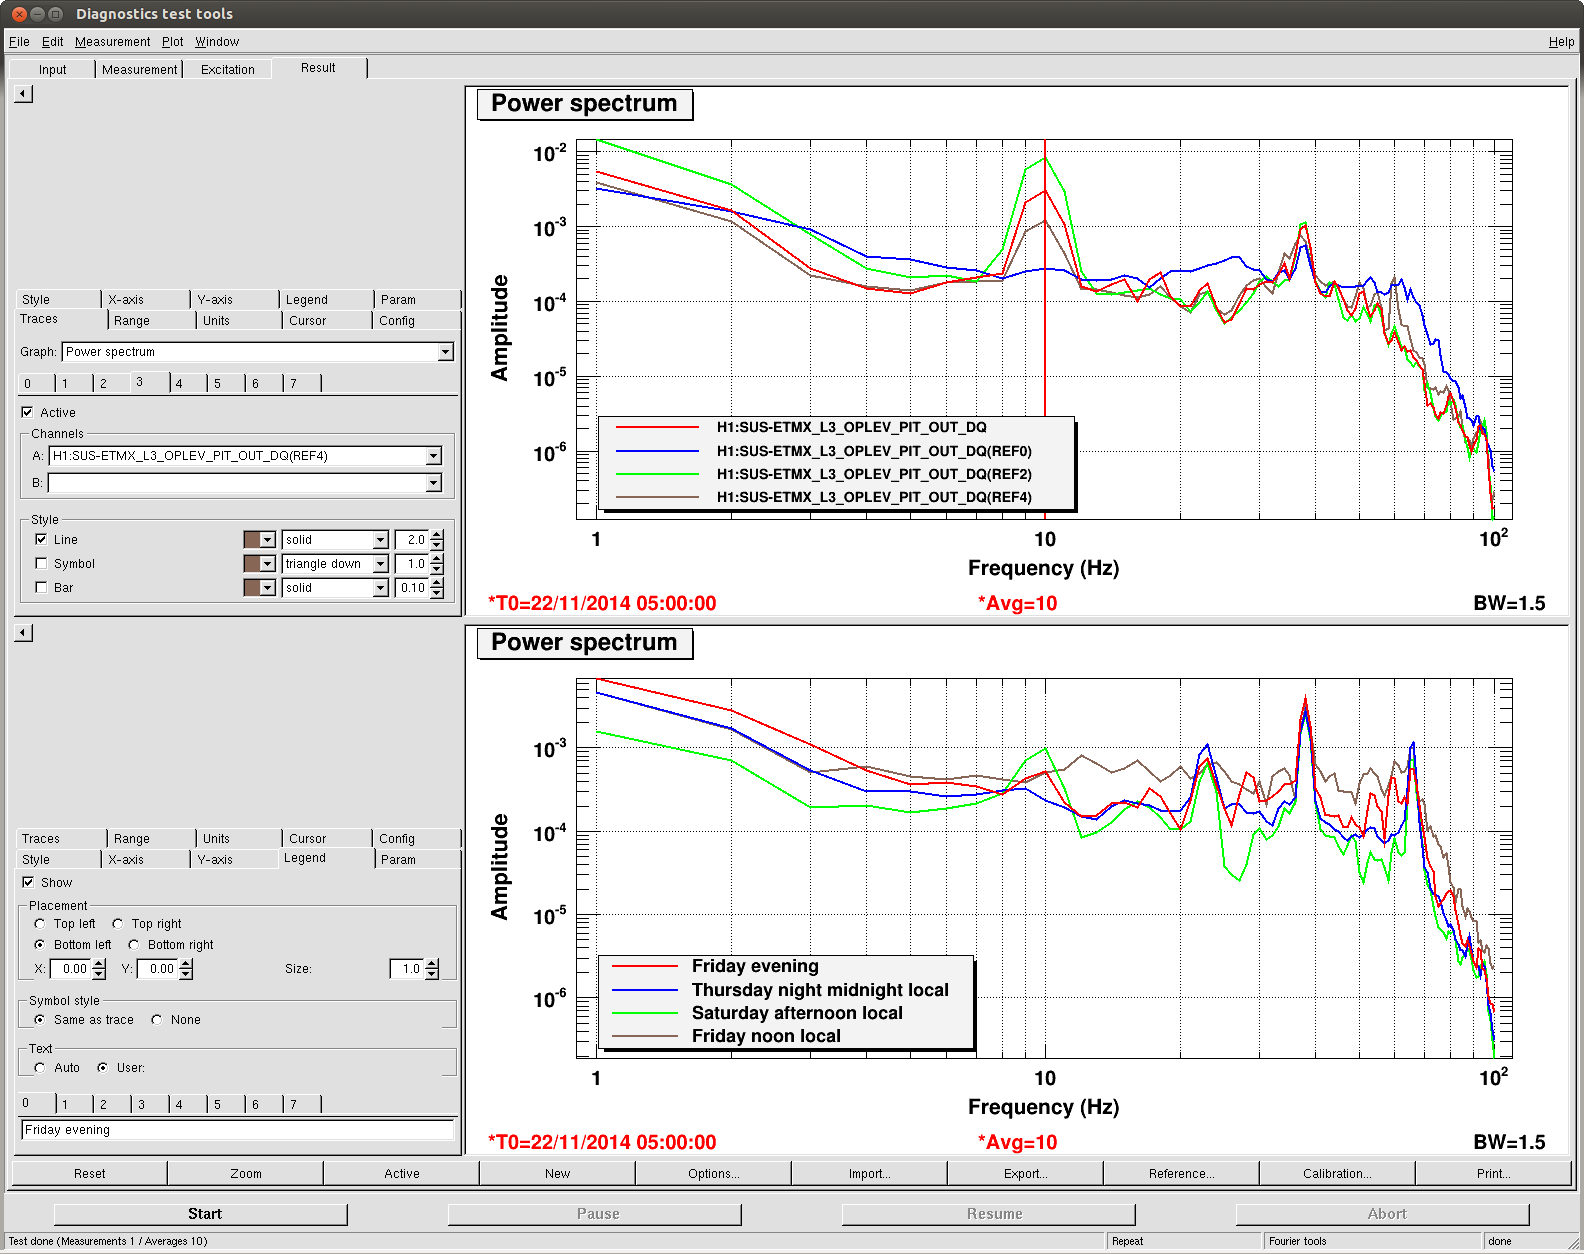
- ALS DIFF and COMM are working great tonight with the ETMX L2P changes with the oplev running (see Stefan's alog)
- We lock DRMI+arms off resonance much faster if we bring the input power down to 4W, at which point we can easily transition back to 10W without breaking the lock. This is all implemented in guardian now.
- Kiwamu changed the gain of POP18 whitening gain by a factor of 4 because the ADC was saturating
- We added the SRCL mode hopping offset for DRMI+arms off resonance until the asc wfs kick in (the asc wfs turn on faster than before thanks to Dan's modifications, but still should be faster). We also made an edit to the asc wfs loops (see Matt's alog).
- We adjusted the REFLBIAS digital filters to reduce the amount of confusion -- we were compensating and un-compenstating for the same zero/poles with FM3, FM4. Now we just use FM6 (p1.6z40) to compensate for the Boost engaged in the COMM PLL Board to CM Board Path
- Since sqrt(TRX+TRY) goes as 1/f^2 we added a f shaped filter (FM9: z35:p1k) to match the 1/f shape of the ALS COMM loop shape
- The "right side of the river" for bringing the arm off resoance: set frequency offset should be -1000 Hz on the ALS COMM VCO. This has been updated in the guardian
- The ALS COMM FIND IR takes too long; especially the fine tune portion.
-
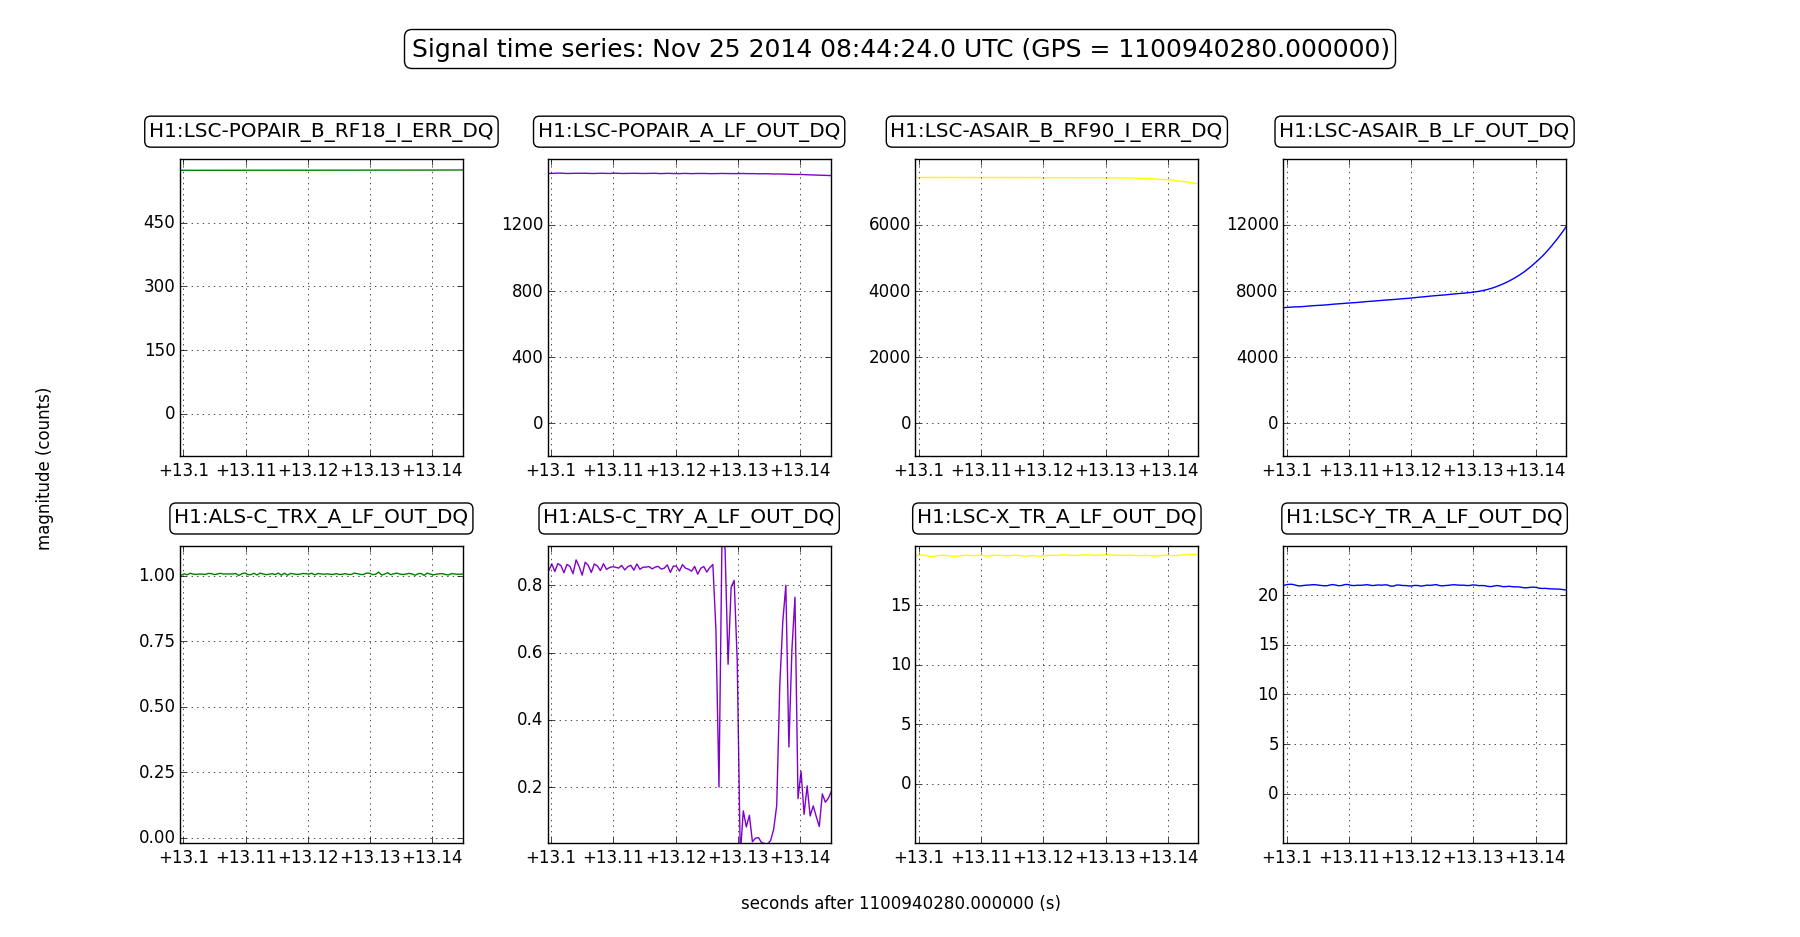
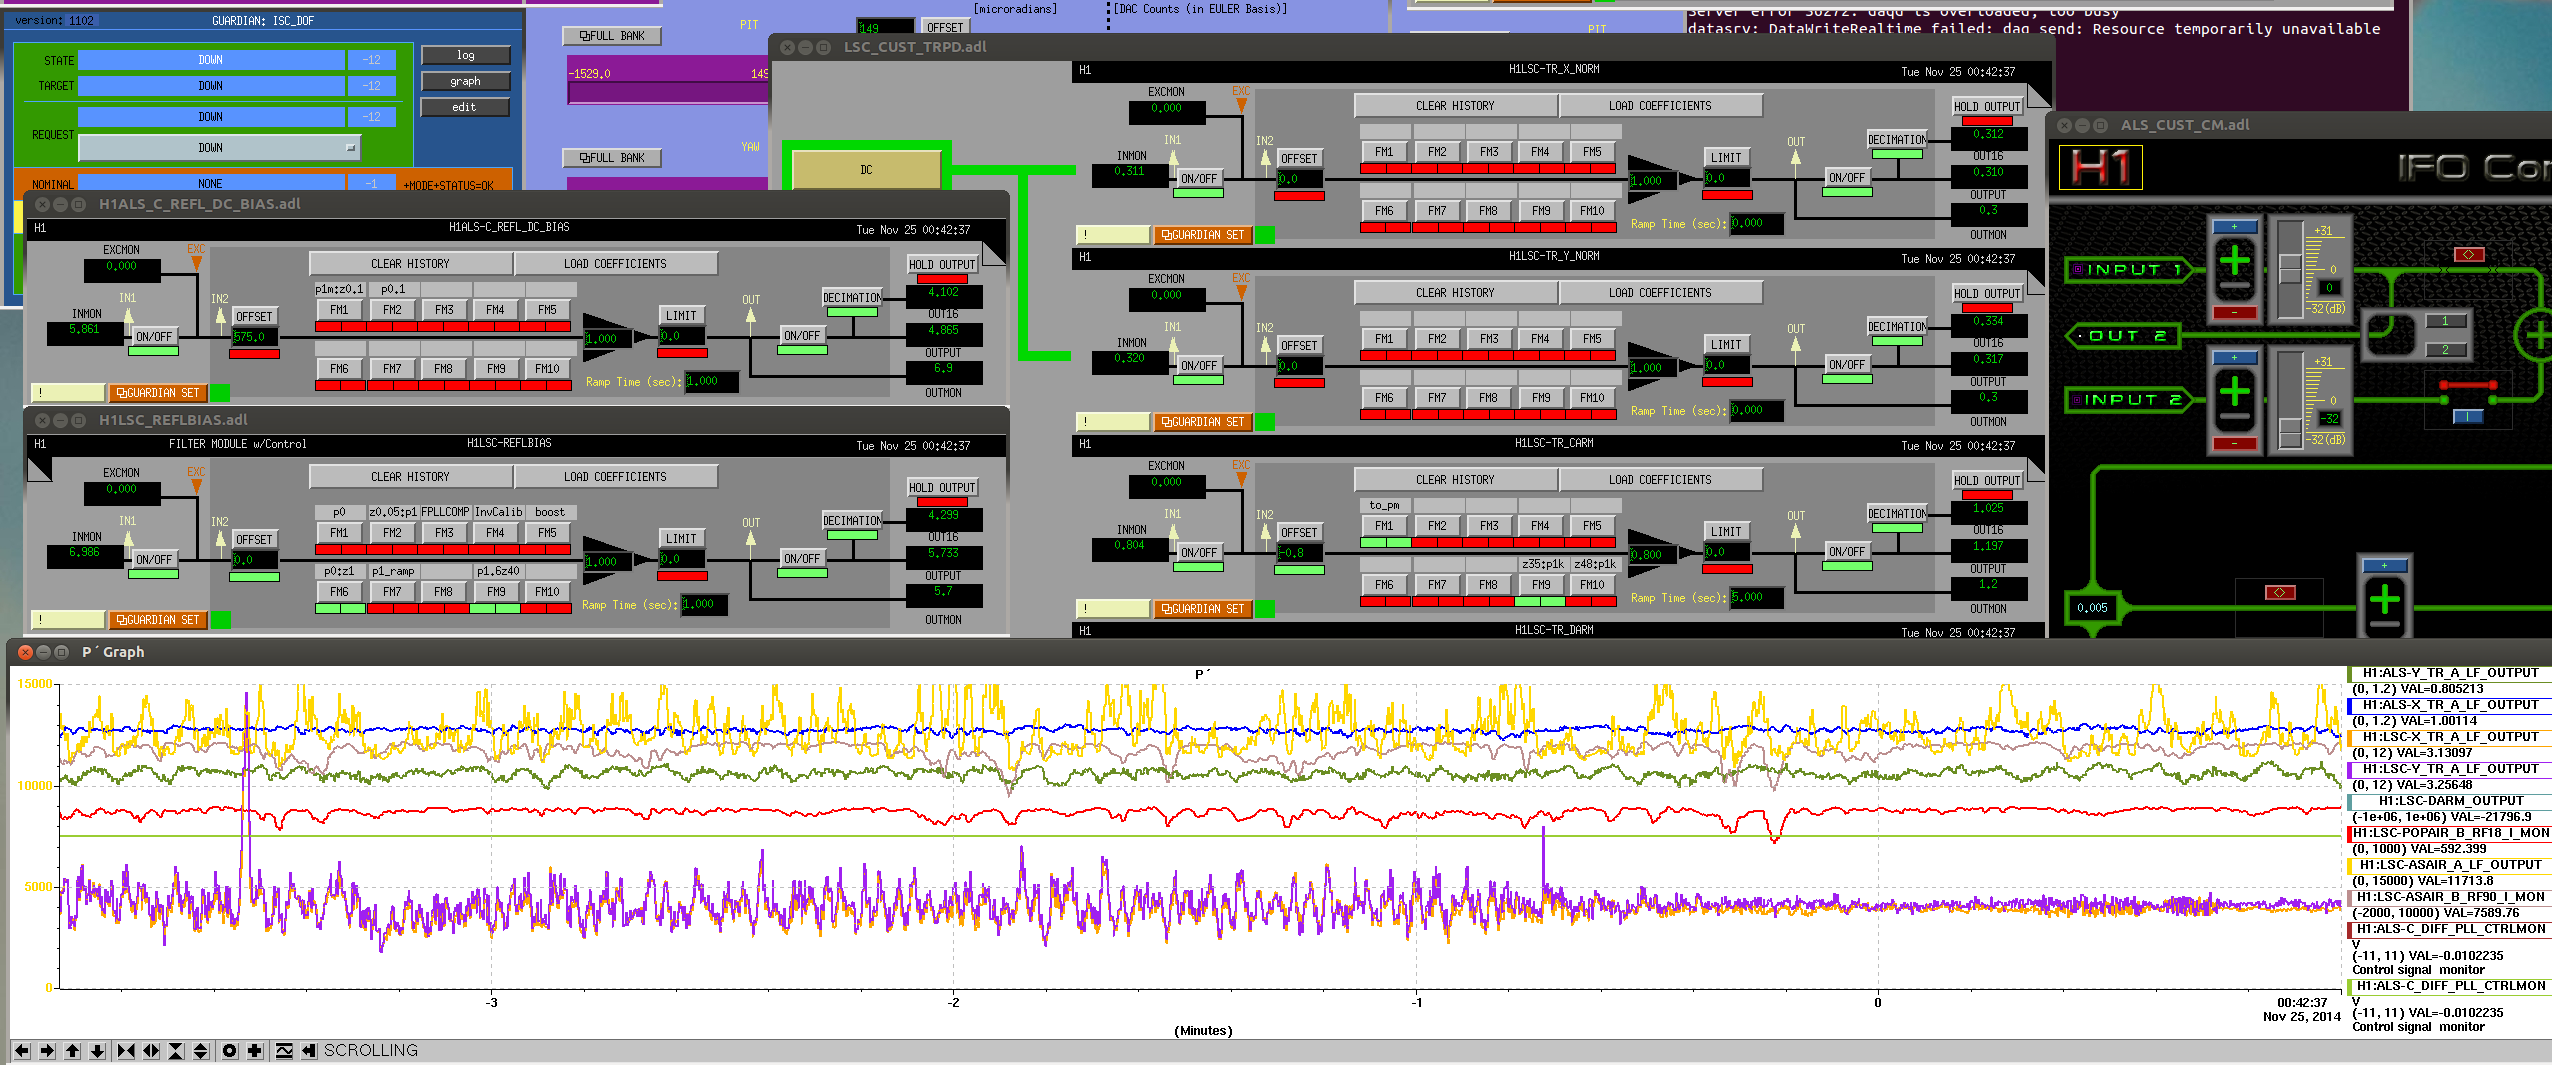
We have transitioned to sqrt(TRX+TRY): With an ALS COMM offset of -150 Hz (green), we engaged REFLBIAS in the first input of CM board. I have attached a StripTool screen shot showing these loops locked; one can clearly see the noise reduction in the IR transmitted signal once we handoff. Some configuration stuff:
- LSC-TR_CARM_OFFSET = -0.8
- LSC-TR_CARM FM1 (to pm) and FM9 (z35:p1k) are ON
- LSC_REFLBIAS FM6 (p0:z1),, FM9 (p1.6:z40) are ON
- LSC_REFLBIAS gain 0.8
- LSC-REFL_DC_BIAS gain 1
- CM Inp1 0dB, CM Inp2 -4dB
- We engage REFLBIAS gain first, then turn on FM6. Then we reduce CM INp2 down to -32 dB slowly and then turn off the input.
- We use an ezca servo to adjust the ALS COMM PLL VCO offset so that we don't battle with the REFLBIAS input into the CM board.
- This is all implemented in guardian CARM_ON_TR except for the CM inp2 ramp down.
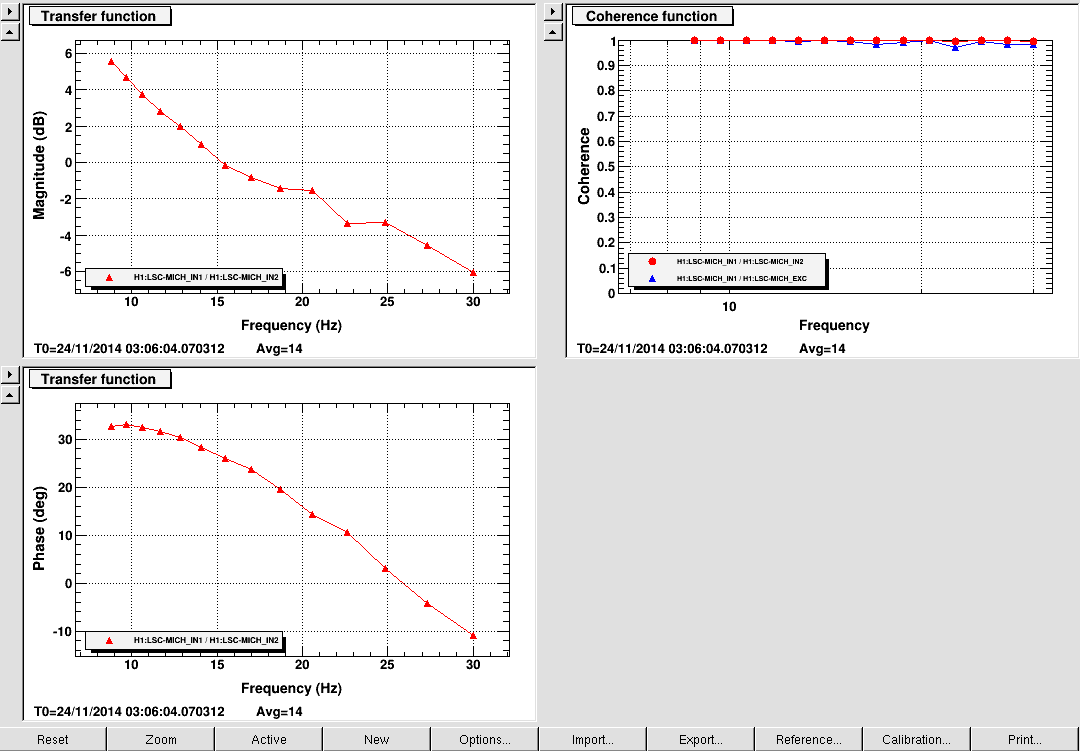
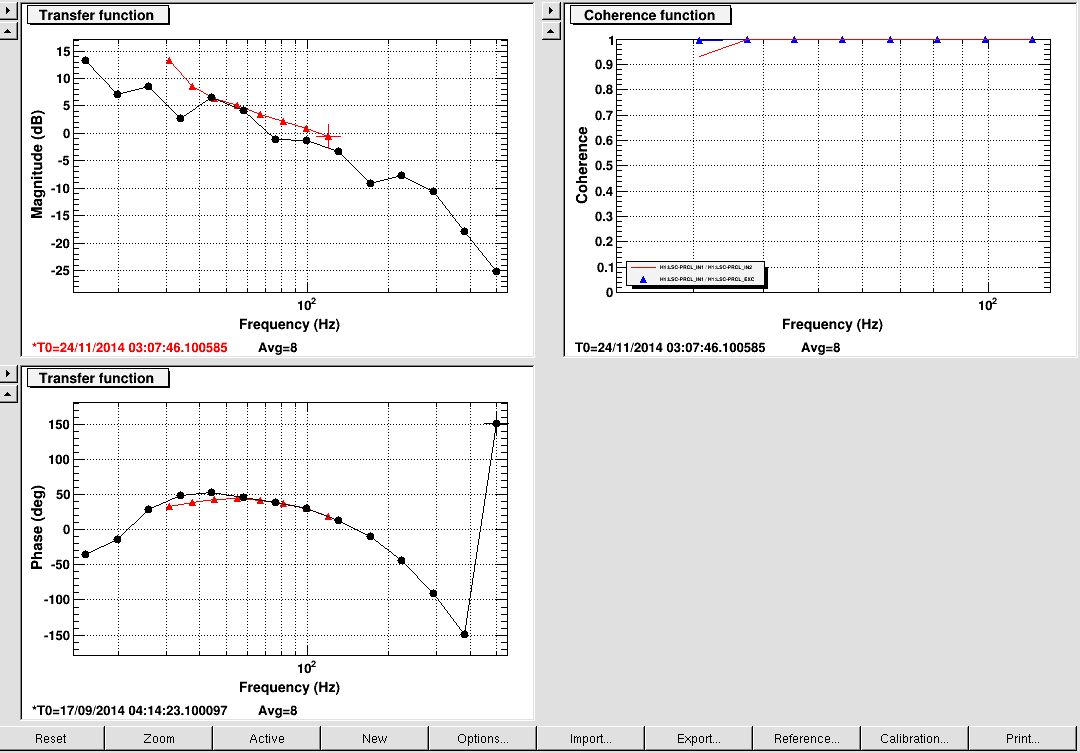
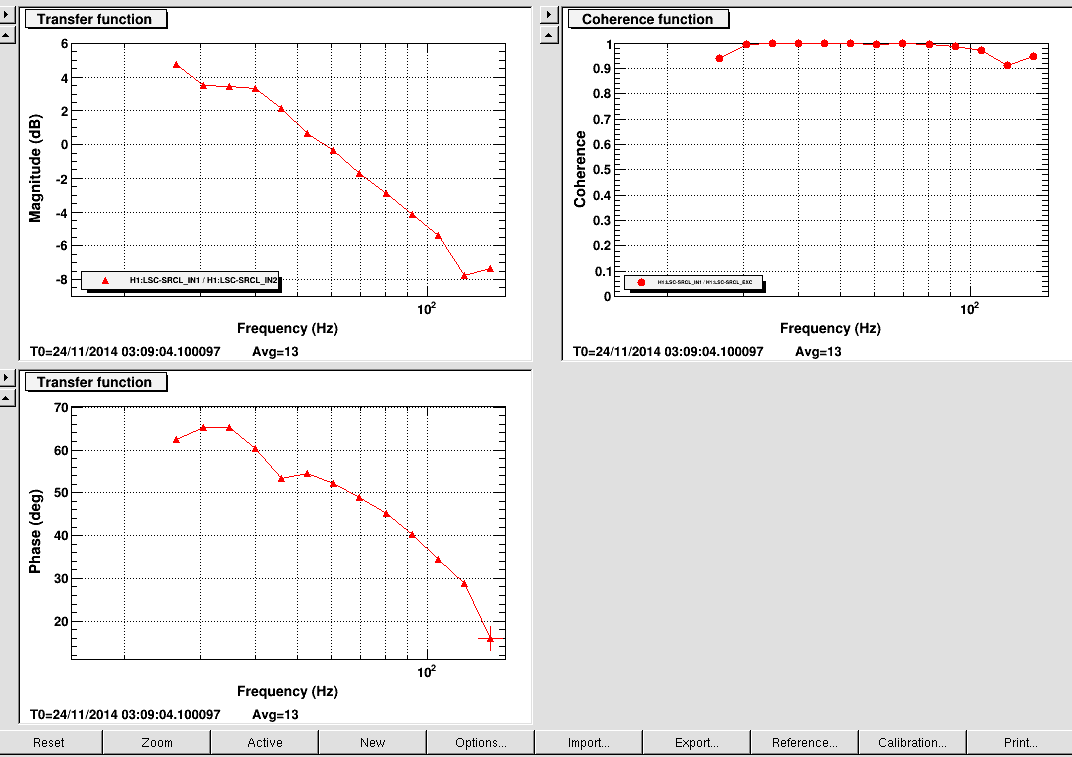
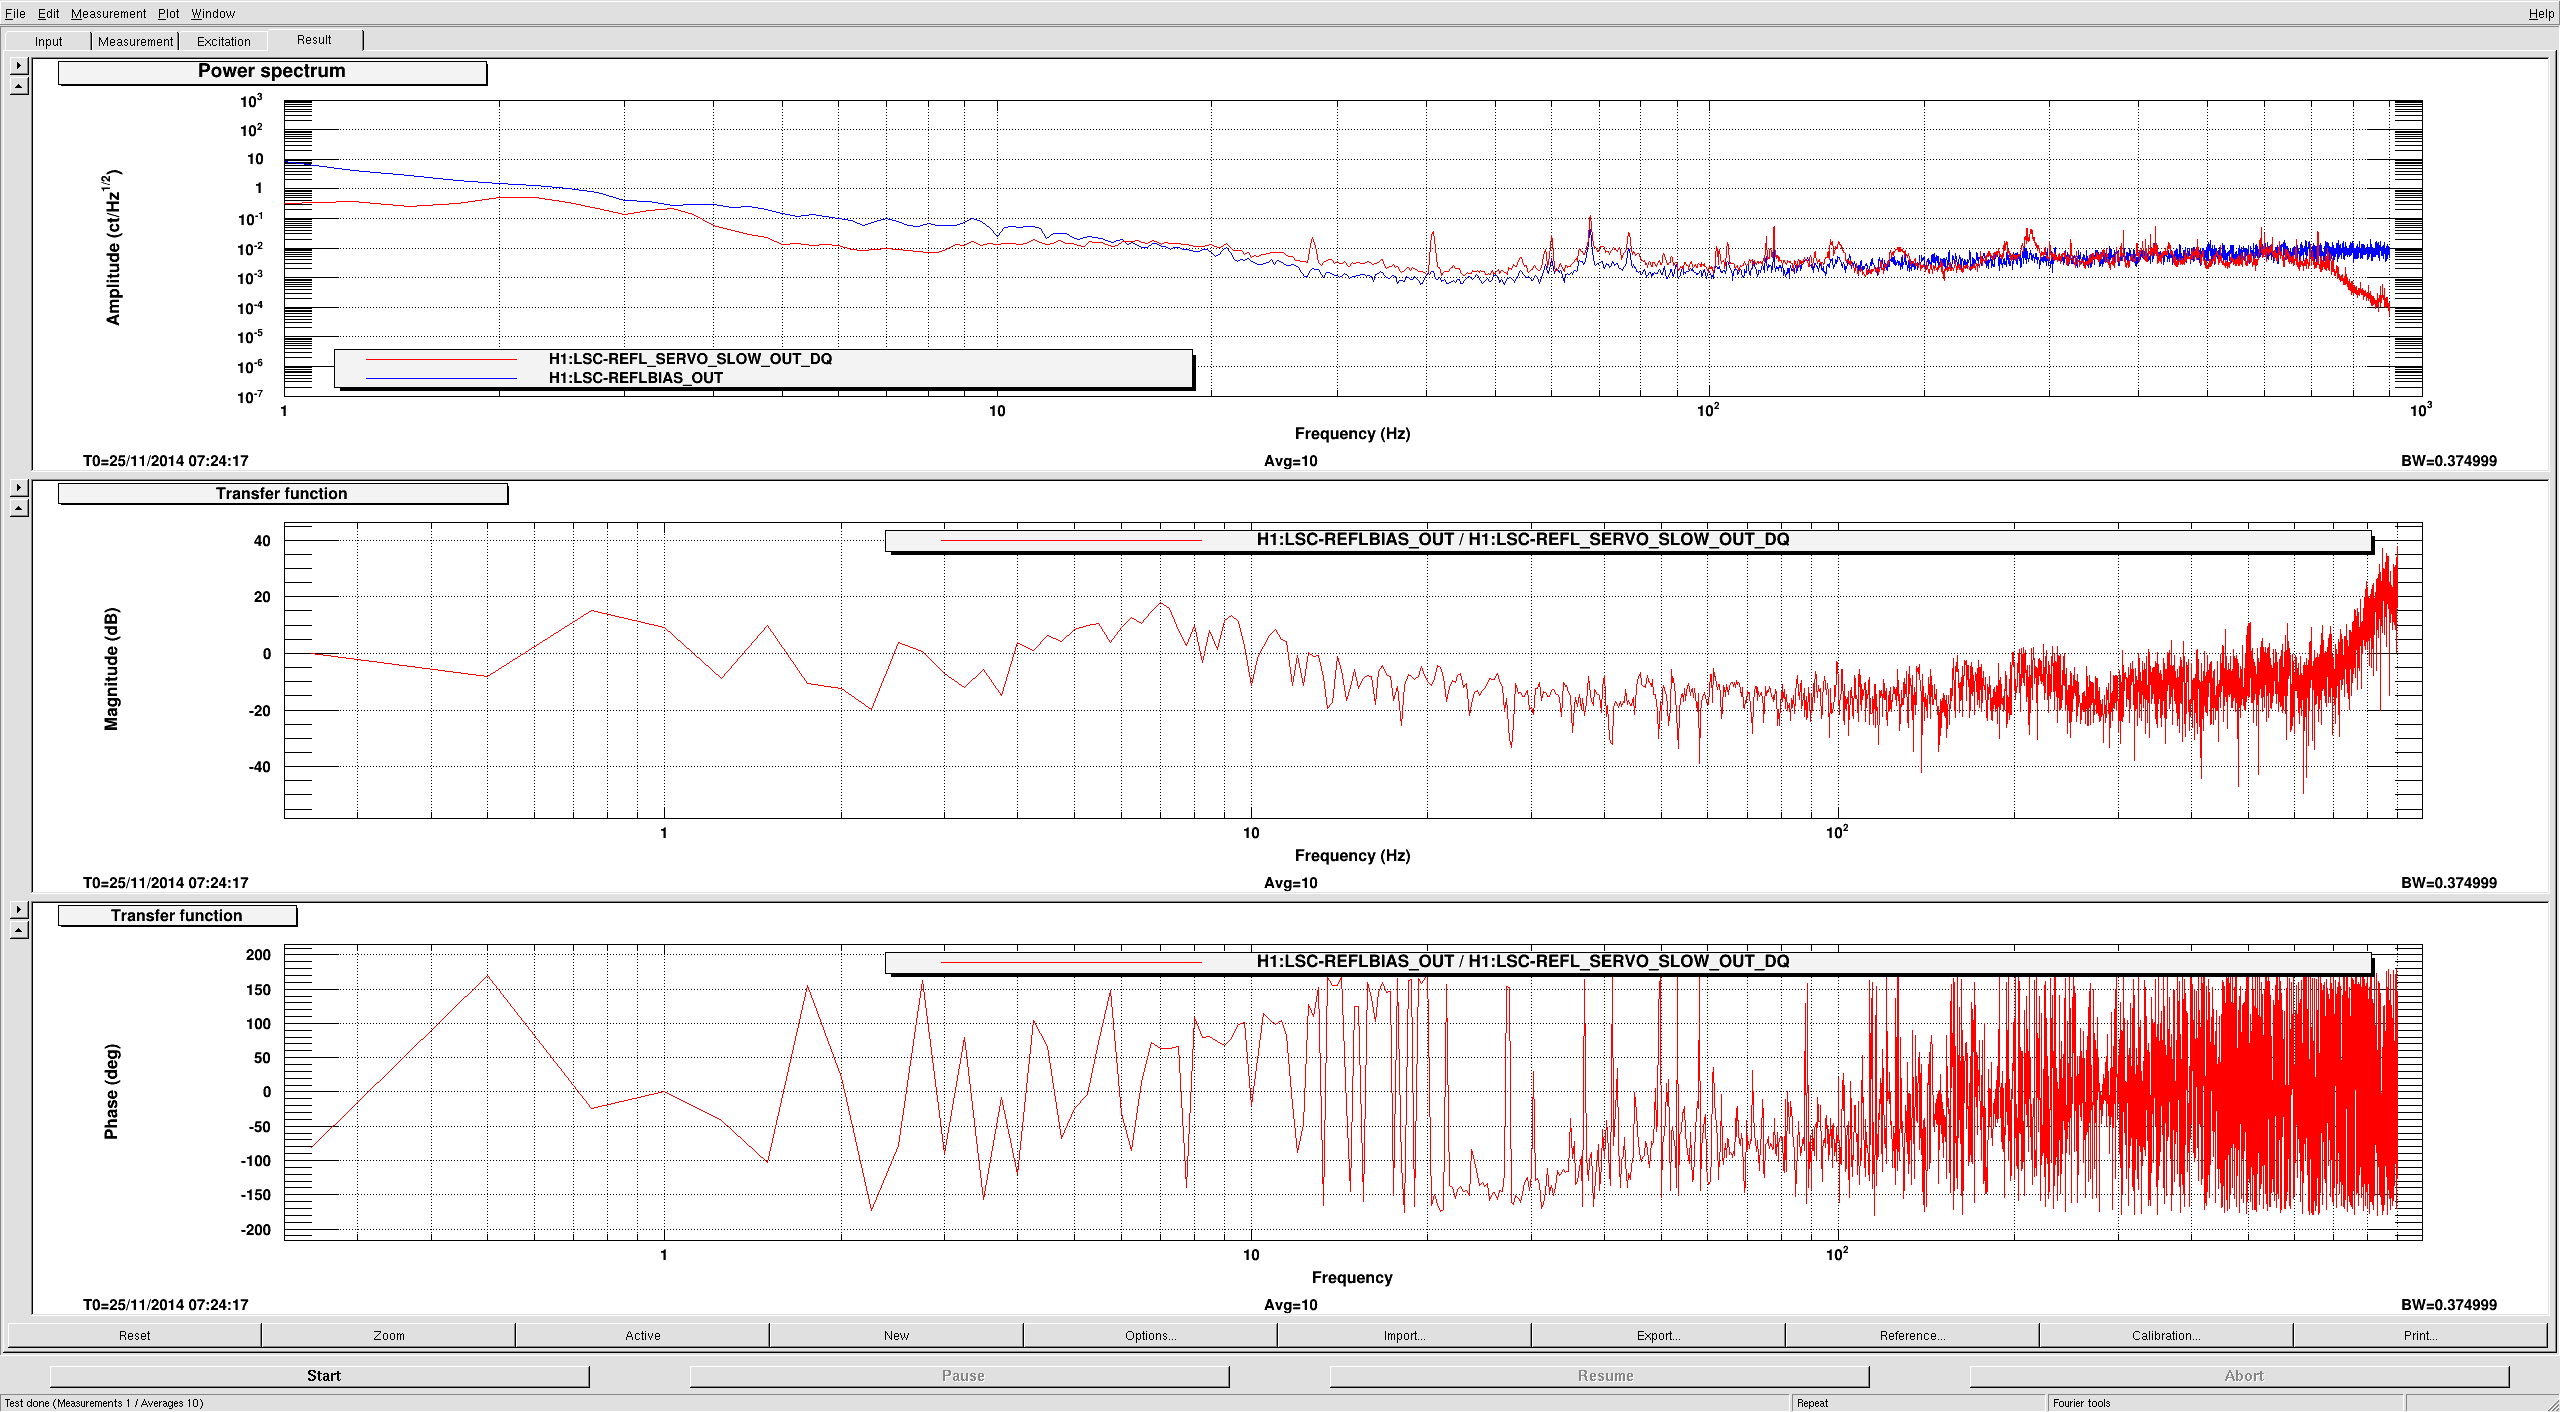
- We took a transfer function of sqrt(TRX+TRY) / CARM; this produced the expected 1/f^2 shape with a detuning peak at around the cavity pole of 40 Hz (see ALS_TR_HANDOFF.pdf -- The blue trace is without DRMI, ie PRM and SRM are misaligned with IR off resonance in the arm, while the red trace is with DRMI_arms off resoance in the configuration described above).
- We also compared the REFLBIAS signal to the REFL_SERVO_SLOW_OUTPUT (which is essentially REFLBIAS + (-4dB)*ALS_COMM_PLL_CTRL). This looked as we expected. Stefan will add a comment.
- We were able to increase the LSC-TR_CARM_OFFSET to -1.
- We only had to align the IFO once this morning!
- GPS 1100940241 at the end of the lock.
- Dear Dave, the load matrix is failing to load a lot.
Images attached to this report
Non-image files attached to this report


Comments related to this report
Attached are a transfer function showing the matched signals, as well as a StripTool plot of the successful sqrt(TRX+TRY) handoff.
Images attached to this comment
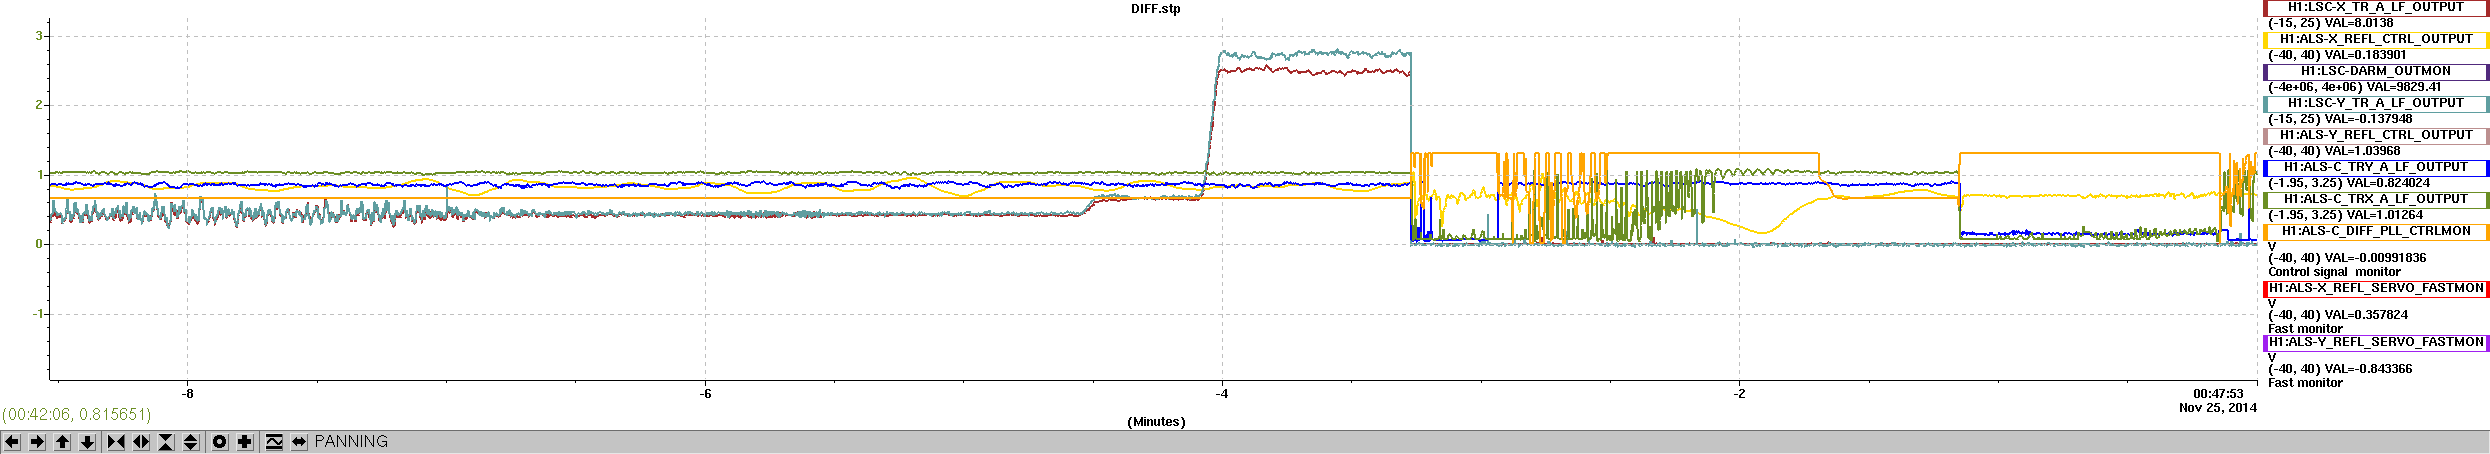
Well done! As far as I can tell, the unlock happens at 1100940293. The vertex seems happy, the first thing to go is the Y green.
Images attached to this comment