chandra.romel@LIGO.ORG - posted 21:33, Thursday 31 March 2016 (26374)
Pressures near CP3
8 pm reading (torr)

PT243 - 1.13 x 10⁻⁹
PT244 - 1.50 x 10⁻⁹
PT210 - 1.50 x 10⁻⁹
8 pm reading (torr) PT243 - 1.13 x 10⁻⁹ PT244 - 1.50 x 10⁻⁹ PT210 - 1.50 x 10⁻⁹
Tonight I moved the power recycling cavity axis around to try to center the spots on the ITMs. I was moving PR2 around, and the IFO's ASC followed me. It was a pretty significant move - enough that we no longer had green hitting the transmission cameras at the vertex. The carrier power recycling gain never really changed, but the sideband recycling gain decreased. I couldn't seem to recover this, even by moving the input beam (IM3 and a little IM2), so I have to think more about this.
Anyhow, when I tried to increase the power from 12W to 15W, I saw the ~0.5Hz pitch oscillations that Sheila describes in alog 26367. In general, the ASC loops are stable, however as we saw last night, it's very hard to get any coherence right near this peak, so I can't say for sure that we don't have a loop issue.
Big EQ in Japan, so we're calling it an early night.
Michael, Krishna
Today, we changed some parameters which correct for pixel-level non-linearities in the CCD. This improved the noise in the BRS-2 output.
We also improved several error-handling features of the code and created the Status signal (the 4th channel going in to SEI), which is set to have the following states: Good (5V), Damping On (2V) and Bad (0V). In the near future, there will be several other more detailed states on the BRS model screen indicating the specific problem, if it is in a bad state, which will help debug the problem. Detailed documentation on this will be prepared soon. We also filled out some of the filter banks for processing the BRS-2 data and for tilt-subtraction. More on that in the future.
The first attachment shows the BRS-2-rX signal in comparison to the STS2-Y seismometer on the ground close to it. The data is converted in to displacement units and was measured with low wind speeds on the order of 2-3 mph. The next page shows the coherence between the sensors. The instrument is still drifting and settling, so the low-frequency noise will improve over time.
We noticed that there may have been some excess noise in BRS-2, especially at higher frequencies, due to aliasing from the high frequency spikes (30, 80 Hz). Therefore we lowered the software low-pass corner frequency from ~50 Hz to 10 Hz. This does introduce phase-loss at ~few Hz but since this sensor is primarily used at ~10-500 mHz, this shouldn't be a problem.
The second attachment shows the output of BRS-2 after the improved low-pass.
6:00 pm reading (torr)

PT243 - 1.11 x 10⁻⁹
PT244 - 1.45 x 10⁻⁹
PT210 - 1.45 x 10⁻⁹
We have an oscillation in H1 that has been with us for a long time, is not understood, and can be mitigated by moving alignment offsets, and gets worse at high power. All the information in this alog is elsewhere in the log, this is just a summary.
For about 6 months we didn't change our soft loop offsets because when we did we would get the oscillation, this is how we stayed stable through O1. The main symptom is that the pitch optical levers move at frequencies around 0.45 Hz, all in phase with each other, and if you look at the relative sign of the optical levers it looks like CSOFT motion. the POP and arm transmitted powers also oscillate. Now that our soft loops are working again, we are probably in a position to again tune the soft loop offsets to be stable at 20 Watts, but it seems like this won't be a great solution as we try to increase the power even further.
There have been many alogs about this, but I wanted to summarize some of the recent things we have looked at.
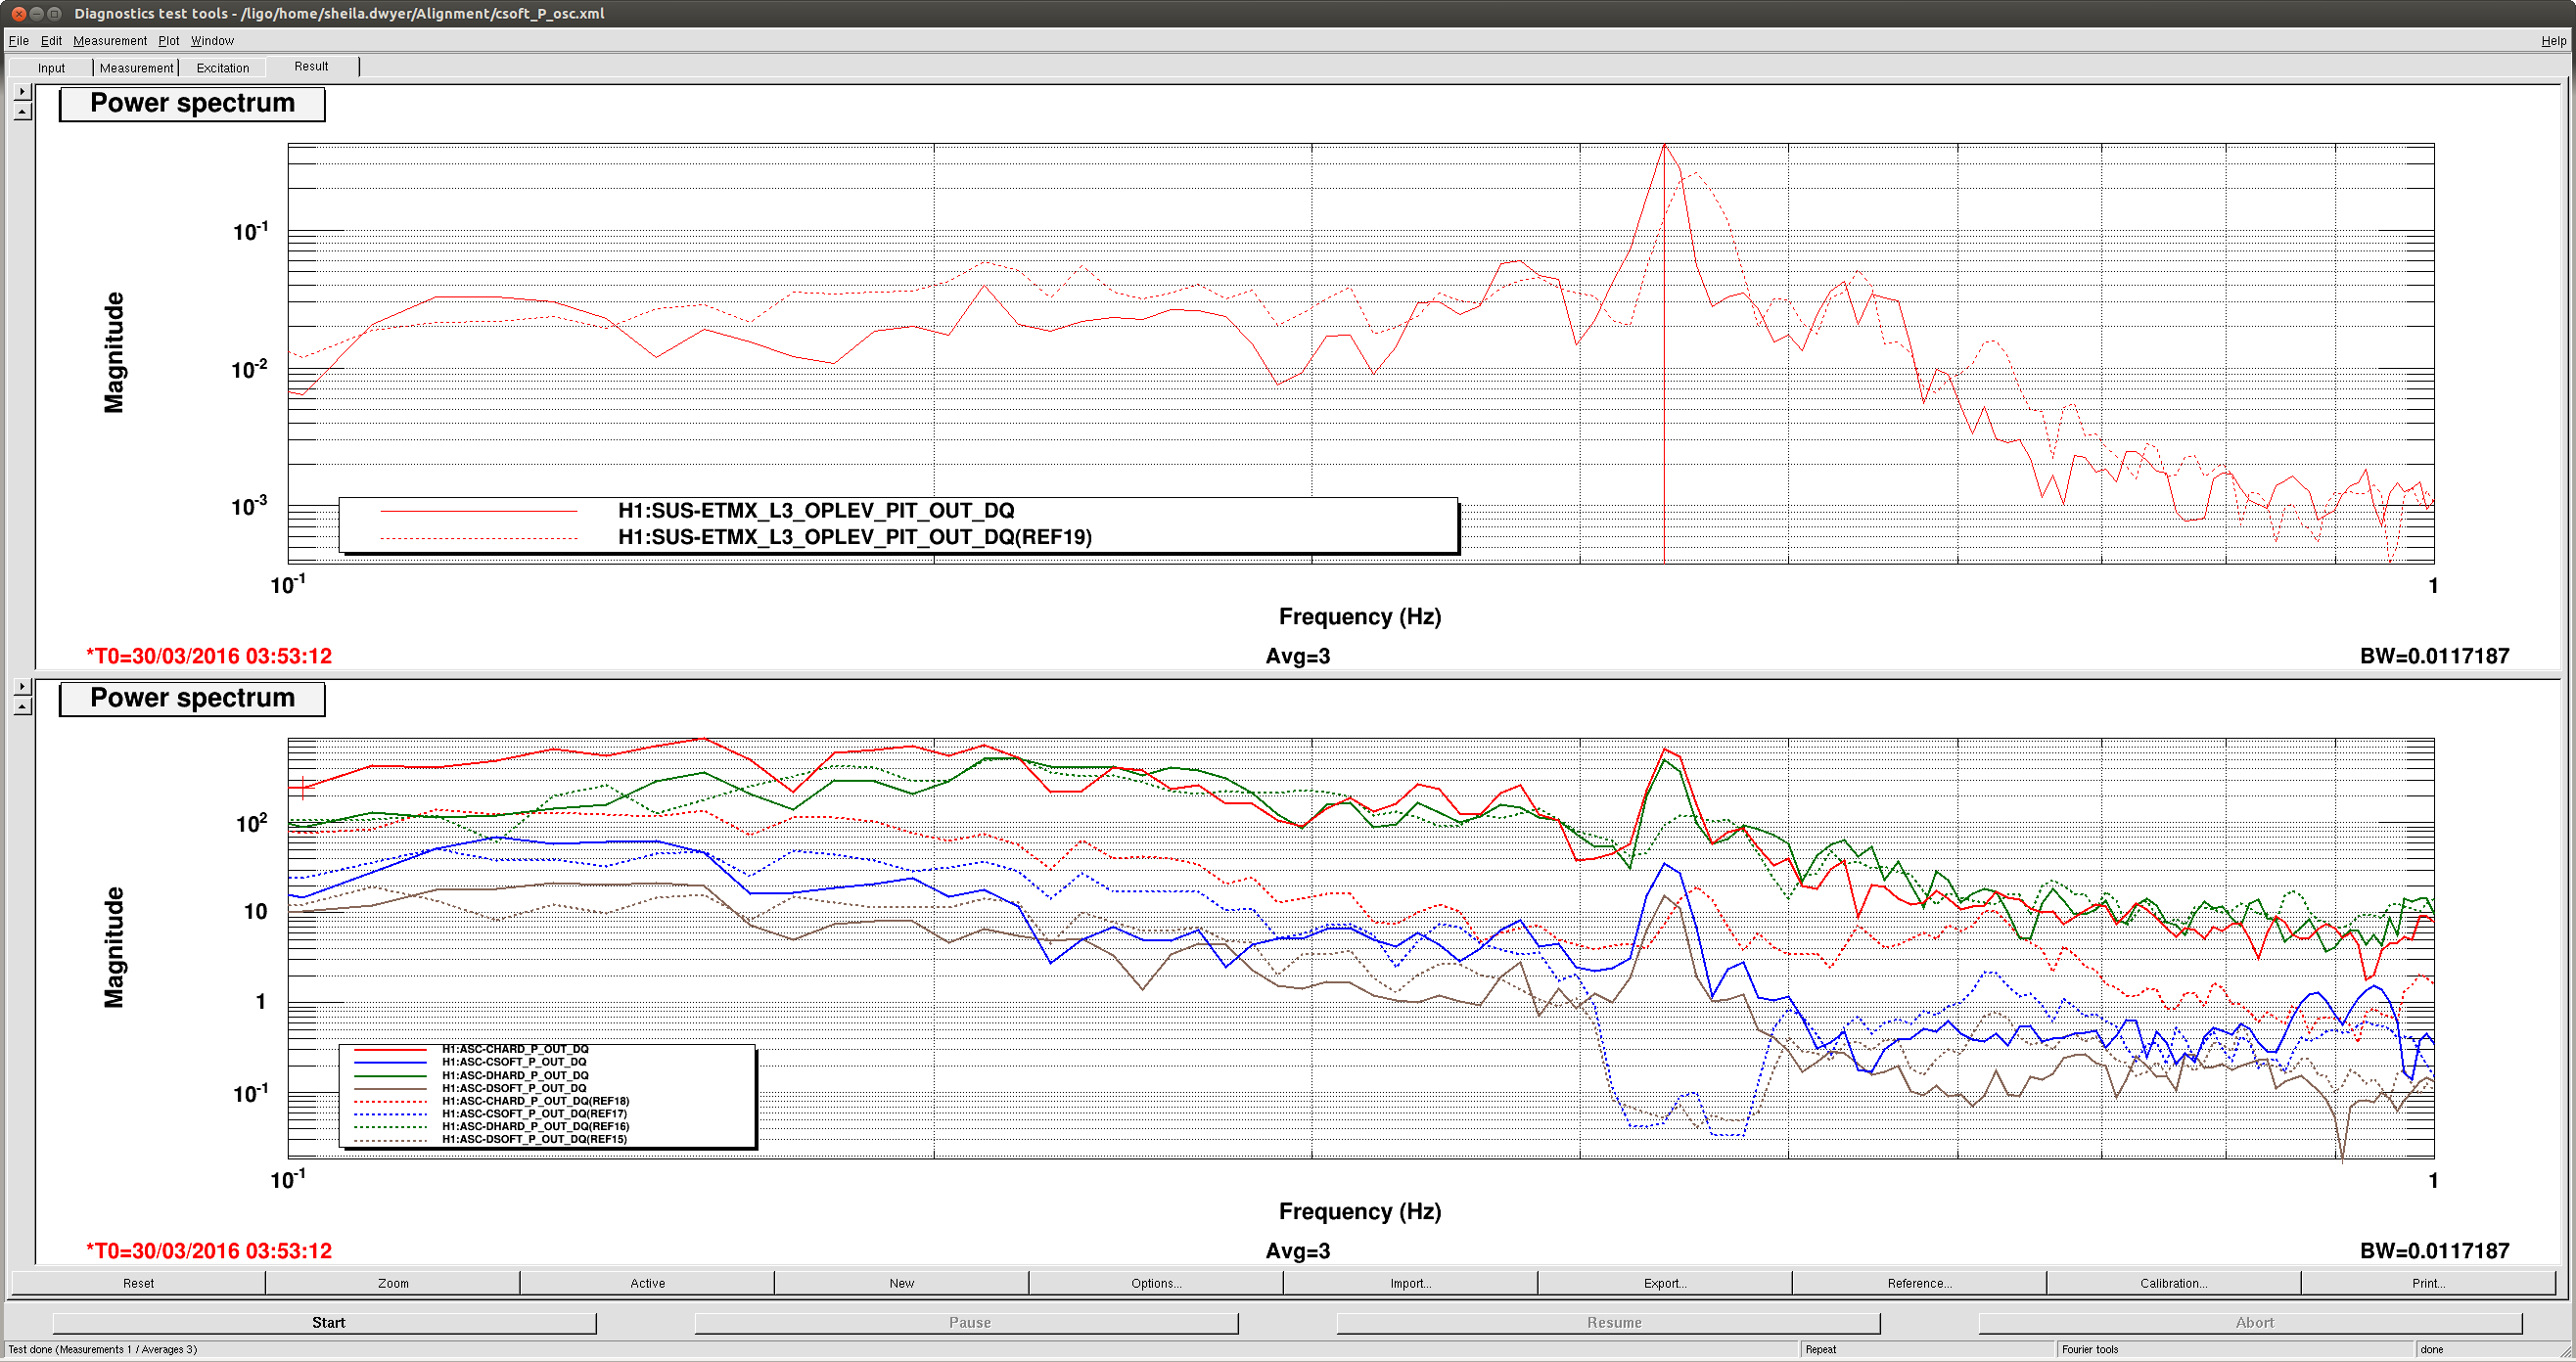
It seems like the torque that moves the test masses isn't coming from any of the arm ASC loops, or the optical lever damping. The first screenshot shows this, this is from Tuesday night when we powered up several times in slightly different configurations and repeatedly saw the same size of oscillation. The solid lines here show what was our normal configuration before Tuesday, with ITM optical lever damping on and ETM optical lever damping off. The dashed lines show the test configuration, where we added notches to the soft loops that reduce the actuation by about a factor of 100 at the oscillation frequency, and lowered the CHARD gains by a factor of 10. You can see that in the test configuration we also have about 5 and a half times less DHARD drive in the test configuration than in the normal one. Since all of these ASC drives are smaller in the test configuration but the oscillation is about the same, it seems like the force that moves the test masses must not be from these control signals.
It seems like the fluctuating radiation pressure due to changes in circulating power alone can't provide enough torque.
In the attached matlab script I estimated the miscentering we would need on each optic so that the approx 900 W changes in circulating power we see during the oscillation could provide the radiation pressure torque. These are way too large, ranging from 8-33 cm on the different optics. As a sanity check I also assumed that the alignment shift we see powering up before the soft loops get a changce to correct is due to radiation pressure (which it may not be). From that I estimate miscenterings ranging from 0.5-3 cm. I used the moment of interias from Evan Hall's alog , which he tells me are slightly wrong but not enough to matter.
The oscillation frequency does seem to depend on circulating power
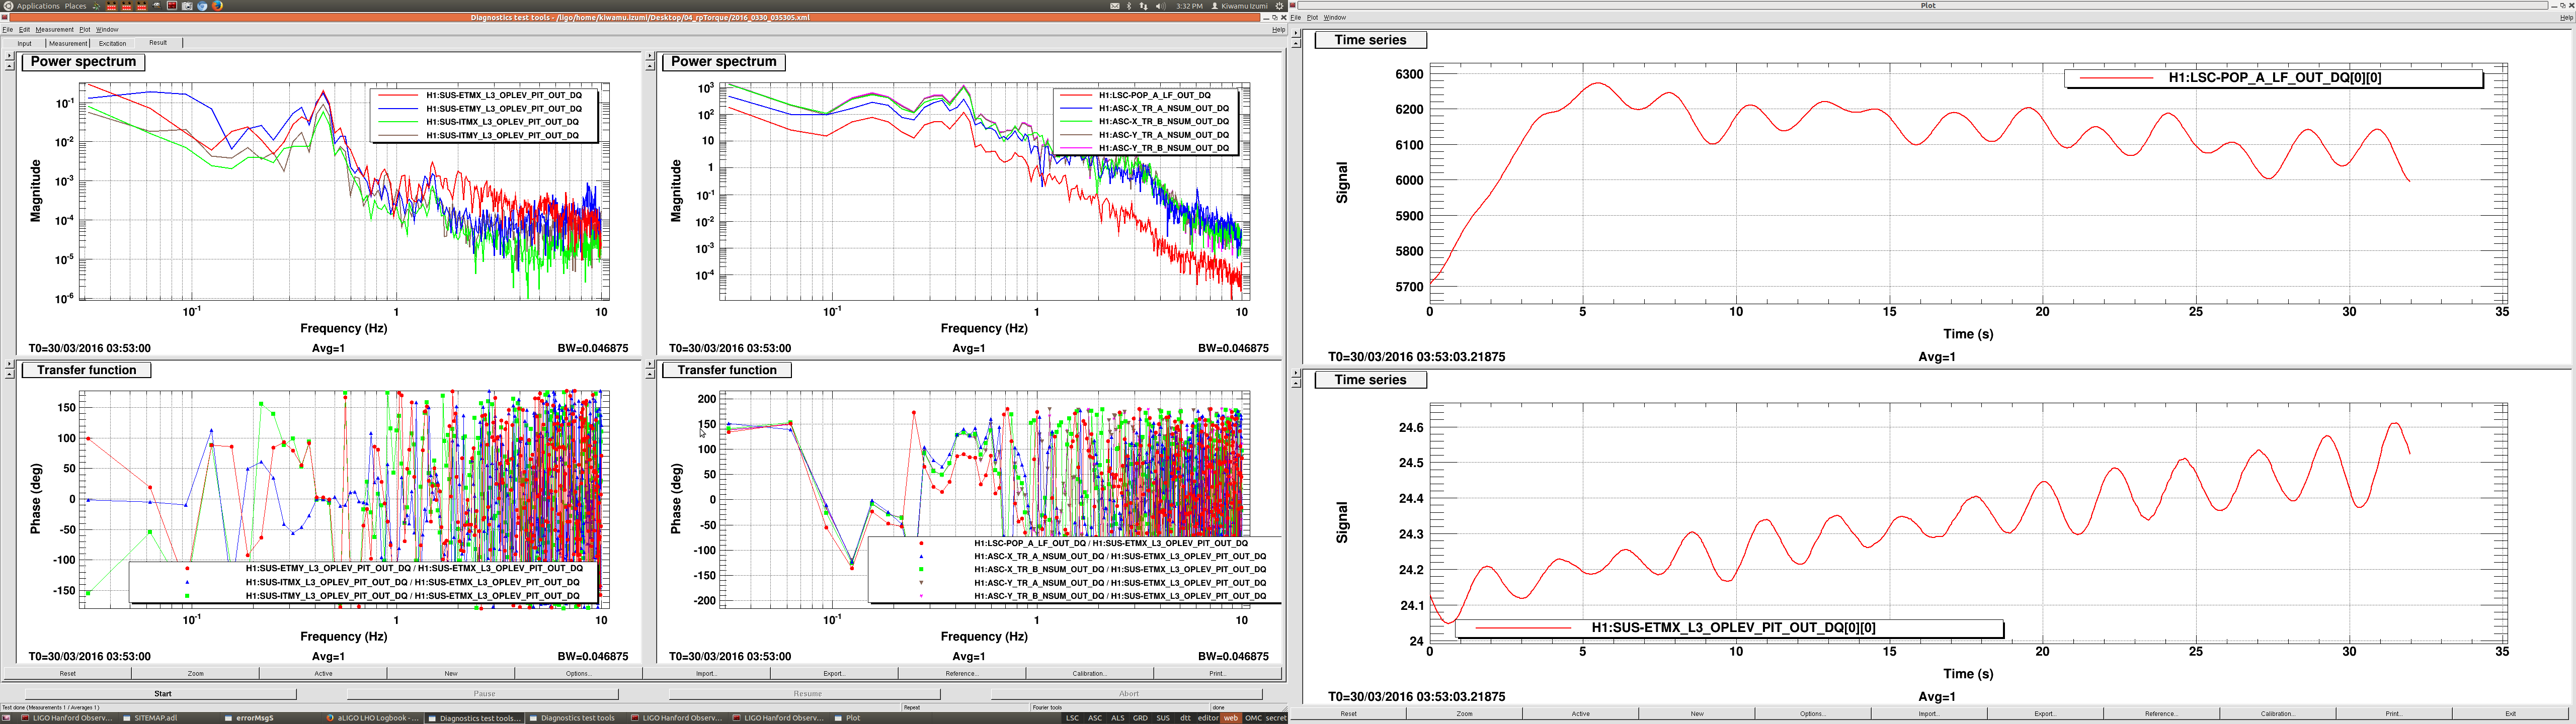
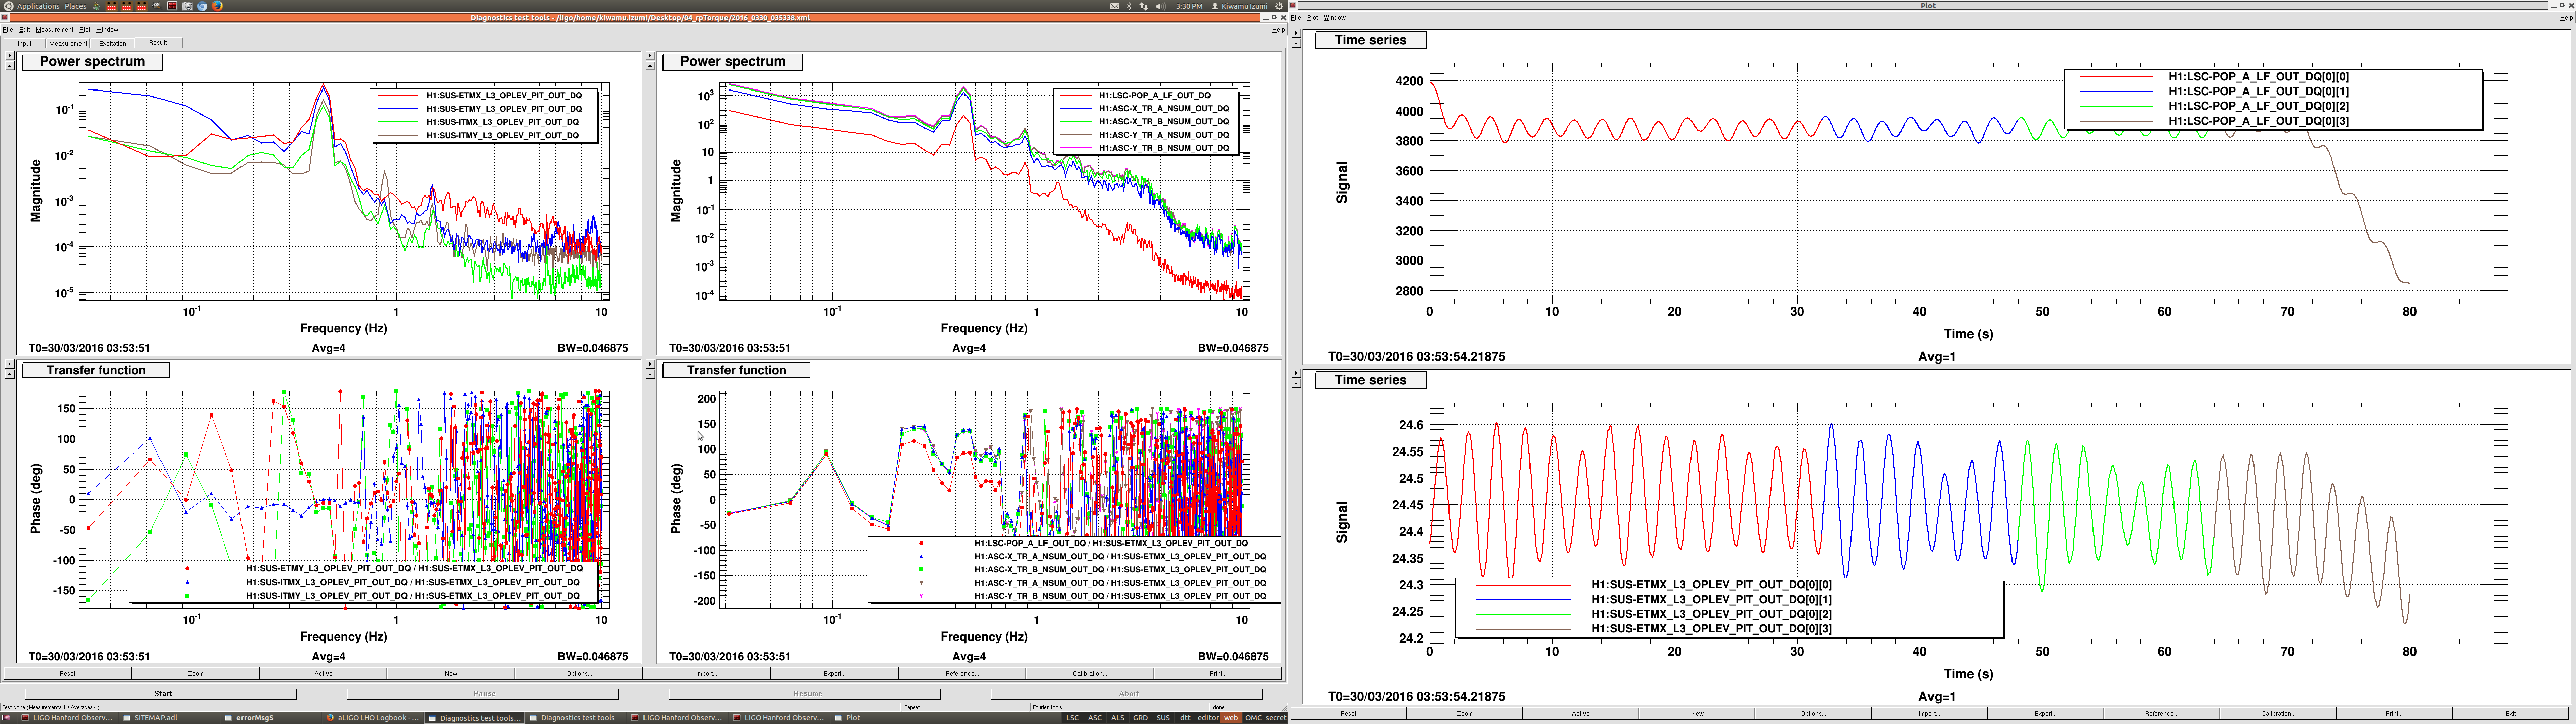
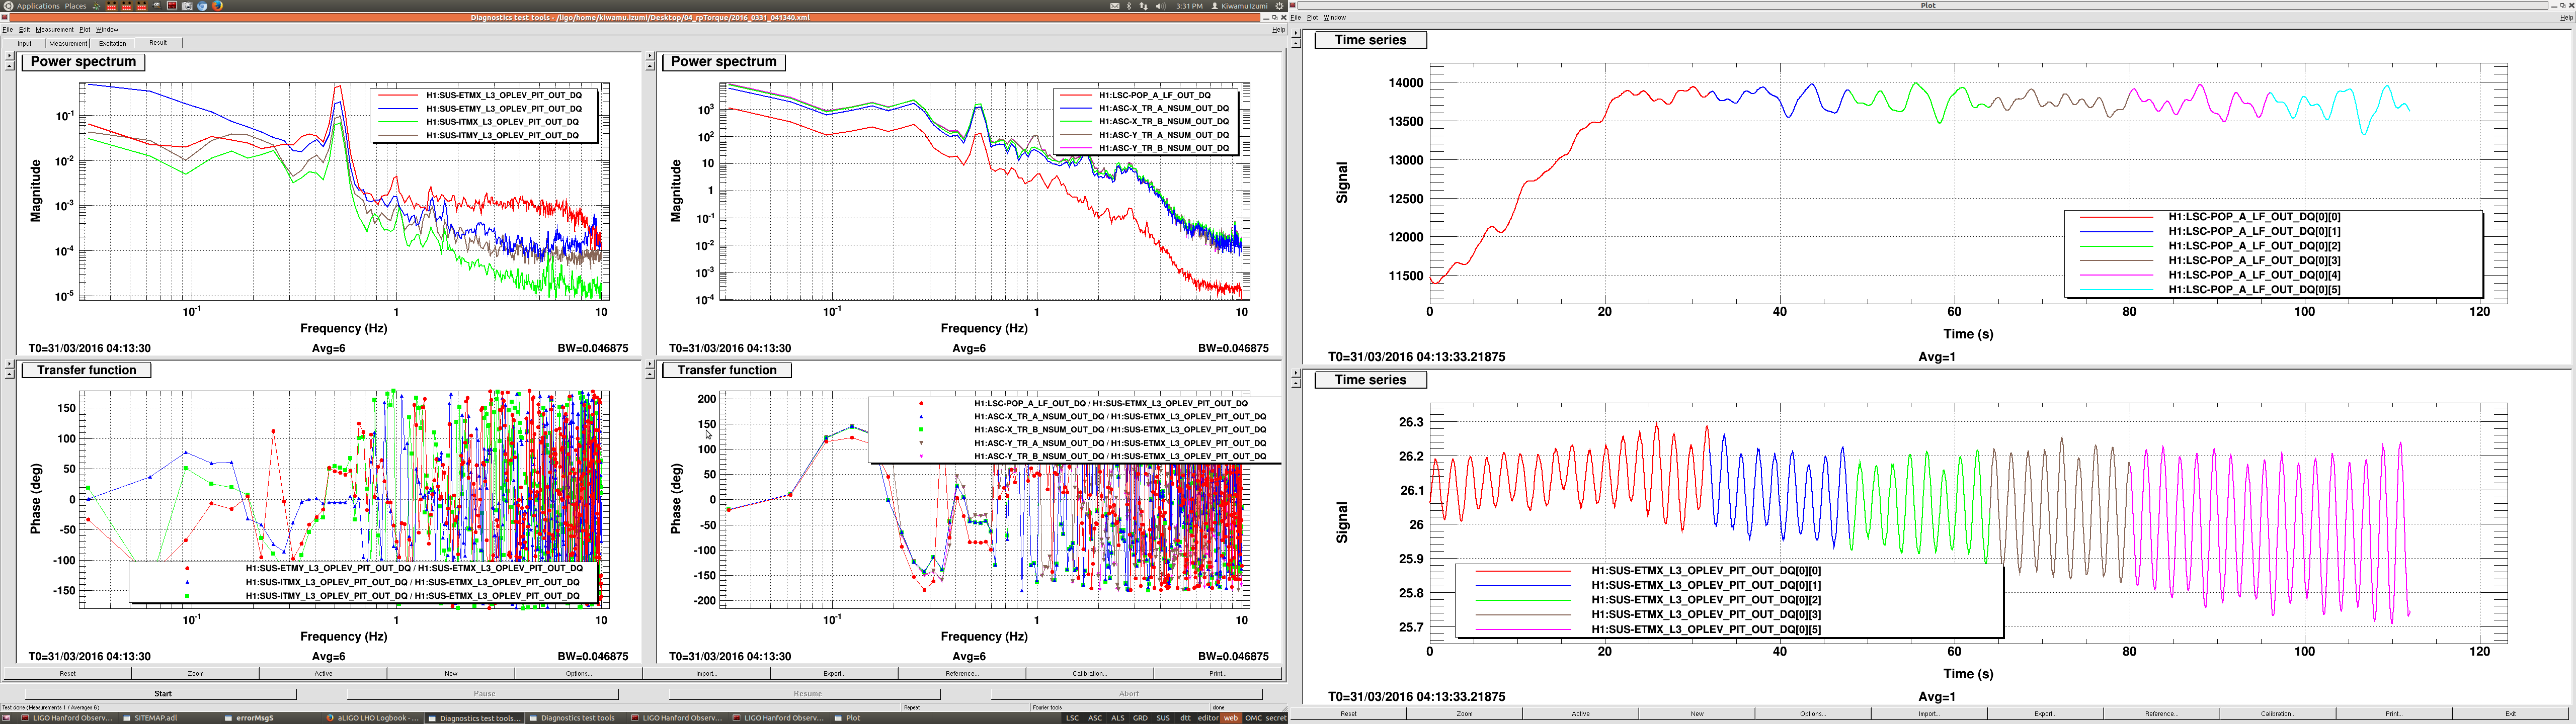
The evidence for this may be a little shaky since it is hard to get enough cycles of the oscillation to get a spectrum with nice resolution, but the second attached screen shot shows a spectrum of ETMX optical lever pit for 3 different circulating powers. These circulating powers are based on Dan Hoak's calibration and the TR XB QPD. The frequency of the lower two powers is the same within the resolution of my spectra. This may not hang together perfectly because I have included a little bit of time when we were powering up or down in the spectrum.
| frequency | circulating power | time |
| 0.44 | 23.6kW | 30/03/2016 03:53:05 |
| 0.44 | 34.3 kW |
30/03/2016 03:53:38 |
| 0.515 | 52.9 kW |
31/03/2016 04:13:30 |
Other ideas?
We have also tried putting a resonant gain the DARM loop(no impact), changing A2L feedforward (no impact), and centering on the ETMs (improvement). One possible test we could try to understand this better would be to drive the laser intensity and see if we can produce angular motion.

Given the observation 1 and 3 (torque moves masses, frequency not dependent on power), the most likely guess is that power modulation changes the feed-back on the fundamental mode of the quad pendulum.
Note that this doesn't require obervation 2 (feed-back through torque alone).
Instead, we need to estimate the effective change in the Q of the fundamental mode:
Q_RP = (Energy in quad pendulum oscillation) / (Energy pumped into the mode due to delayed power fluctuations)
We can estimate all of this:
a)
(Energy in quad pendulum oscillation) =omega^2/2 * SUM_i [ m_i x_i^2 + I_i*theta_i^2 ]
where the sum goes over all 4 masses of one quad (test, penultimate, etc.) , and the amplitudes x_i and theta_i come from the quad model https://awiki.ligo-wa.caltech.edu/aLIGO/Suspensions/OpsManual/QUAD/Models/20140304TMproductionTM , scaled by the observed pitch amplitude.
The dominant term is from the test mass. Neglecting the other masses, and for a pitch amplitude of 3e-7 rad (typical), we get
(Energy in quad pendulum oscillation) = 2.3e-12 Joule
b)
(Energy pumped into the mode due to delayed power fluctuations) = 2*pi*P0/c * (x_disp) * sin(phi)
Here P0 is the amplitude of the power fluctuation in the arm - from Sheila's number's I get 3.84% of the arm build-up, so let's call it 0.0384*50kW = 1.92kW
x_disp is the pendulum movement = effecive_arm * (3e-7 rad) = 1.21e-7 meter (the effective arm comes directly from the Quad page: effecive_arm = 0.244m / 0.602rad = 0.40meter )
phi is the phase delay between the pendulum motion and the power fluctuation. For a 1Hz cavity pole (do we have a more accurate number?) this is about 23deg
All this gives
(Energy pumped into the mode due to delayed power fluctuations) = 1.9e-12 Joule
or
Q_RP = 1.2 (there are enough approximations here that I would't thake the actual value seriously - but the effect is certainly of the right order of magnitude.
This is a follow up study on the angular instability. I have looked at the phase relation between some relevant signals from the data sets that Sheila posted.
Here is a summary:
| relative phase [deg] on 30/03/2016 03:53:05 | relative phase [deg] on 30/03/2016 03:53:38 | relative phase [deg] on 31/03/2016 04:13:30 | |
| ETMX oplev | N/A | N/A | N/A |
| ITMX oplev | -0.7 | + 0.1 | -5.0 |
| ETMY oplev | +2.8 | -5.4 | +43.7 |
| ITMY oplev | -1.05 | -14.8 | +52.3 |
| TR_X (average of A and B) | +136 | +137 | -46.1 |
| TR_Y (average of A and B) | +131 | +134 | -32.0 |
| POP_A_LF | +90 | + 92.0 | -84.8 |
The phases are measured with respect to the ETMX oplev. All the optical levers listed above are for pitch. Also I attach some screen shots of diaggui in which I extracted these phase information by taking passive transfer function measurements.
Interestingly, the first two data sets show qualitatively the same phase relations. However, the last data set showed very different phase relations. For example, all optical levers were almost in-phase in the first two data sets, while the last data indicates that the Y arm moved in advance to the X arm by 50-iish deg. Also, the cavity power signals were in advance with respect to ETMX oplev in the first data sets, while they were delayed in the last data set -- it seems as if they flipped the phase by 180 deg between the first two data sets and the last data set for some reason. This phase flip might be a clue to understand the cause of the instability.
State of H1: locking and making it to DC Readout
Site Activities:
H1 Activities:
Possible Activities for tomorrow:
4pm readings (Torr)

PT-243: 1.08e-9
PT-244: 1.42e-9
PT-210: 1.42e-9
John, Kyle, Chandra

Testing a three day cycle on CP3 overfill. We will *not* fill CP3 today and instead monitor pressures overnight, and fill tomorrow, Friday.

Chandra time (local): 16:00, 20:00, 00:00, 4:00
Kyle time (local):  18:00, 22:00, 2:00, 6:00
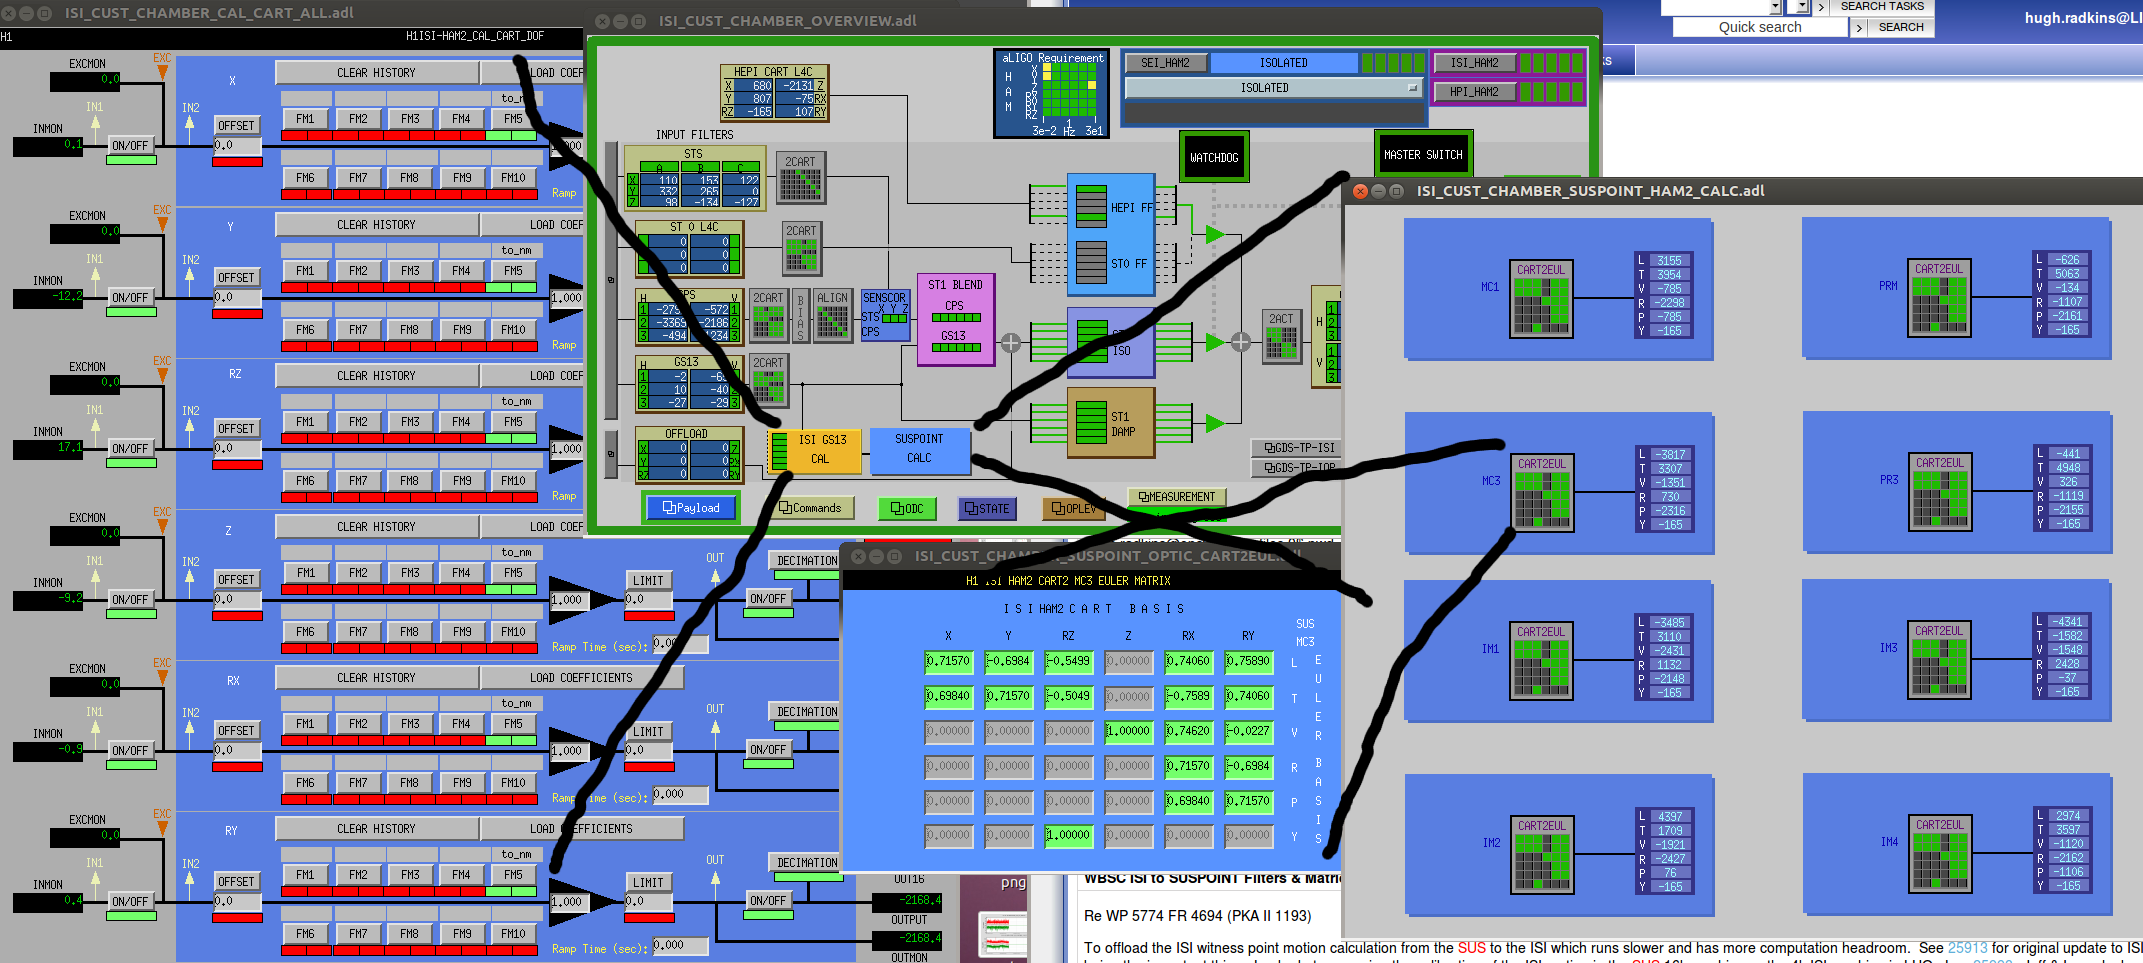
The HAM ISI model updates Tuesday, alog 26321, allow the suspension motion calculation to be done by the ISI. The filters and matrices to convert from ISI GS13 cartesian basis to the optic euler basis are now filled.
The BSC ISIs were updated for this earlier in the month. Alogs: original model updates-25913, ISI vs SUS calibration filter- 25993, mods for multi sus plarforms- 26117, library part cleanup/corrections- 26128, BSC filters & matrices populated- 26132, svn commits- 26143.
DetChar can now start pointing to these ISI computations. Look at channels: H1:ISI-{isi platform}_SUSPOINT_{suspension}_EUL_{euler dof}MON.
euler dof is L, T, V, R, P, orY
isi platform is HAM2, 3,..6, ETMY, ETMX,..,BS
suspensions available are ETMY, TMSY, ETMX, TMSX, ITMY, ITMX, BS, MC1, MC2, MC3, PRM, PR2, PR3, IM1, IM2, IM3, IM4, SRM, SR2, SR3, OMC. Of course you have to get the suspension on the correct isi platform.
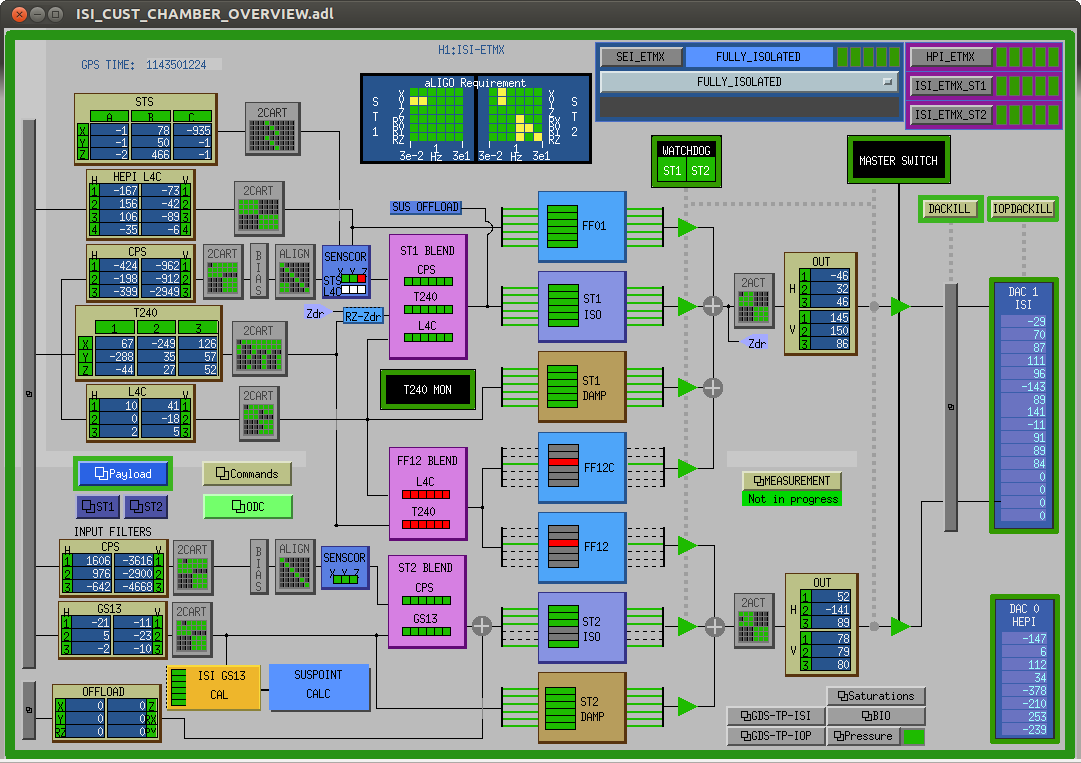
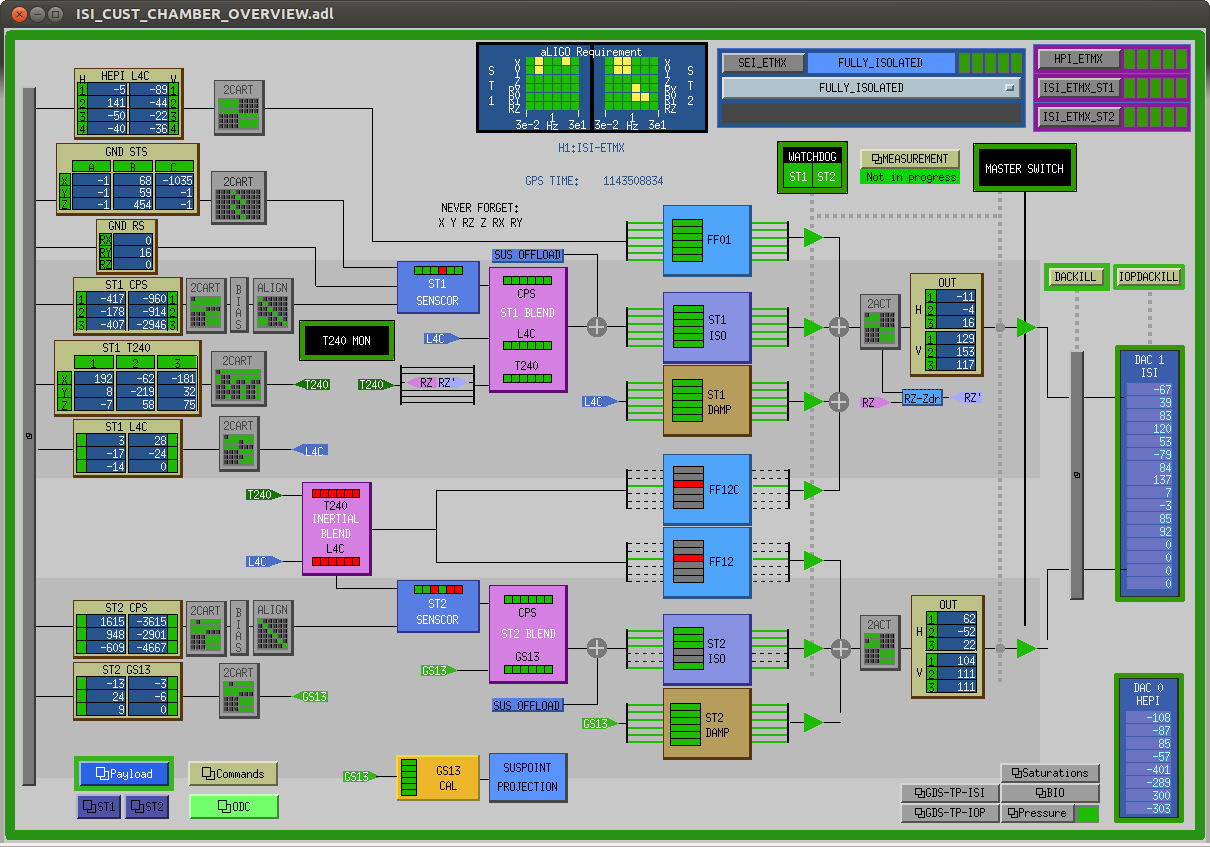
Attached is a snapshot of the medms: the GS13 filter bank and available suspension calcs are accessed from the ISI Chamber overview; the transformation matrices are accessed from the calc screen.
SDF files, safe and OBSERVE, have been updated and committed to the svn:
hugh.radkins@opsws1:burtfiles 0$ svn commit -m "updated snaps for the SUSPOINT motion calculations"
Sending burtfiles/h1isiham2_OBSERVE.snap
Sending burtfiles/h1isiham2_safe.snap
Sending burtfiles/h1isiham3_OBSERVE.snap
Sending burtfiles/h1isiham3_safe.snap
Sending burtfiles/h1isiham4_OBSERVE.snap
Sending burtfiles/h1isiham4_safe.snap
Sending burtfiles/h1isiham5_OBSERVE.snap
Sending burtfiles/h1isiham5_safe.snap
Sending burtfiles/h1isiham6_OBSERVE.snap
Sending burtfiles/h1isiham6_safe.snap
Transmitting file data ..........
Committed revision 13006.
hugh.radkins@opsws1:burtfiles 0$ pwd
/opt/rtcds/userapps/release/isi/h1/burtfiles
Above I noted the ISI channels at which DetChar should look but I listed the epics channel:
DetChar can now start pointing to these ISI computations. Look at channels: H1:ISI-{isi platform}_SUSPOINT_{suspension}_EUL_{euler dof}MON.
Of course, the channels of interest would be the DAQ channels, e.g. H1:ISI-ETMY_SUSPOINT_TMSY_EUL_L stored at 1024; these are also going into the Science Frames. Welllll, not just yet.
Woops, I made a syntax error on my frame collection designation--see new alog.
These are now being captured correctly in the Science Frames--see 26400.
[Fil, Jenne]
We've measured the distances from each Newtonian array sensor location (marked on the LVEA floor with green electrical tape) to the racks we'll use for signal concentration, so that we can order our cables soon.
The new Met One dust monitors have been installed in:
The LVEA at HAM6 and in the Beer Garden, in the Optics Lab,End-X, and End-Y. They are and sampling for 60 seconds every 10 minutes.

There are still a few minor issues being resolved, which do not effect the operation of the units or the particle counts.

Attached is a quick operators guide to the new monitor. Fuller documentation will follow.
John, Chandra

Pressures at IPs IP-7 & IP-8 on diagonal were ~10 Torr. Pumped out volumes with aux cart and opened gate valves to main diagonal volume. Connected HV cables, but did not activate IPs yet. Current diagonal pressure = 7e-7 Torr.

IP-8 still needs cable strain relief.
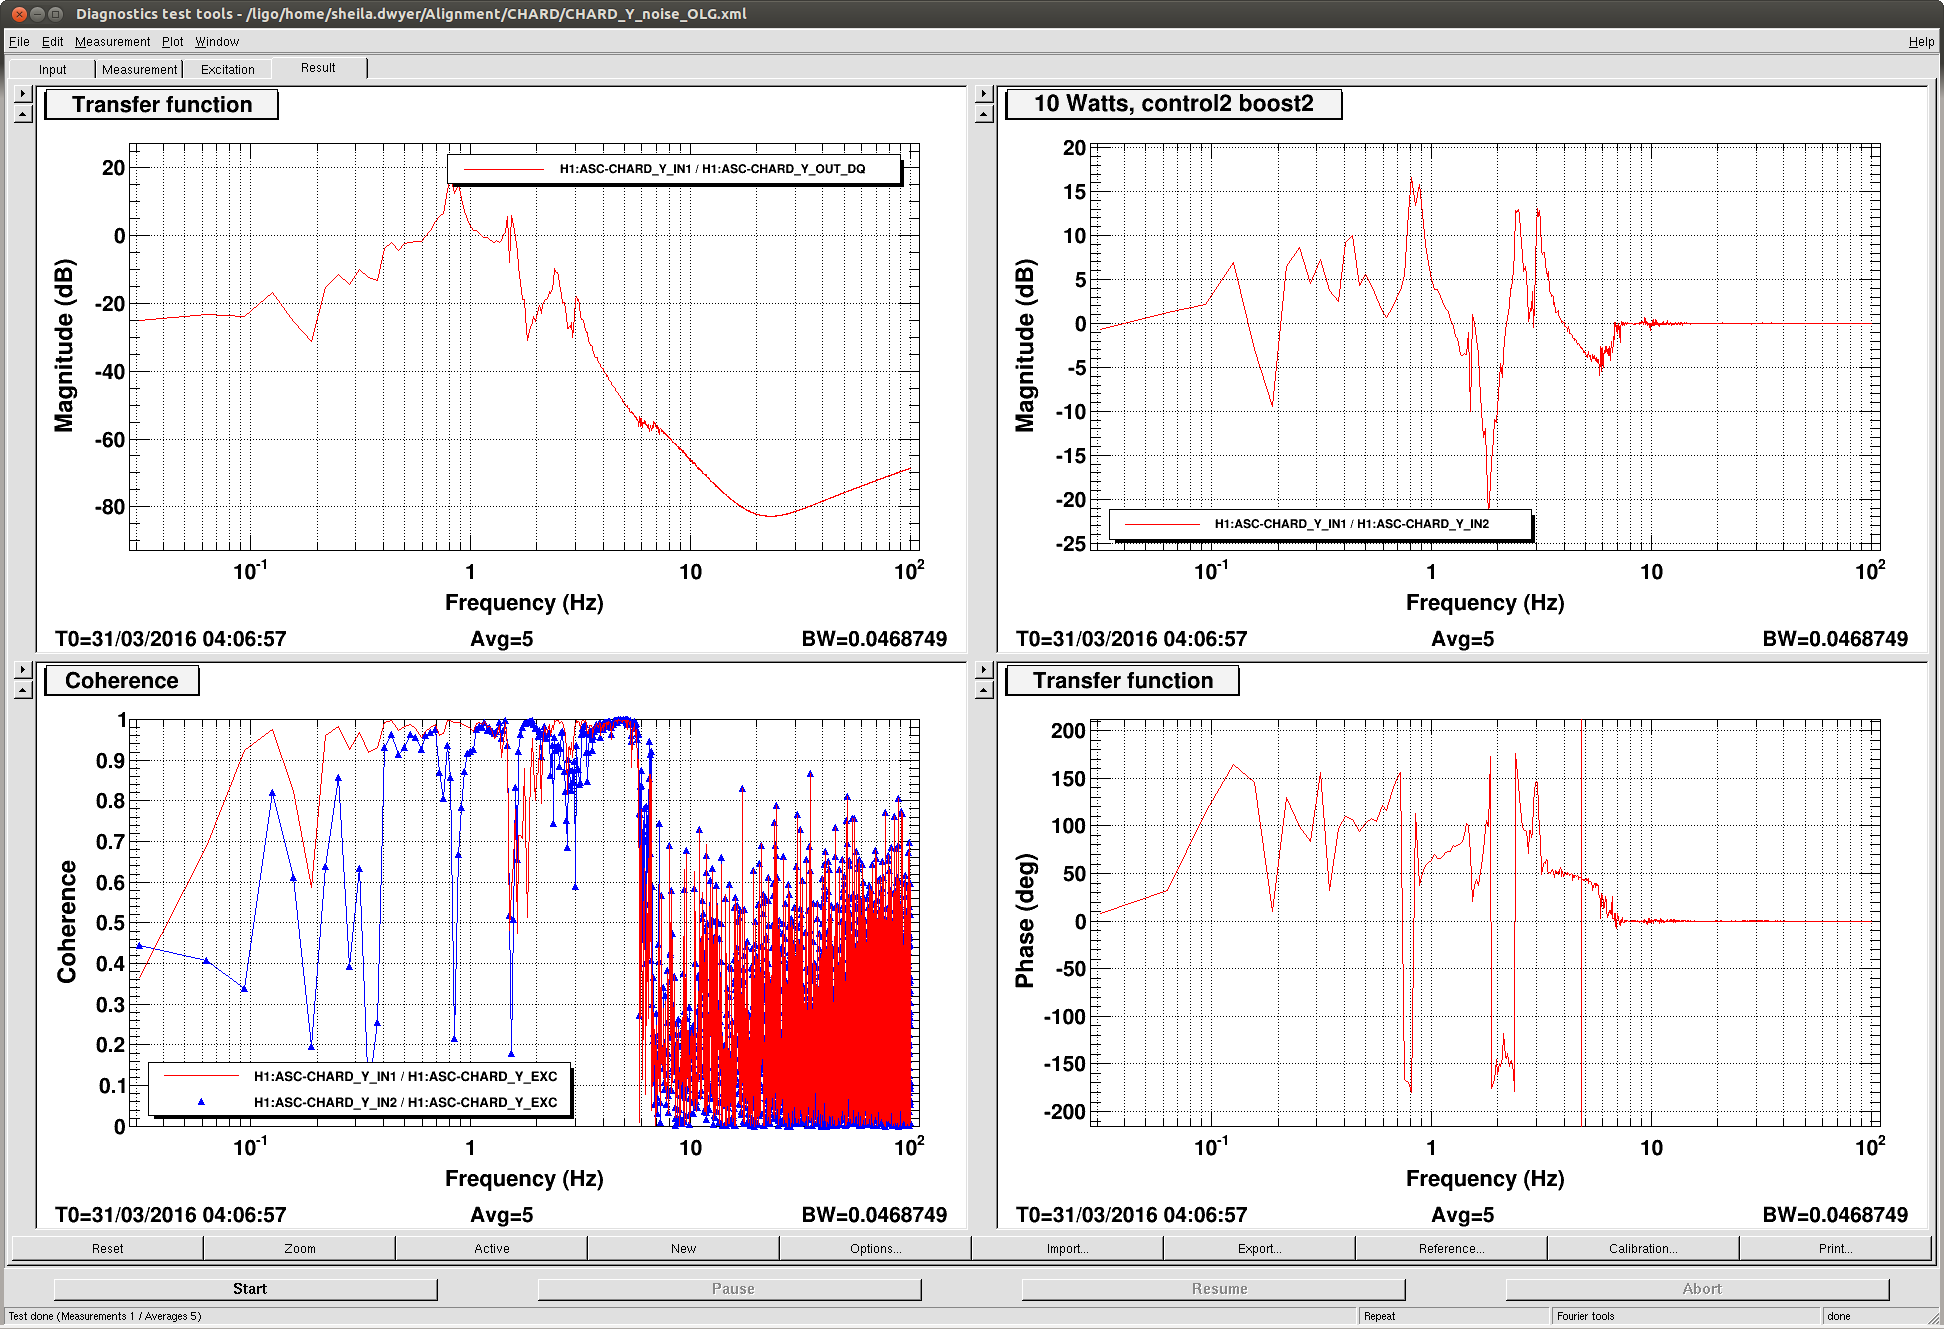
We've had much more success tonight with the non-broken Xarm Trans QPD. We once again re-centered the spots on the ETMs, although they didn't need much moving. We are able to sit at 10W and 12W just fine now. Now, we're running into regular ol' loop oscillations, so we've been measuring loops at different powers, and trying to re-tune them.
CHARD Y seemed the most egregious, so we created a new control and boost filter combo, which live in FMs 4 and 5. Unfortunately, these filters are totally unuseable at 2W, although they improve our stability at 10W, so right now the guardian still only engages the old loop shape filters. We'll have to re-think the 2W filter situation to make sure we can transition between these filters. Right now, we were by-hand turning off the CHARDY loop, changing the filters, then re-engaging the loop. Attached is an open loop gain for the new loop.
PRC2 pitch we've decided is kind of okay if we use a factor of 2 less gain.
Now, we're seeing oscillations that also show up in AS 90, so we suspect either the MICH or SRC angular loops. Unfortunately, there's something going on with NDS/the lockloss plotter/something, such that I can't get data from the last ~5 locklosses. The ones before that, I can still get and plot, but it can't find data for the last several even if it's been an hour since that lockloss.
So, next up: Measure the MICH and SRC loops at 10W to see if they're close to unstable. Measure again at 15W, and then think about going from there.
I feel I should know this already, but what is known about the QPD failure (circumstance at failure, failure mode, etc.)
It's not totally clear to me yet what the exact problem was. R.McCarthy is looking into why (apparently) putting the PI chassis spoiled the signal. Removing the new PI chassis seems to have fixed our problems. See alog 26328 and comments for symptoms and Rich's comment.
The PI AA was off and its OpAmp inputs were probably 'shorted' to ground due to the input protection diodes.
I am designing the input circuitry for the ITM PI Driver using the same input chip as that used on the ETM PI AA, so I will hedge our bets by including some input protection circuitry (current limit and clamp) to avoid this if that turns out to be the case.
In the lab, Fil reproduced the situation at EX by connecting a function generator to a coil driver test box (D1000931) and only used the single to differential converter of the board inside (D1000879) to drive the input of unpowered PI bandpass, and daisy chained to powered AA board.
Things looked OK until the PI input reached about +-1V differential (that's +-500mV positive and -+500mV negative), anything larger than that and the voltage started to be pulled down. Looked like a diode and a small resistor in series to me. As soon as the PI bandpass was powered on, everything got back to normal.
Daniel is correct.  The chips used on the input to the PI filters have internal input protection diodes that will (up to the limit of their current handling capacity, which is not much over 10mA or so) clamp the voltage from the QPD amplifier to something around a volt.

This is not a problem if the PI BPF is powered, which is the normal state of the system.  This event prompted a redesign of the differential input to the ITM ESD Driver to avoid this in the future.  Another case of incremental learning.
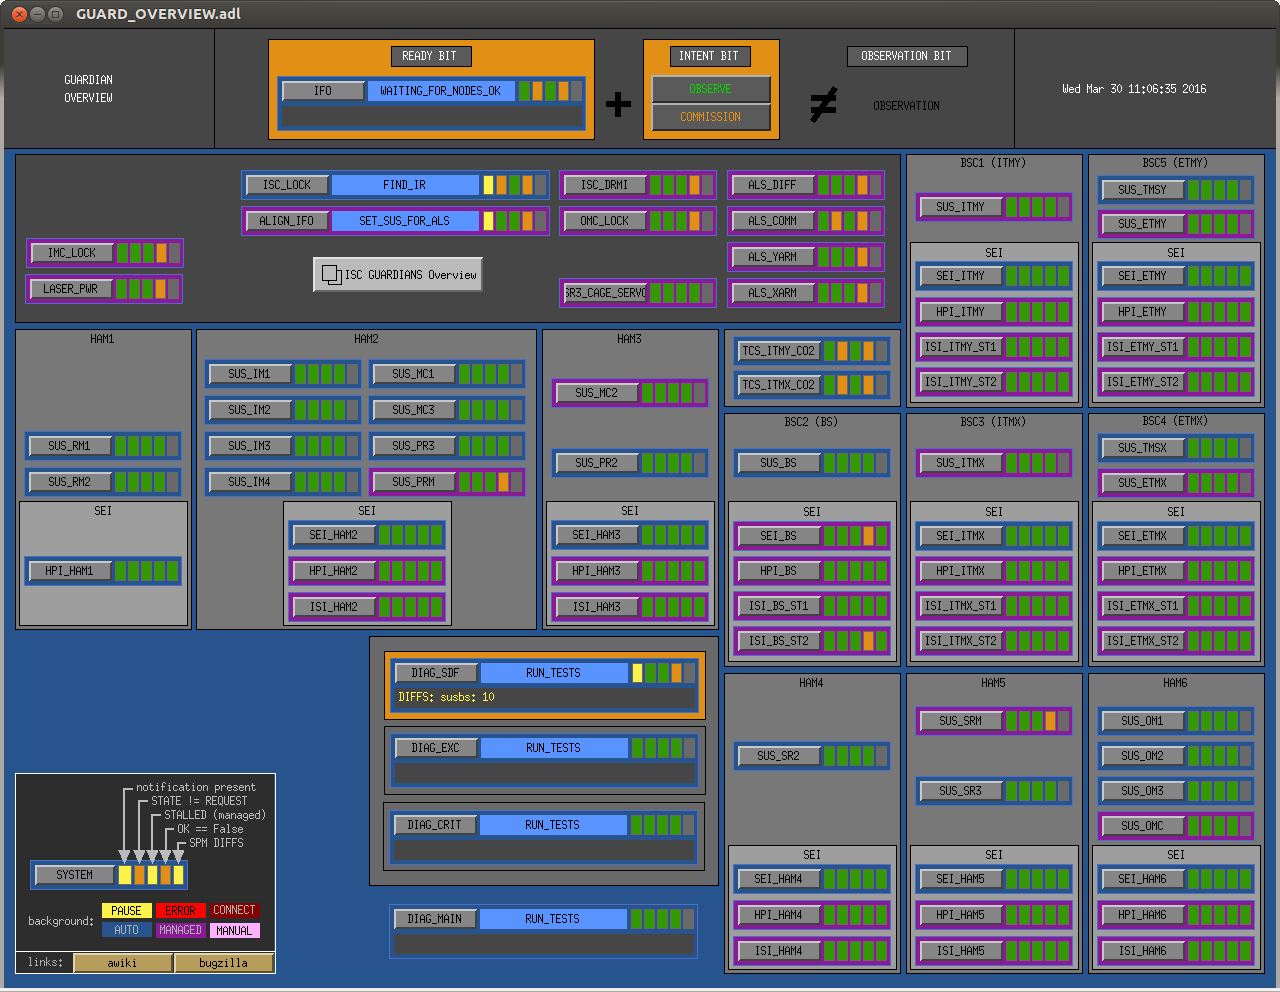
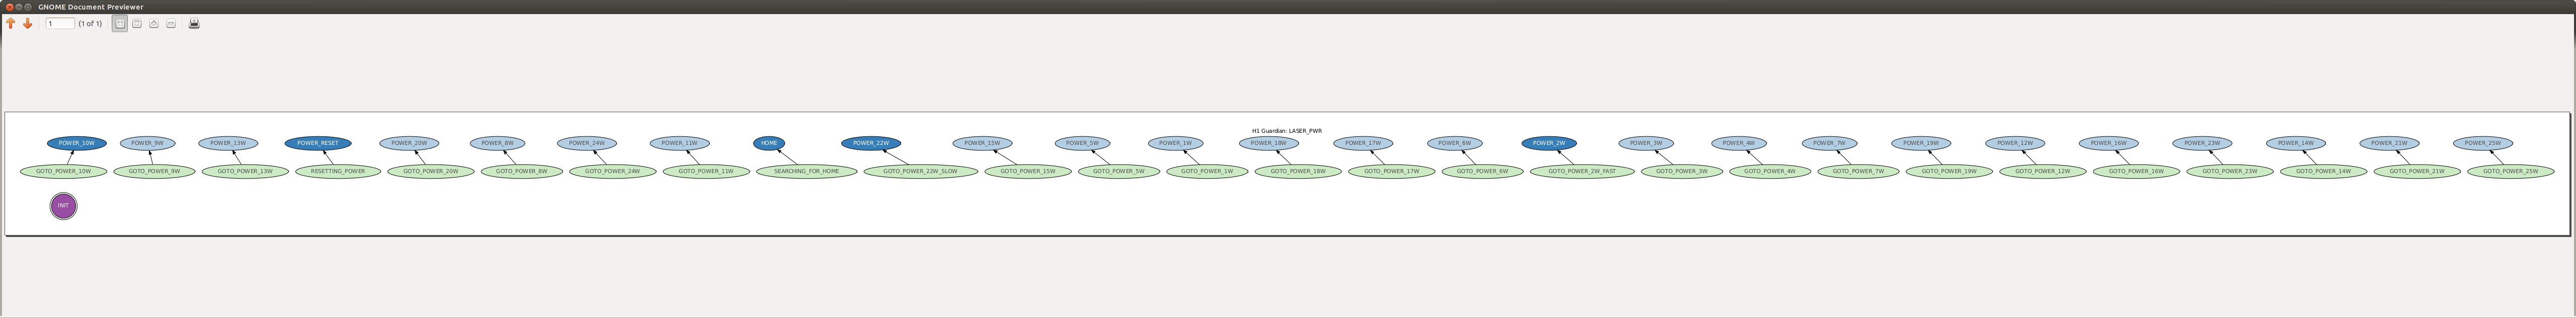
Introducing the new LASER_PWR Guardian node! Use it to change the power by selecting one of the three requestable powers (2W, 10W, 22W) or open the "ALL" screen to select any 'POWER_#W'. I attached a shot of the graph if you're curious. This node is nominally manged by ISC_LOCK and then ALIGN_IFO during initial alignment (though this has created some usermsg issues that I am trying to work around, more on that later).
I have also changed around some of the management for initial alignment. If the user wants to run initial alignment:
1. From READY in ISC_LOCK, go to manual and select INITIAL_ALIGNMENT
2. Wait for ALIGN_IFO to run through its DOWN state. This will temporarily take control of the ALS's, LASER_PWR, and IMC_LOCK nodes.
3. Run the green alignment from ALIGN_IFO instead of each of the ALS nodes. Offload the green WFS at the same ti.
4. Continue as usual, during SRC the LASER_PWR node will bring the power up to 10W and then back down after.
6. When done with initial alignment, make sure to go to INIT on ISC_LOCK to take back control of the nodes. then continue as usual.
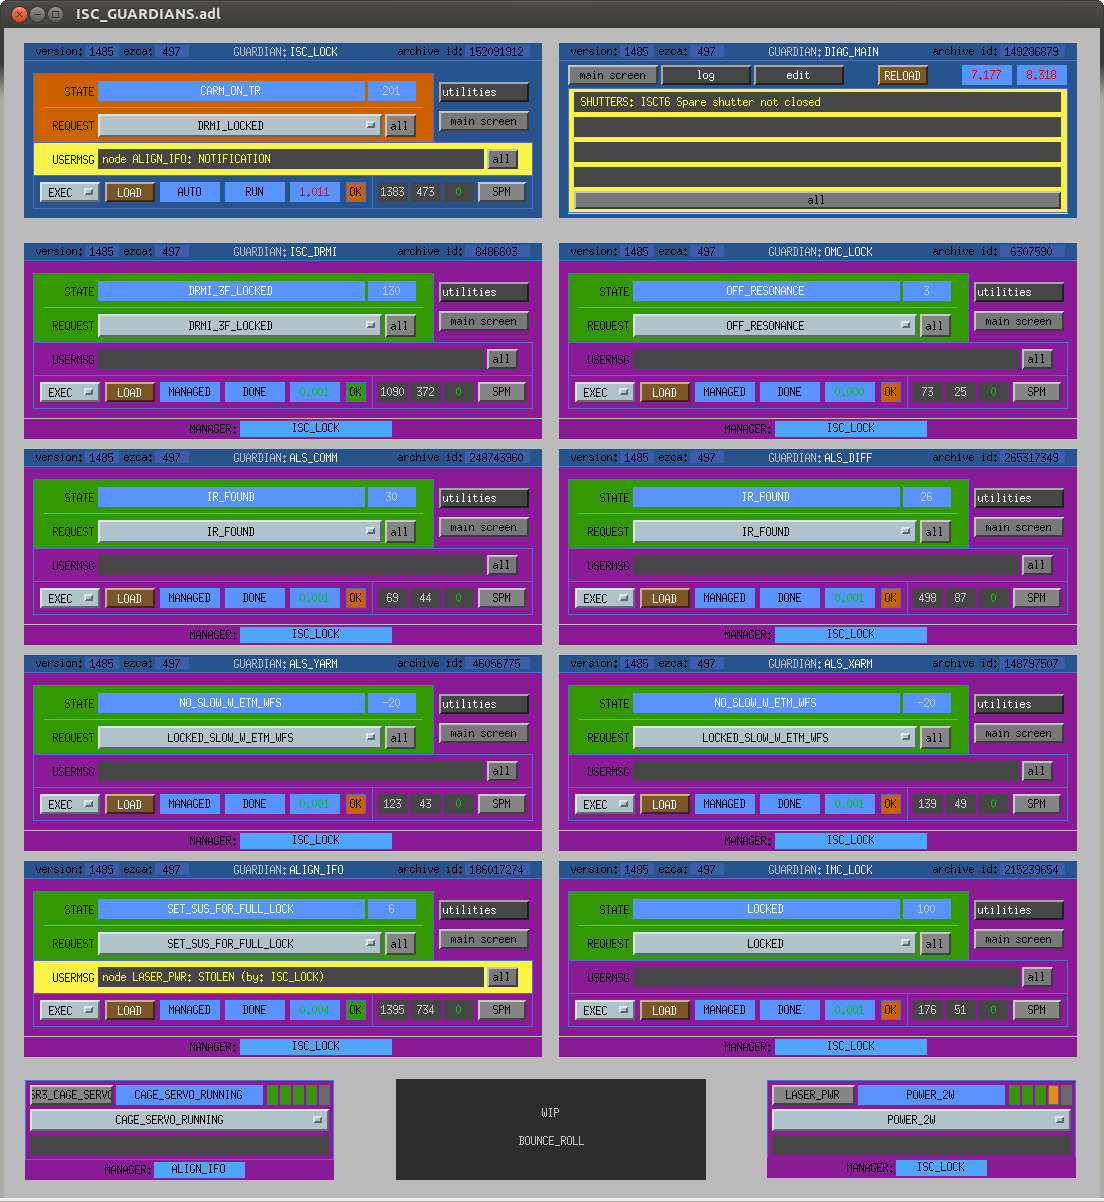
I added the LASER_PWR, as well as the SR3_CAGE_SERVO nodes to the Guardian Overview screen (shot attached).
I also slightly changed the ISC_GUARDIANS medm to show who the managers are of each node and placed the new node on the bottom. (shot also attached).
As I mentioned above, there are some user messages that will pop up on ALIGN_IFO and ISC_LOCK about the nodes being stolen by one another. This isn't a big deal for ISC_LOCK to report this whie we are in the middle of initial alignment, but it isn't good for ALIGN_IFO to be continuously notifying during normal locking. I have something that I want to try next opportunity I get, hopefully tomorrow. And if that doesn't work, Jamie seemed to have an idea of how to solve these types of situations that will be in the next Guardian release. Until then we can not manage the nodes during initial alignment just as before.
Quick update on Initial Alignment procedure.
After switching to the INITIAL_ALIGNMENT state in ISC_LOCK, the nodes usually used for IA will no longer be automatically managed. These will stay UNmanaged just like before all of this.
I tried to make a go around for the management by redefining the list of nodes that were control by the NodeManager object. This was plan B since I could not create a second object like I had originally hoped. Plan B also did not work though. While it did manage to get rid of the user notifications, it would regularly get confused and say something like "Node X was in state A, now state B" even though it was the one that had set state A and B. Seems like we will just have to keep it this way until the next grd release, but since this is basically like it was before it's not a big deal.
(Tasked by Aidan)
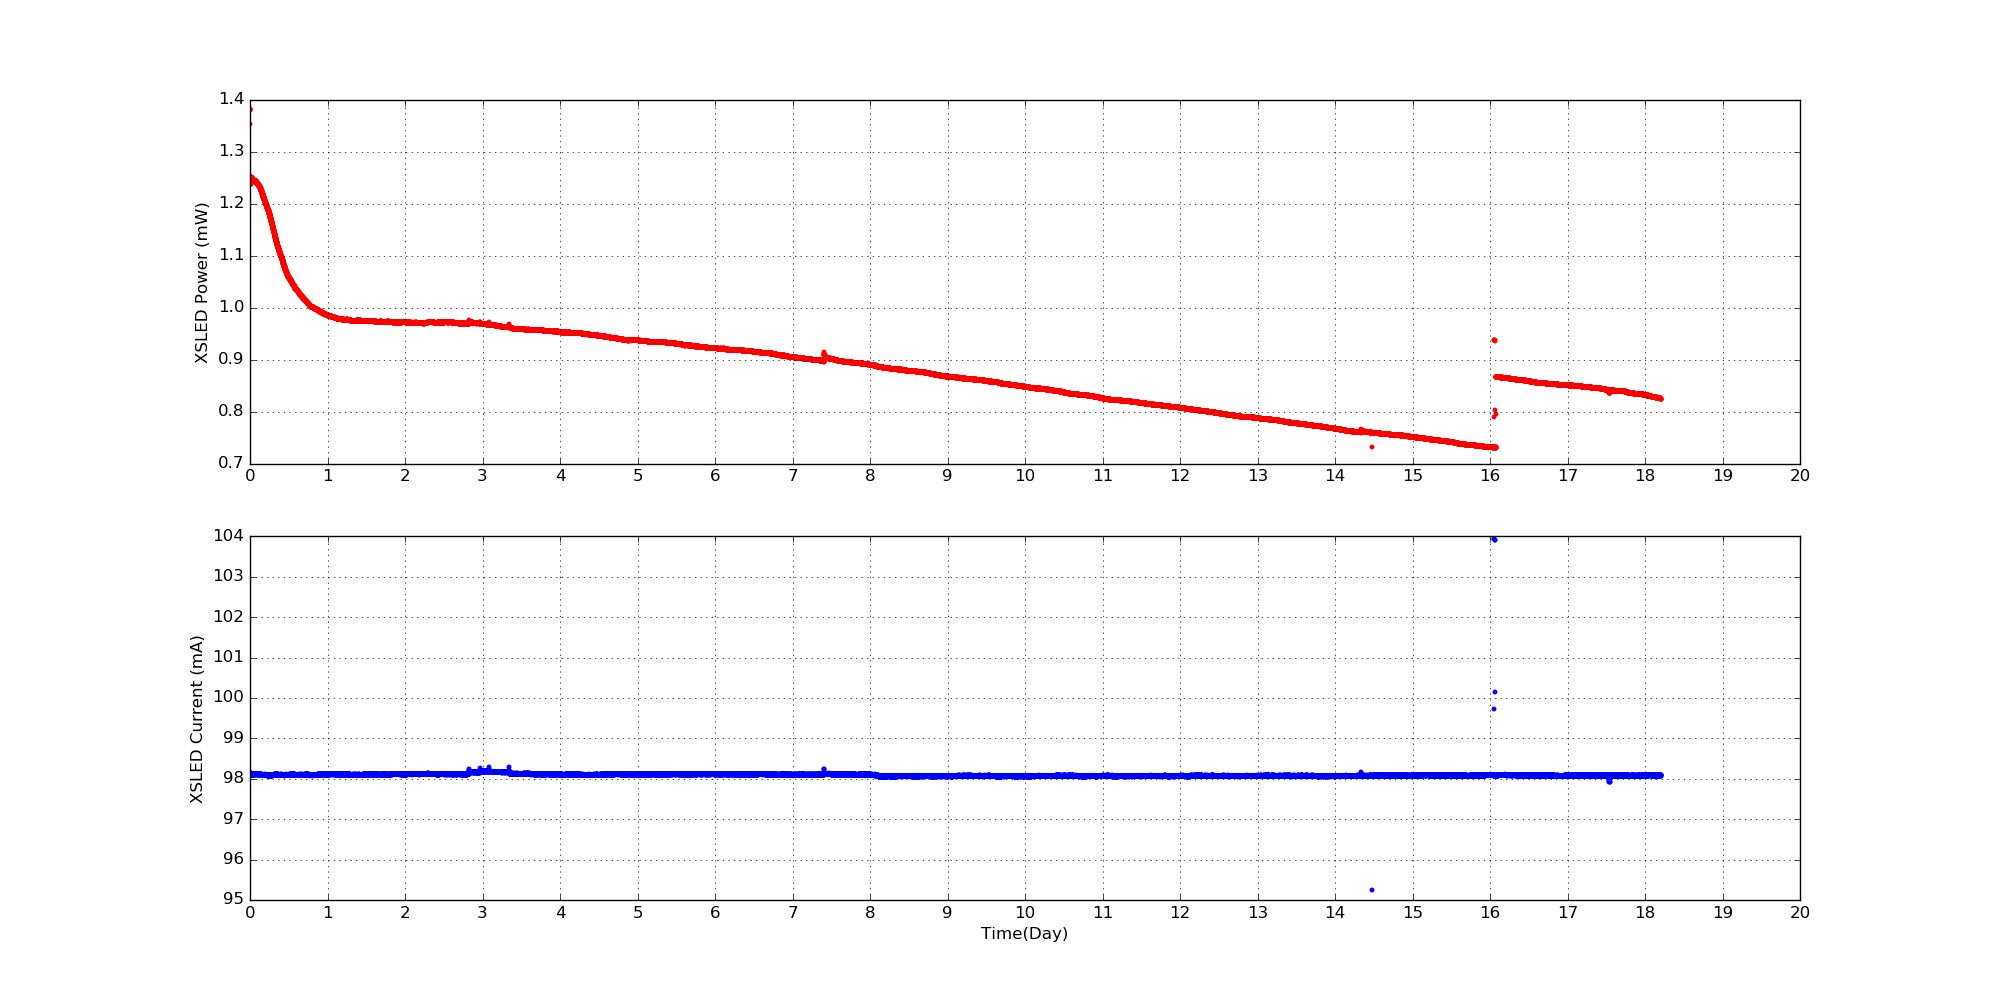
We were curious of how the HWS sled power decrease over time so we know when to swap them out. Below I've attached plots of HWSX and HWSY sled power (corrected for gains) and input current. The start time is when we replaced the SLED (April 26, 2015 for YSLED and March 1, 2016 for XSLED). I only plotted the time when the SLEDs were turned on (displays in number of days). XSLED shows deteroration of ~2% per day and YSLED shows deterioration of ~1% per day (given 7mW to be 100%, I don't think we are shooting 7mW out though but the trend looks reasonable). YSLED power decreased slightly faster when the input current = 94 mA.
XSLED data can be found here and YSLED data can be found here. The column goes Time|Power (mW)|Current(mA). The script to fetch and plot data can be found in the same directory.
The fast decay in the beginning is a known problem.

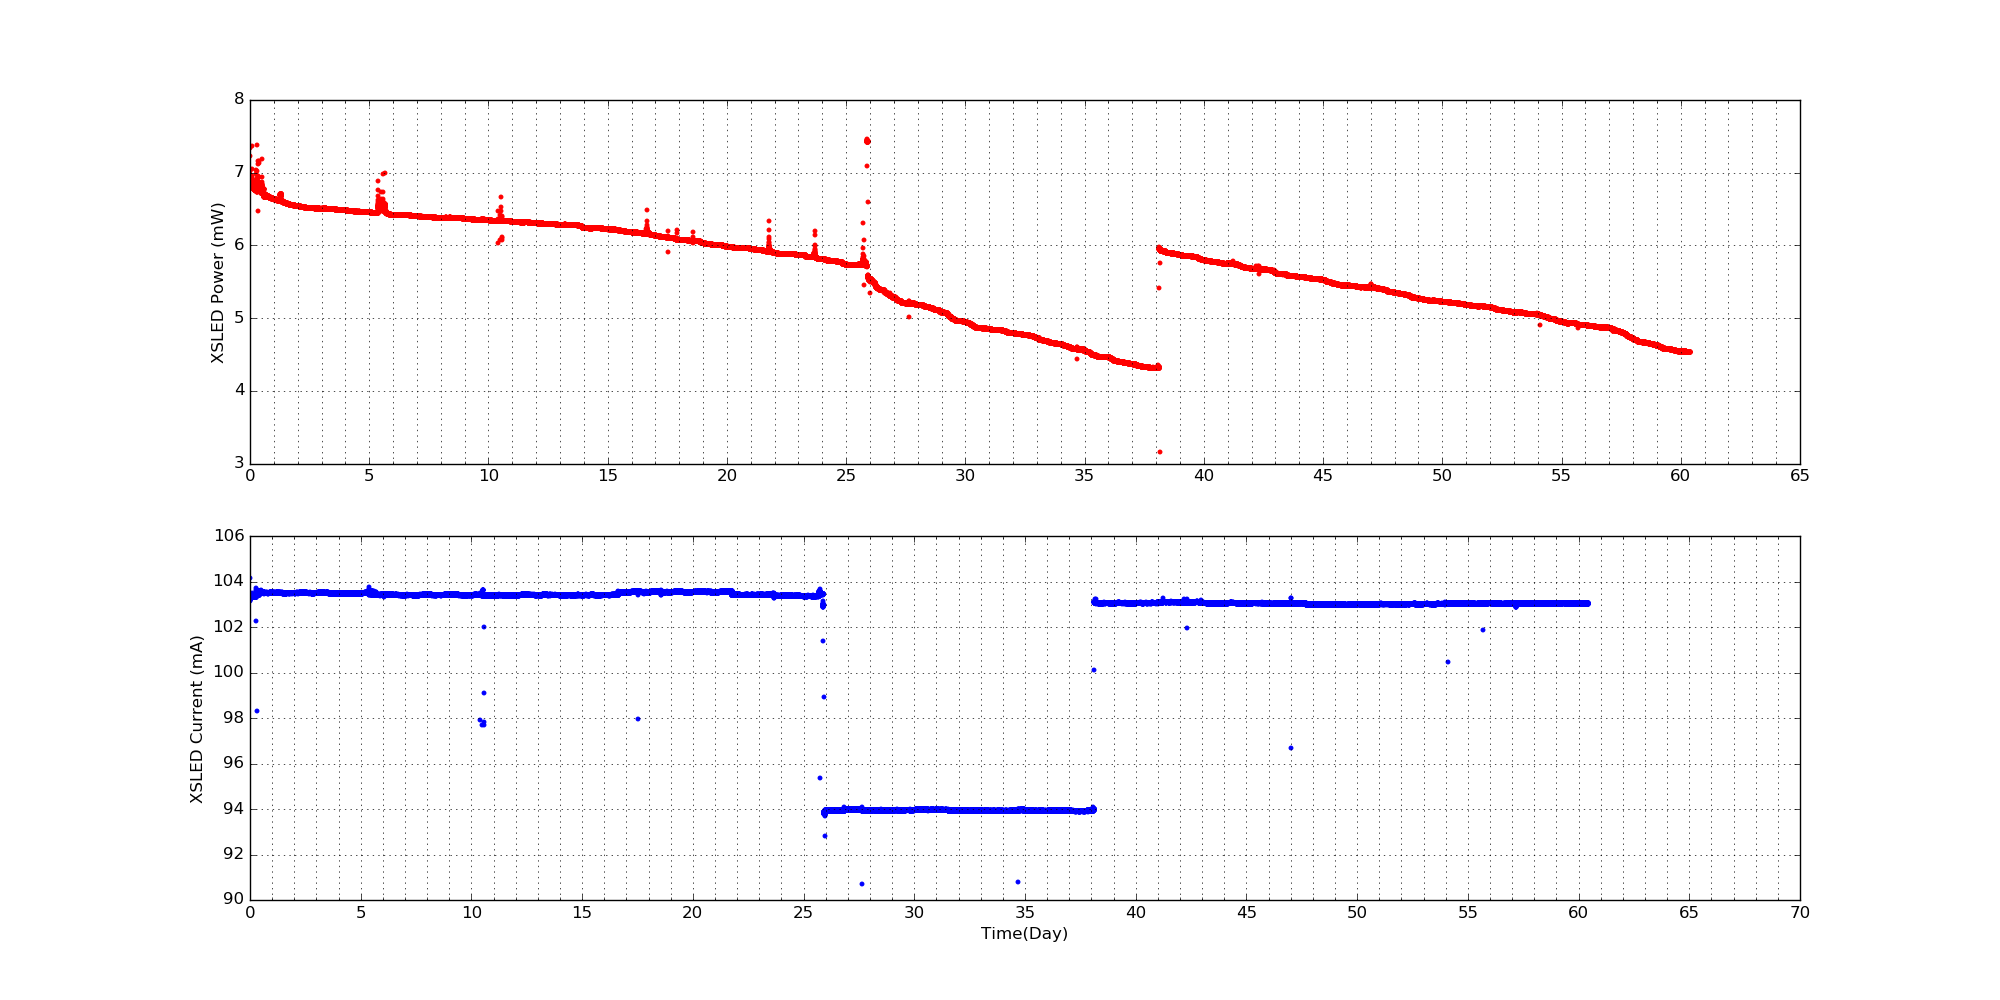
Here are plots with correct Y-axes labels. Sorry about that.

J. Kissel, B. Weaver, H. Radkins, D. Barker, J. Batch

Here's a list of all of the upgrades we were involved in today. There will be more details of the upgrade, more debugging, associated MEDM screen changes, svn commits, and other clean up tomorrow as we continue to explore what we've installed and debug. Bear with us, and thanks for your patience.

1) Fixed UIM coil driver path's automatic compensation bug by updating CD_STATE_MACHINE.c. See Int. Issue 1178.
2) Installed ISI GS13's projection to SUSPOINT Euler basis projection into the SEI models. See ECR E1600028.
3) Sent the Euler Basis Longitudinal DOF for each SUS involved in a cavity over various IPC (PCIE and RFM) and models (ISI, End-station PEM, H1OAF) to be collected in OAF. See ECR E1600028.
8) Removed the excess RFM channels from End-Station ALS models (noteably *not* the excess channels in the ISC models). This made room for 3). See LHO aLOG 25216
4) Added various rotational sensor correction paths to the BSC ISIs (GND BRS to ST1, and ST1 to ST2). (Prototyping, this stuff, no ECRs just yet)
5) Removed the L4C sensor correction path. See SEI aLOG 666
6) Added new infrastructure for the EY BRS. (Most Copied from EX, covered by ECR E1500246)
7) Reverted the BSC SUS's coil driver monitors to store the NOISEMON in the frames (and pushed the FASTIMON to the commissioning frames). Also, we put filter modules in front of the NOISEMONs (like was done for the FASTIMONs the last time we touched this) in case we ever wish to calibrate them. See ECR E1600033 and LHO aLOG 26313

Because we haven't built MEDM screens and actually *used* any of these paths yet, there's still potential for bugs and we haven't explored and/or fixed all of the collateral damage. Stay tuned as we continue to work on all of these updates tomorrow.
J. Kissel

I've documented all of the front-end model changes that were necessary for items 2, 3, 5, 6, and 7 (i.e. all of the SEI model changes). Check out G1600795.

As indicated in LHO aLOG 26321, all of the simulink model changes have been committed to the repository.
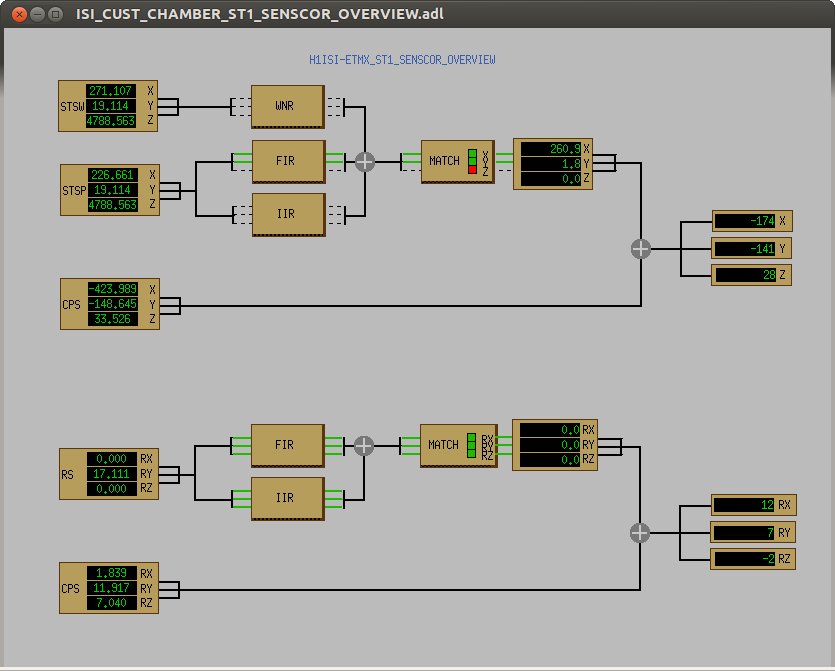
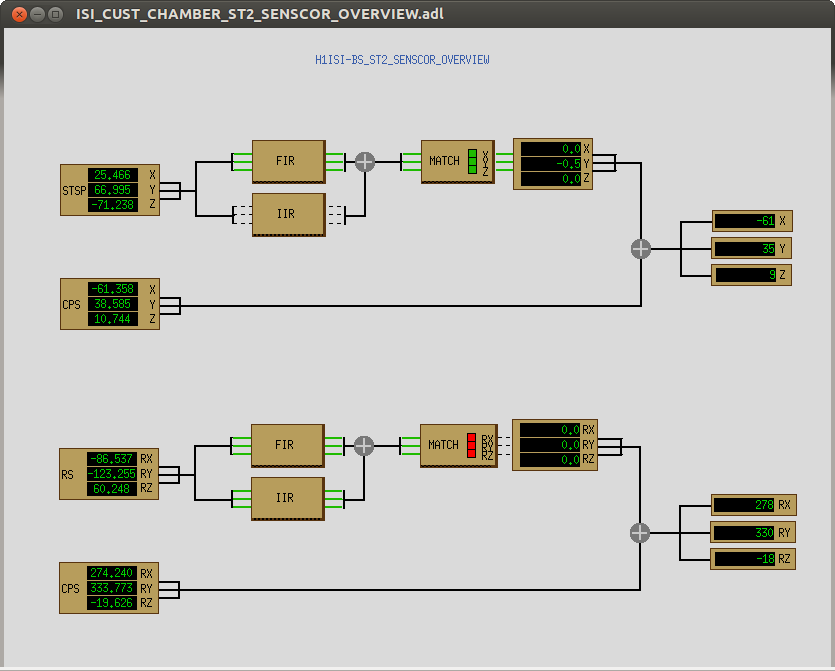
J. Kissel, H. Radkins

Here're the updated MEDM screens that correspond to the above SEI model updates.

I'll work on the Cavity Basis OAF MEDM screen tomorrow.


The following screens where changed and/or added:
/opt/rtcds/userapps/release/isi/common/medm/bscisi
A         ISI_CUST_CHAMBER_ST1_ROT_SENSCOR_FIR_ALL.adl
A         ISI_CUST_CHAMBER_ST1_ROT_SENSCOR_IIRHP_ALL.adl
A         ISI_CUST_CHAMBER_ST1_ROT_SENSCOR_MATCH_ALL.adl
A         ISI_CUST_CHAMBER_ST2_ROT_SENSCOR_FIR_ALL.adl
A         ISI_CUST_CHAMBER_ST2_ROT_SENSCOR_IIRHP_ALL.adl
A         ISI_CUST_CHAMBER_ST2_ROT_SENSCOR_MATCH_ALL.adl
Sending        ISI_CUST_CHAMBER_ST1_SENSCOR_OVERVIEW.adl
Sending        ISI_CUST_CHAMBER_ST2_SENSCOR_OVERVIEW.adl
Sending        ISI_CUST_CHAMBER_OVERVIEW.adl=