J. Kissel
ECR E1700387
IIET 9392
WP 11743
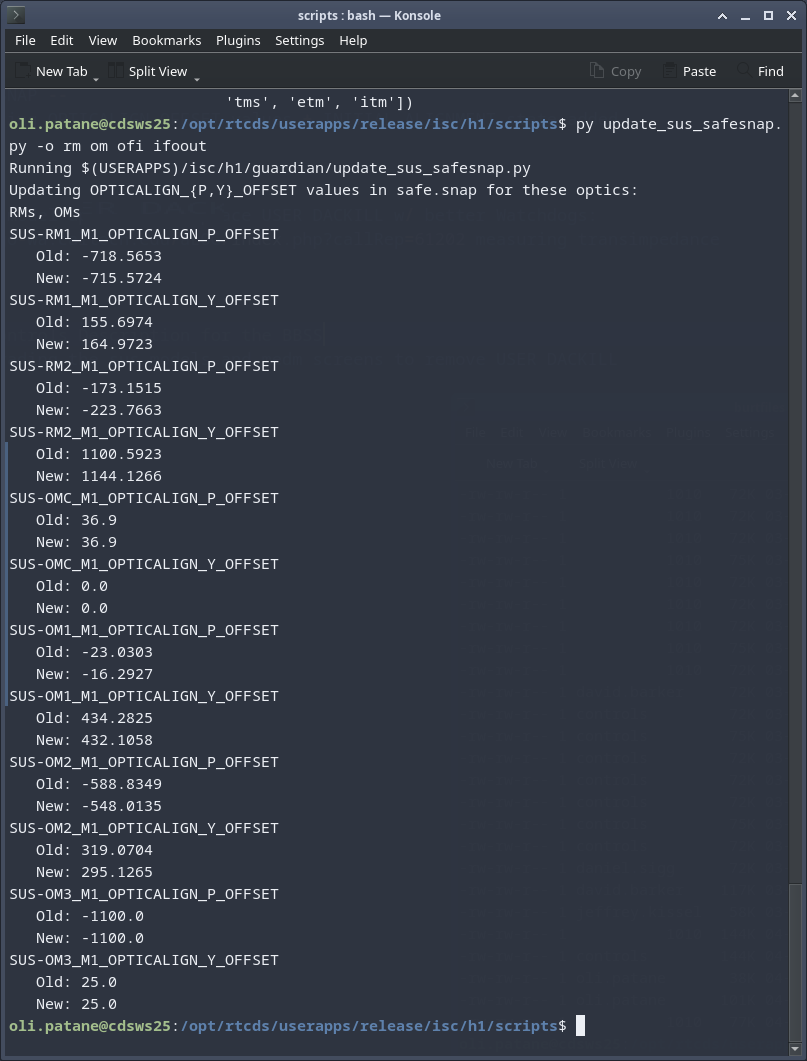
Here, this week we tackle the last of the suspension types that need suspension watchdog upgrades after having finished the End Station, Corner BSC, and HAM Triple suspensions this past month (LHO:76269, LHO:76545, and LHO:76712, respectively).
WP 11797
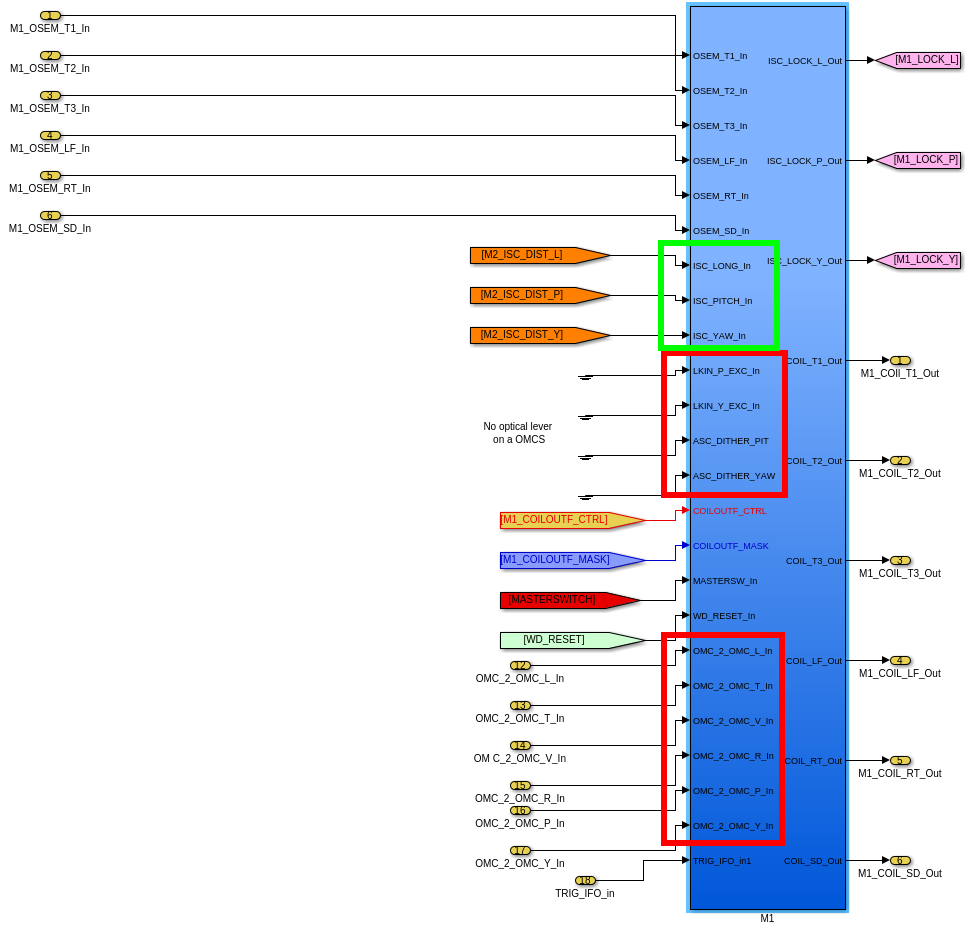
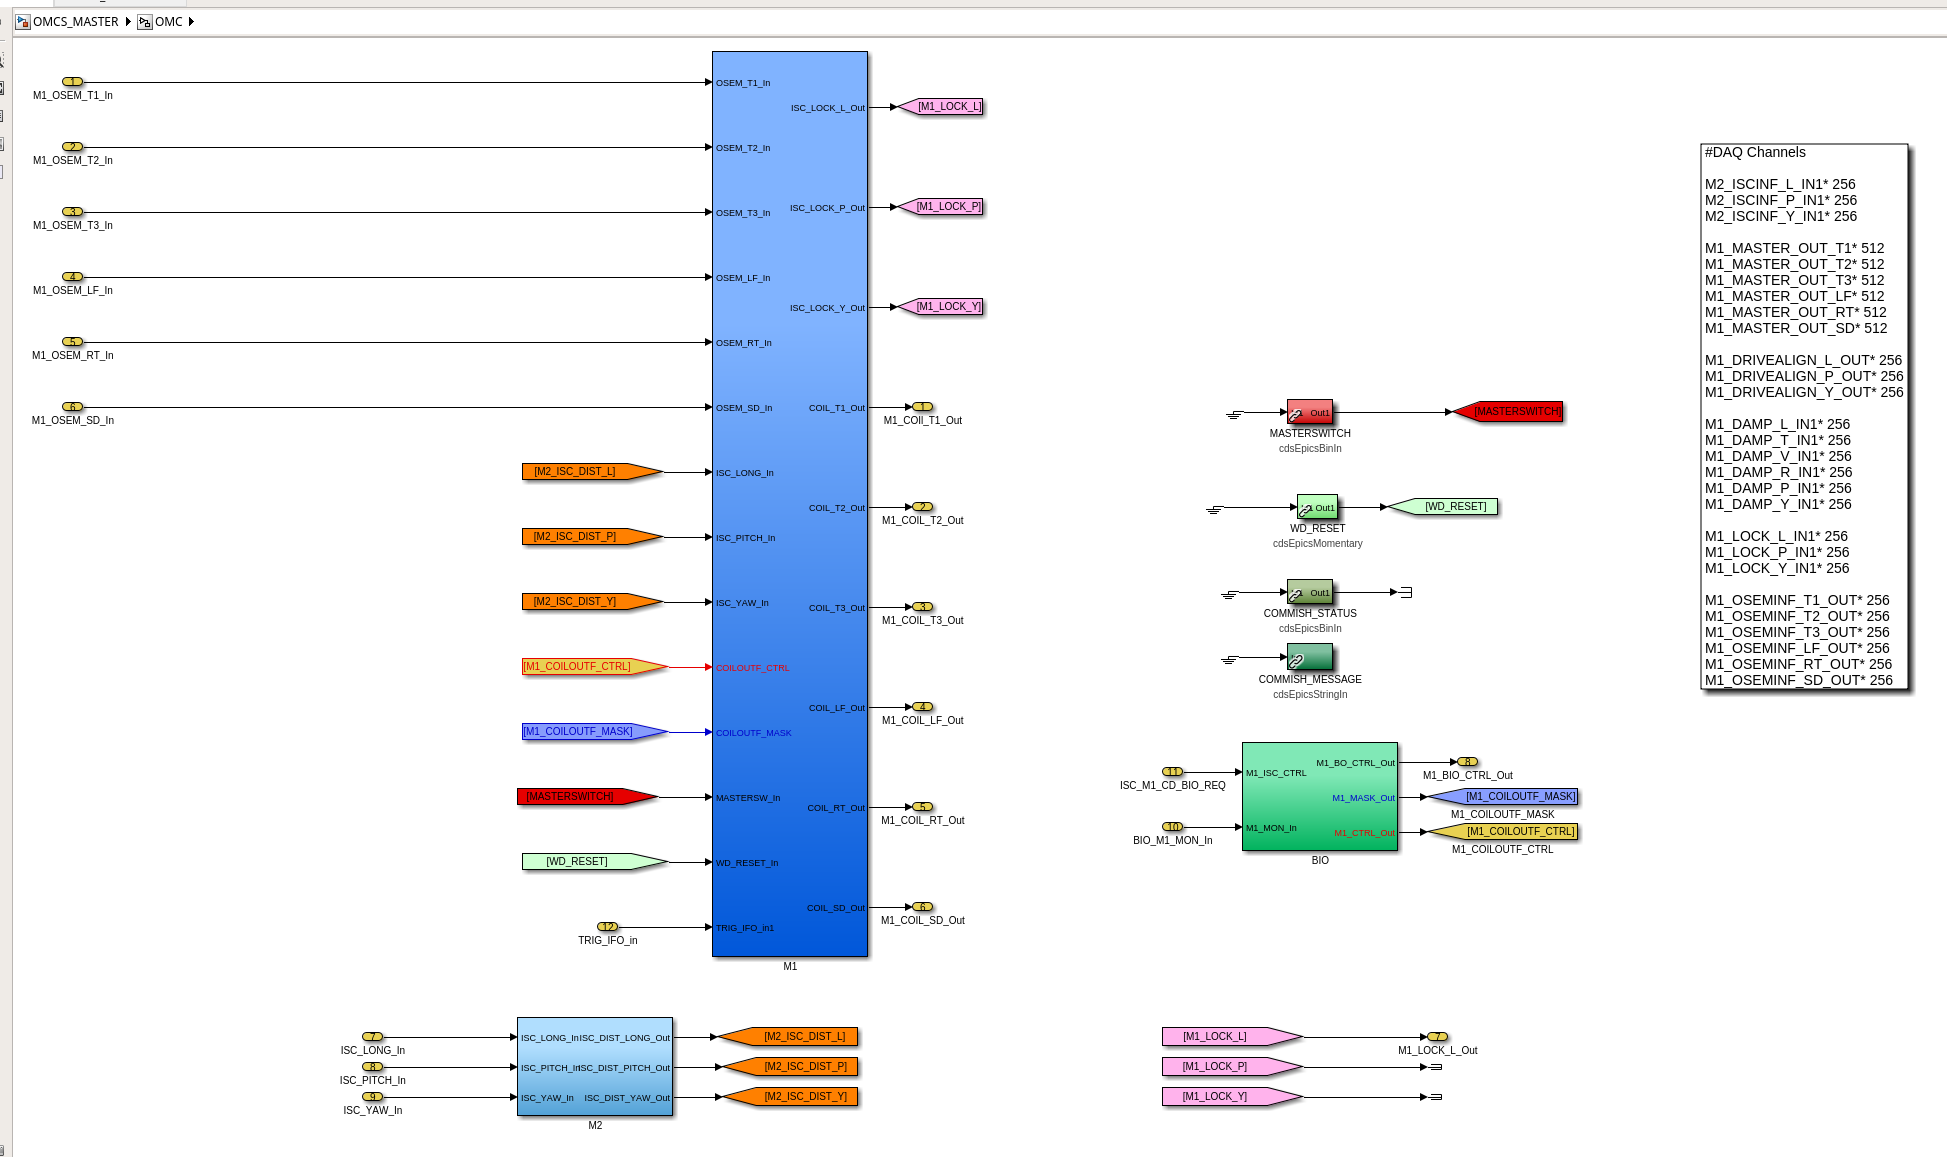
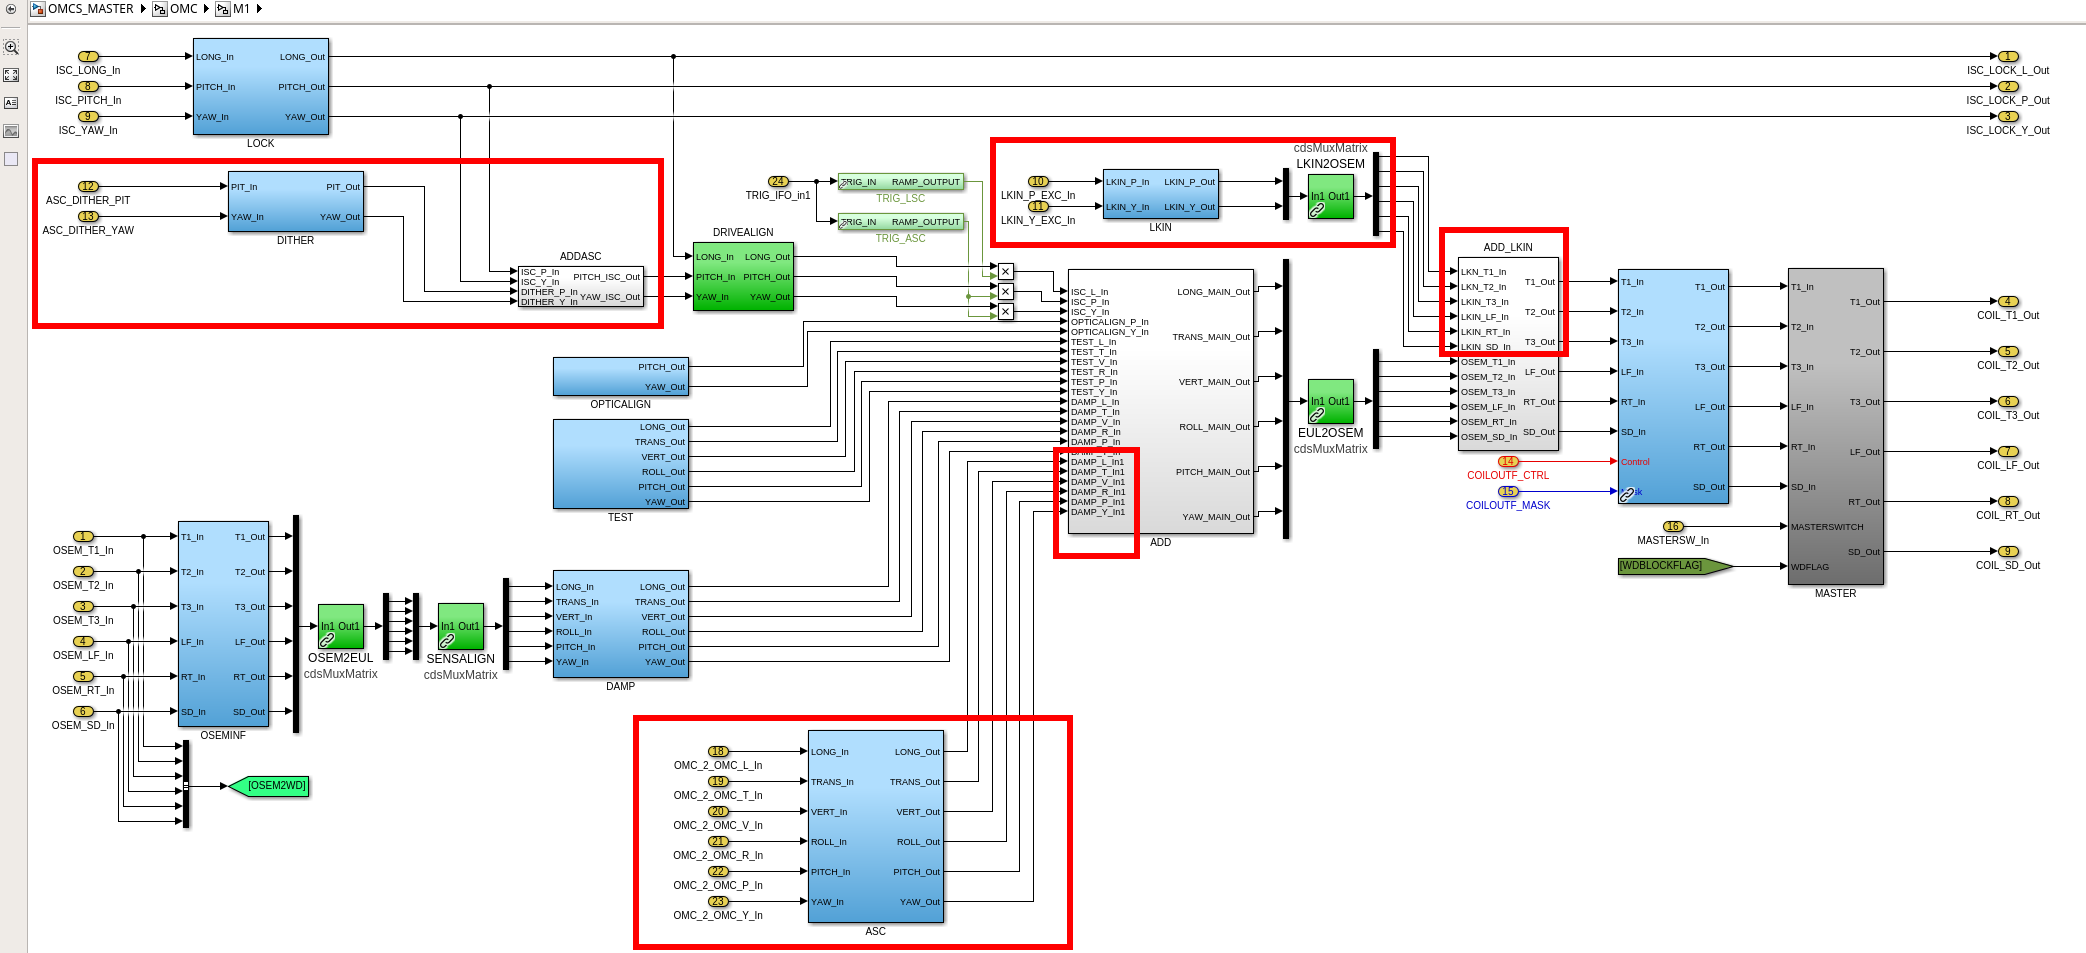
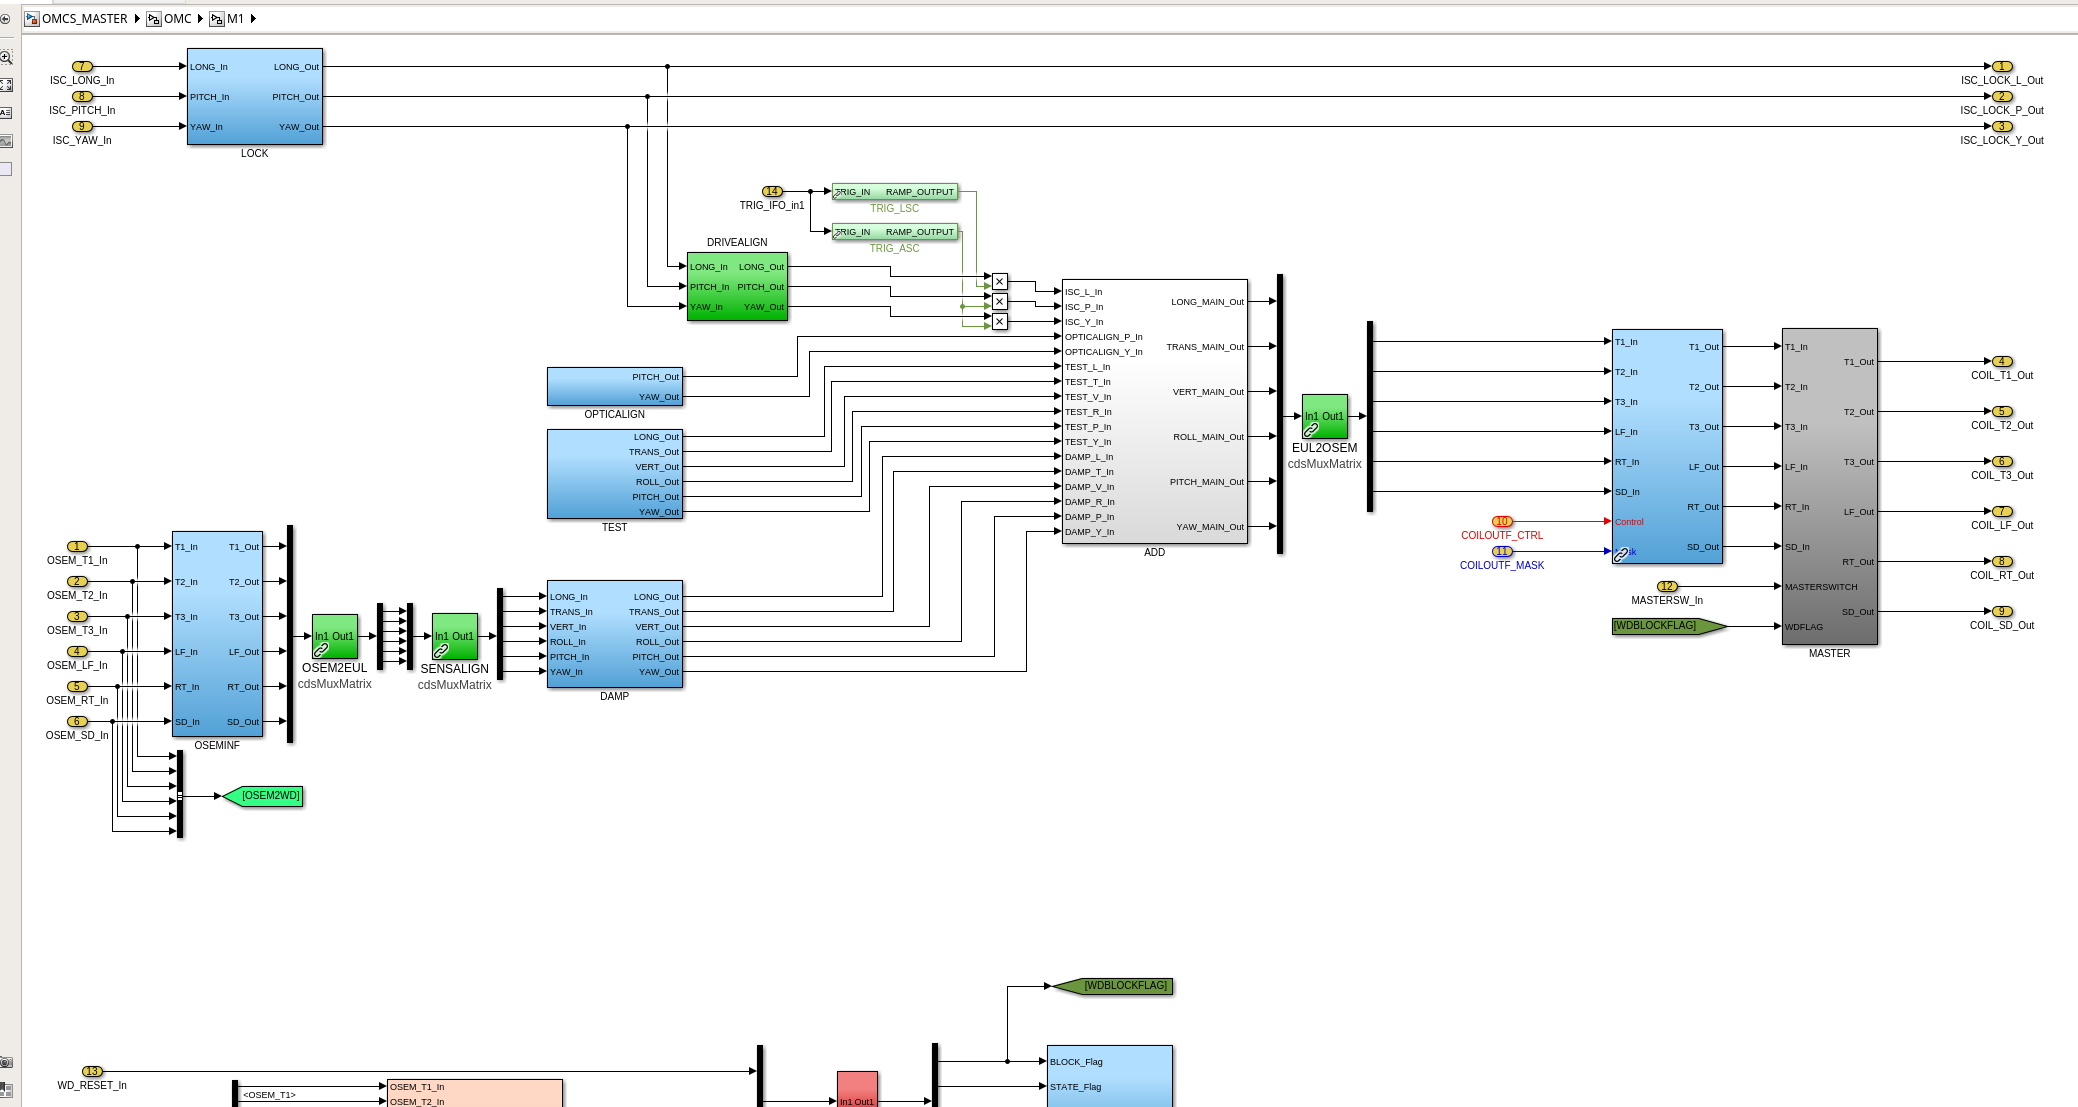
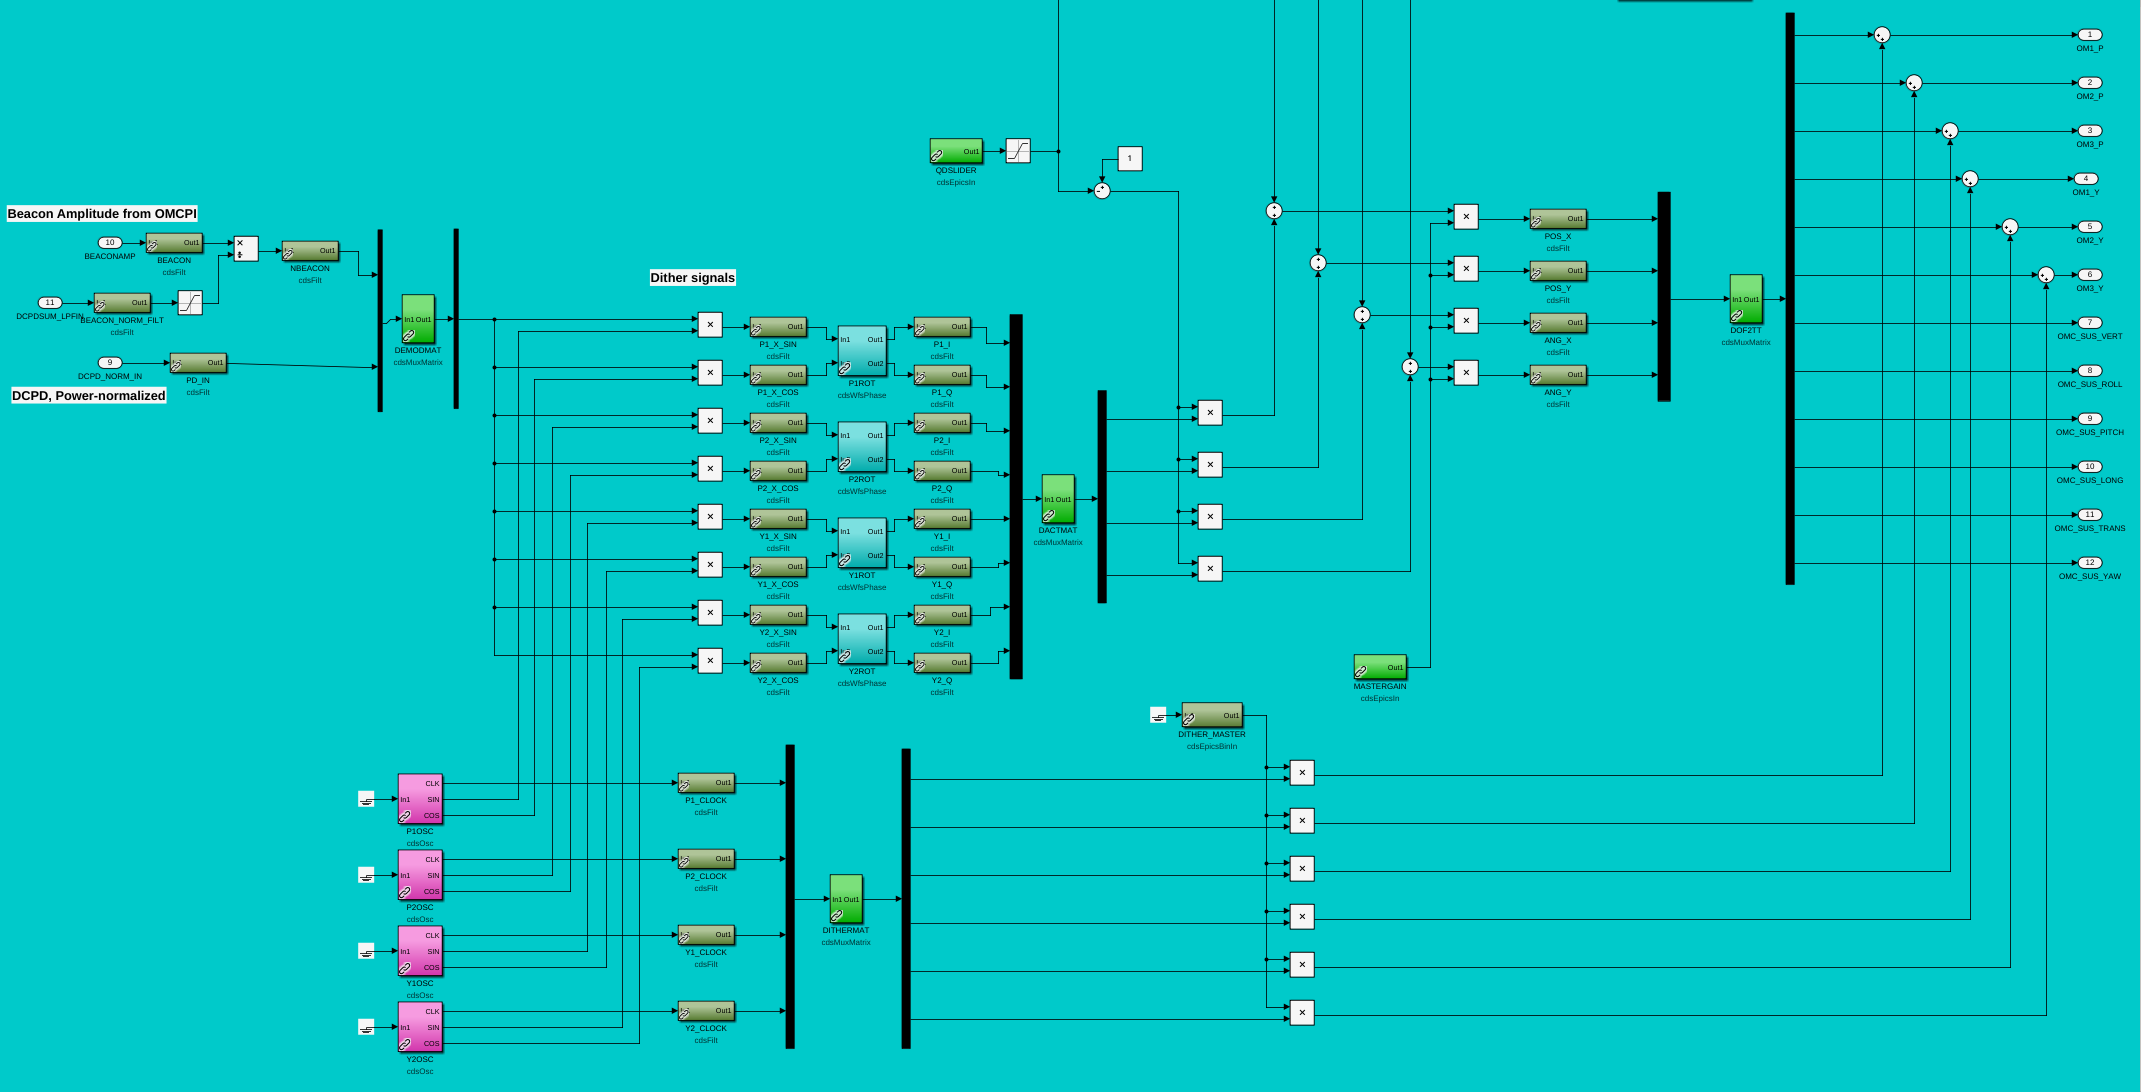
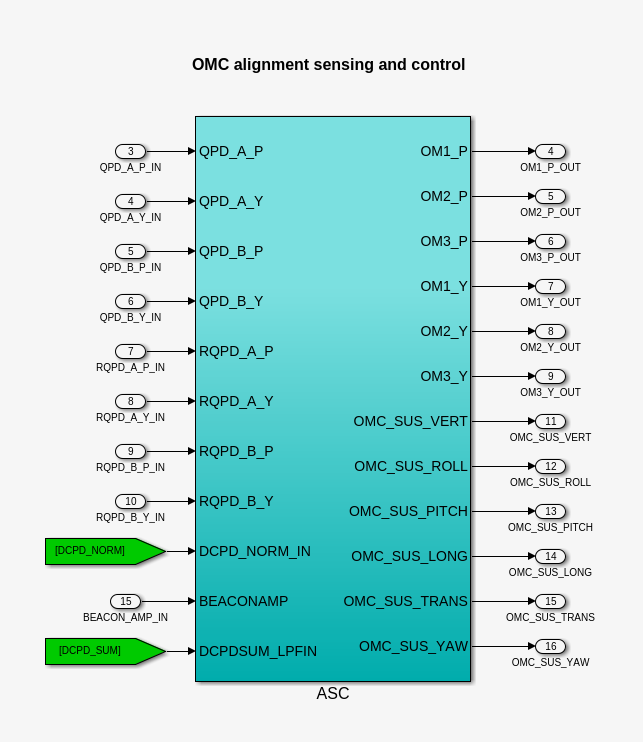
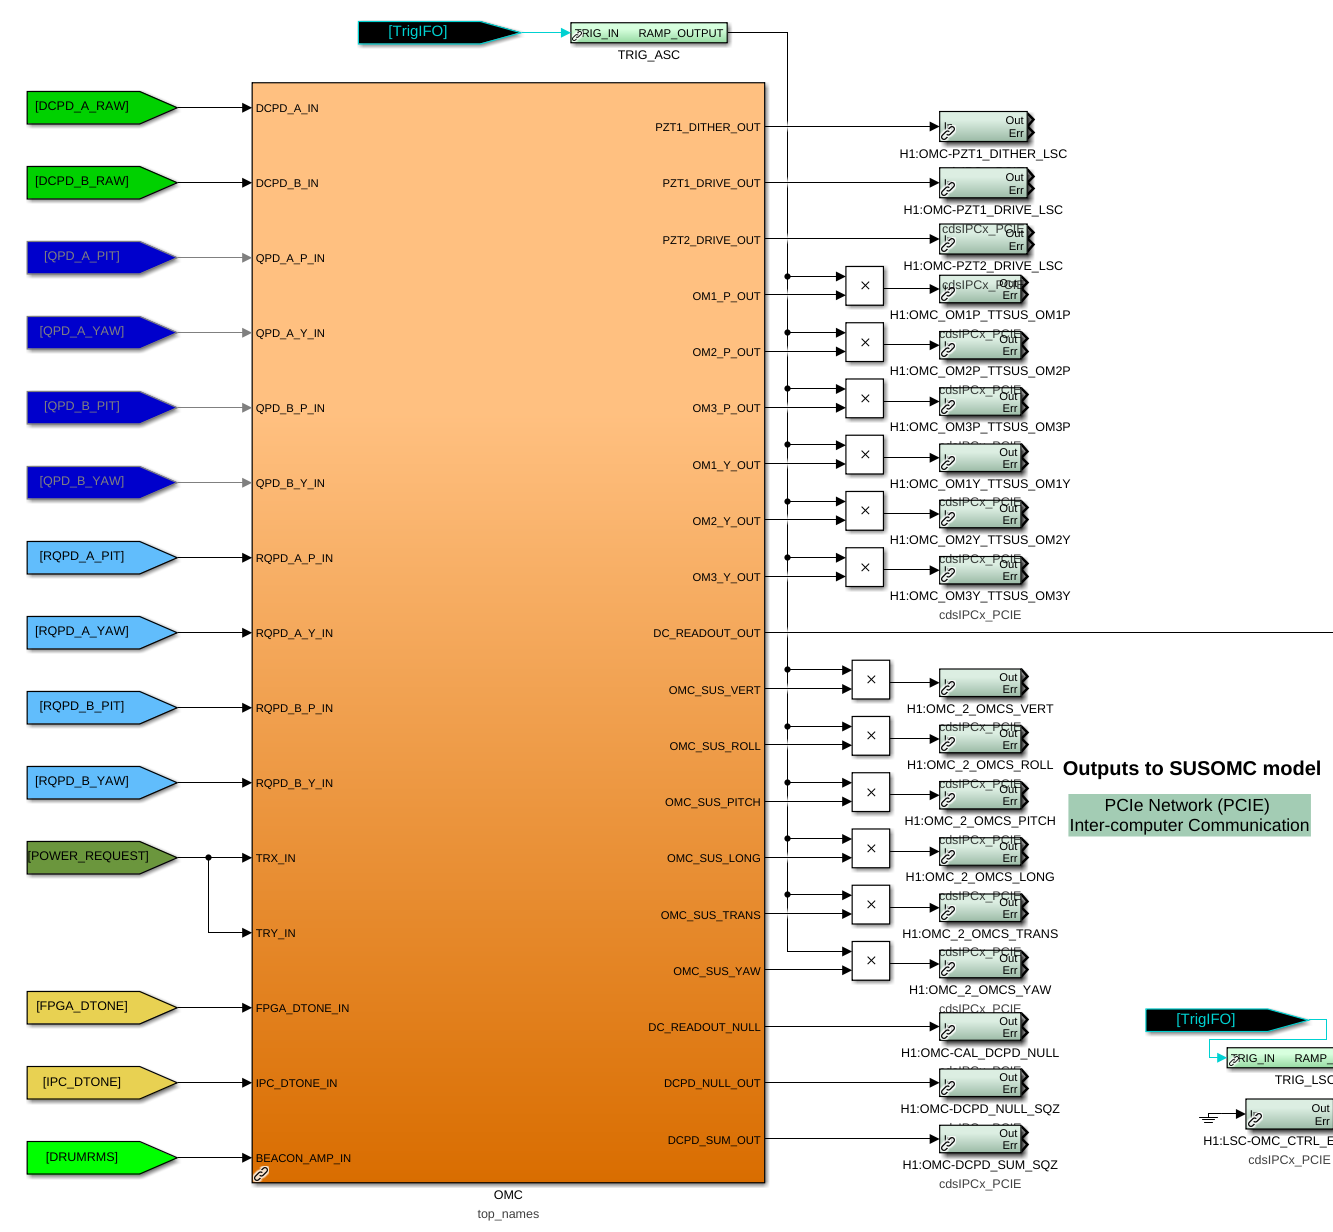
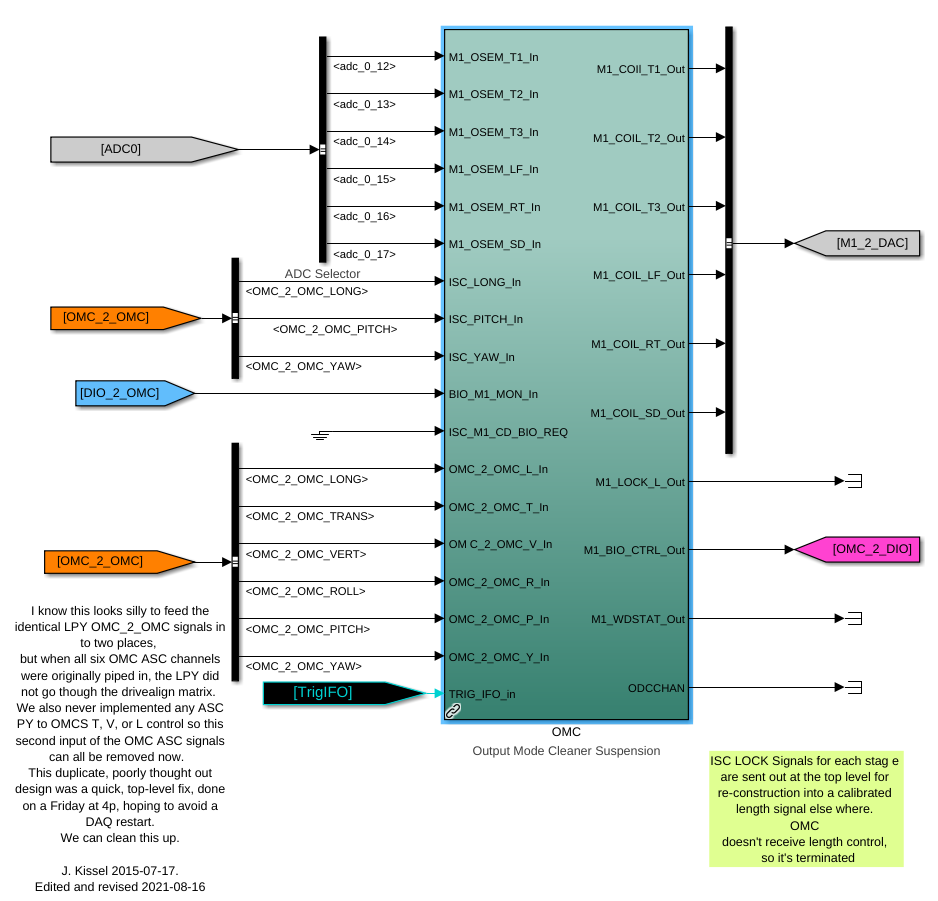
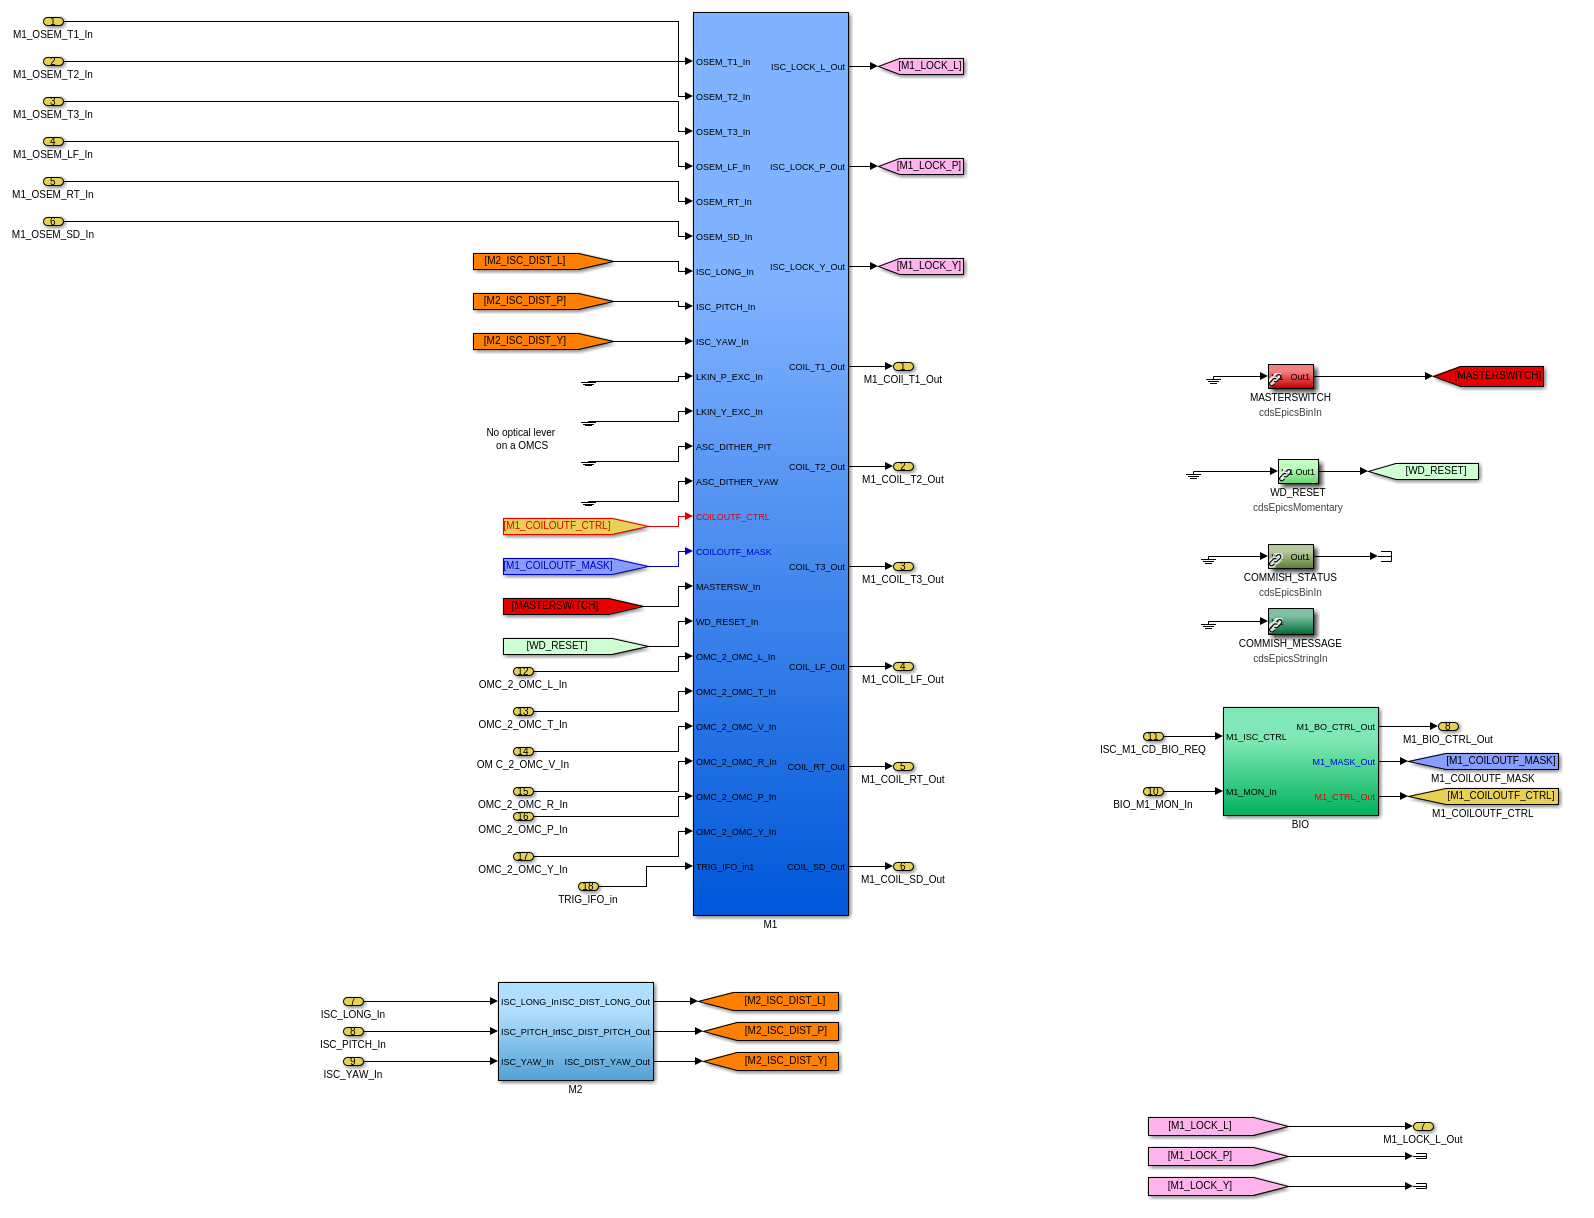
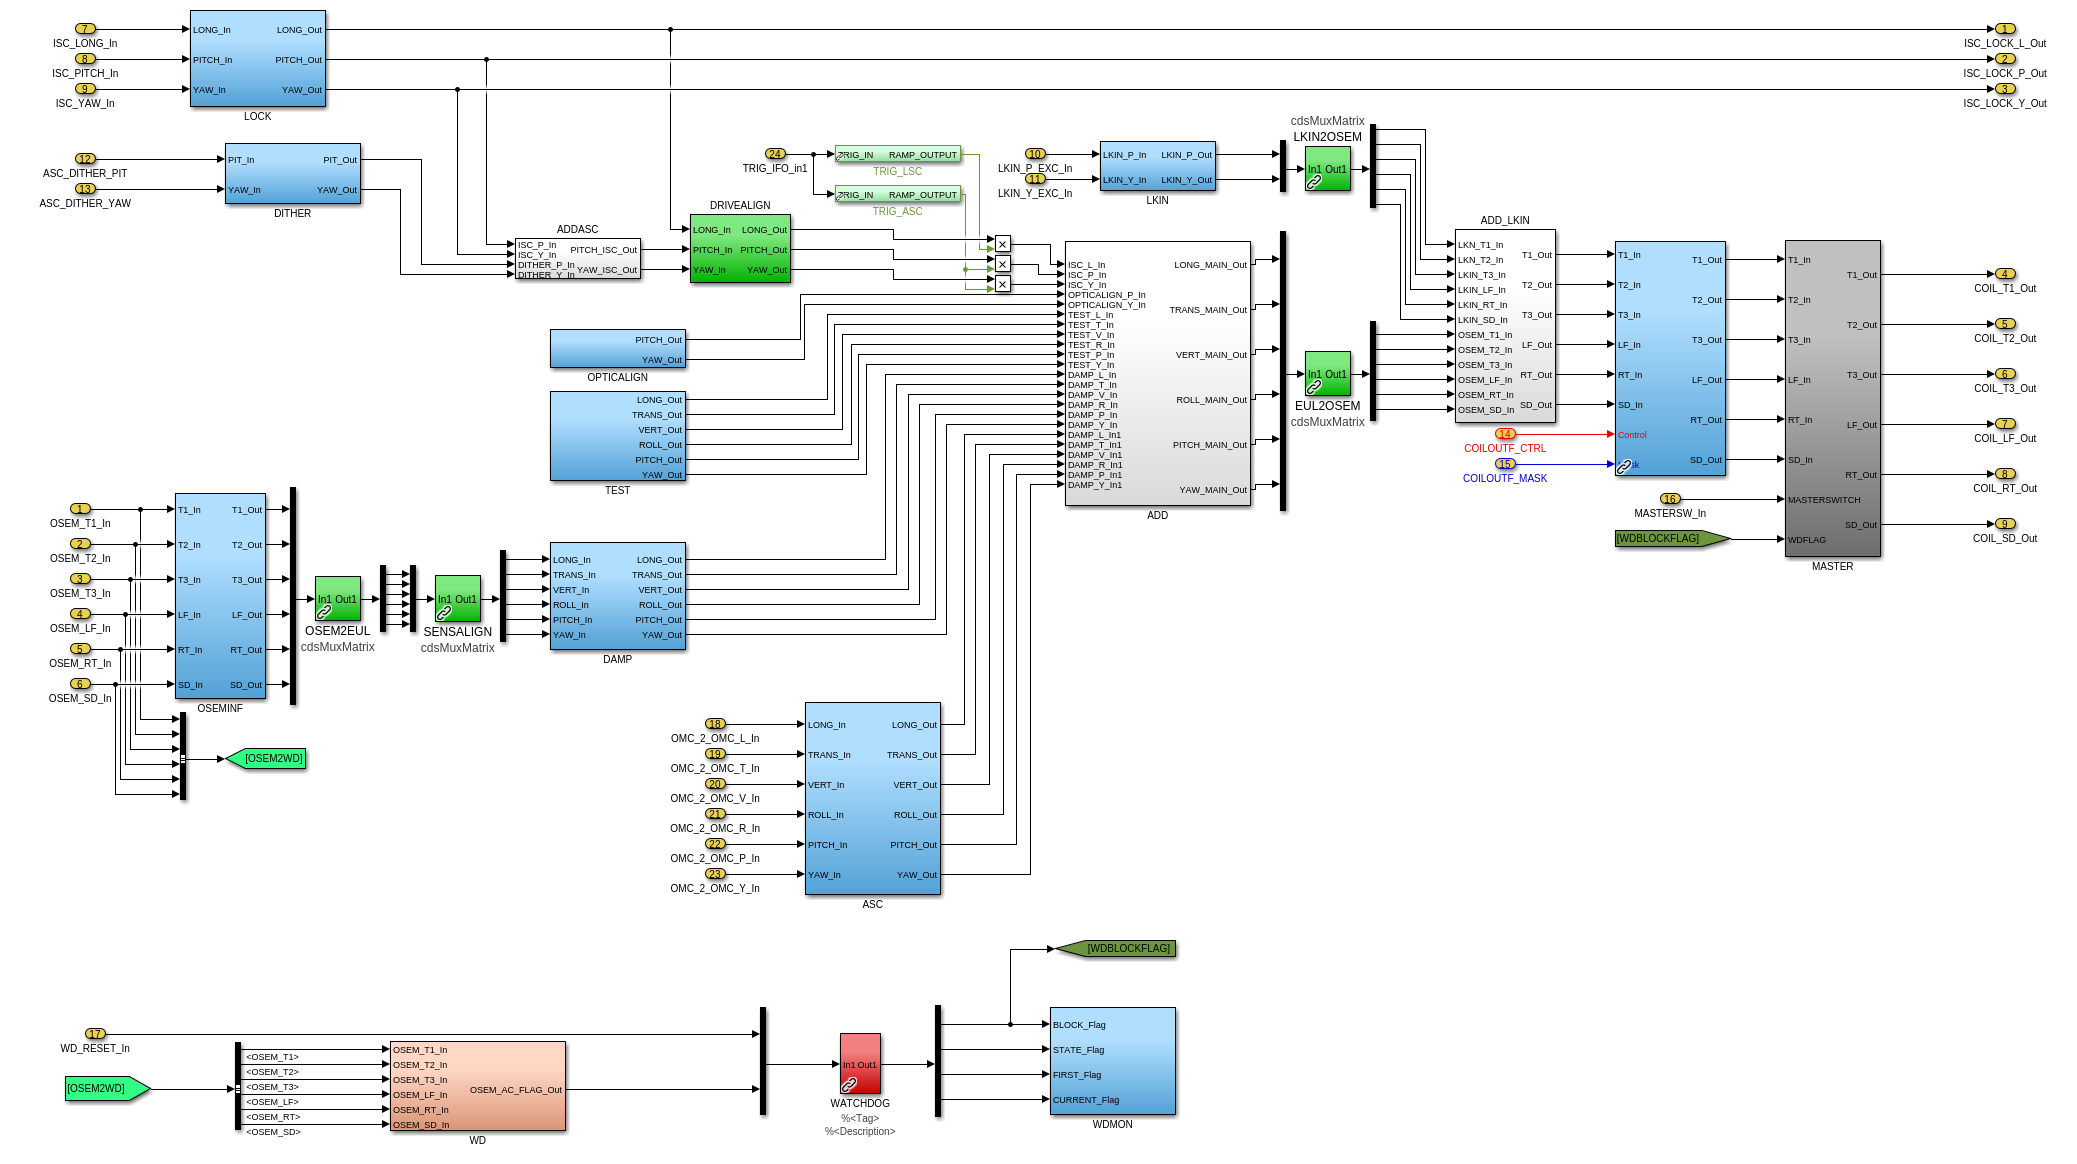
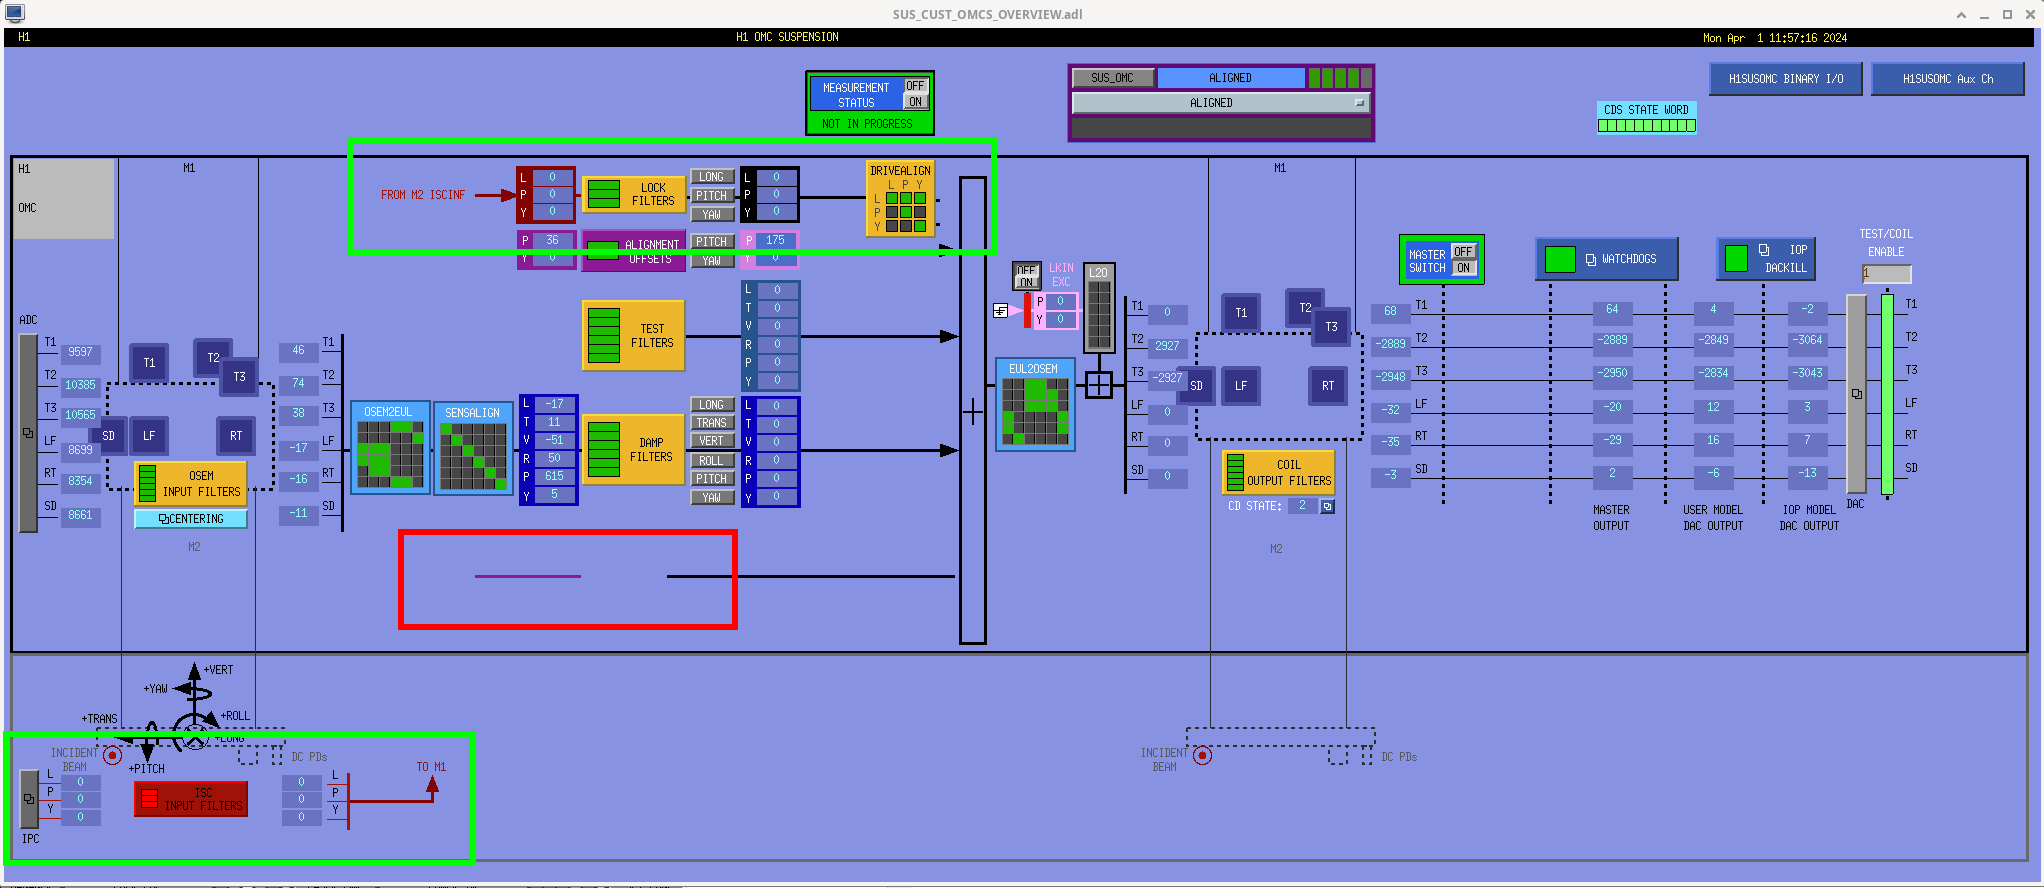
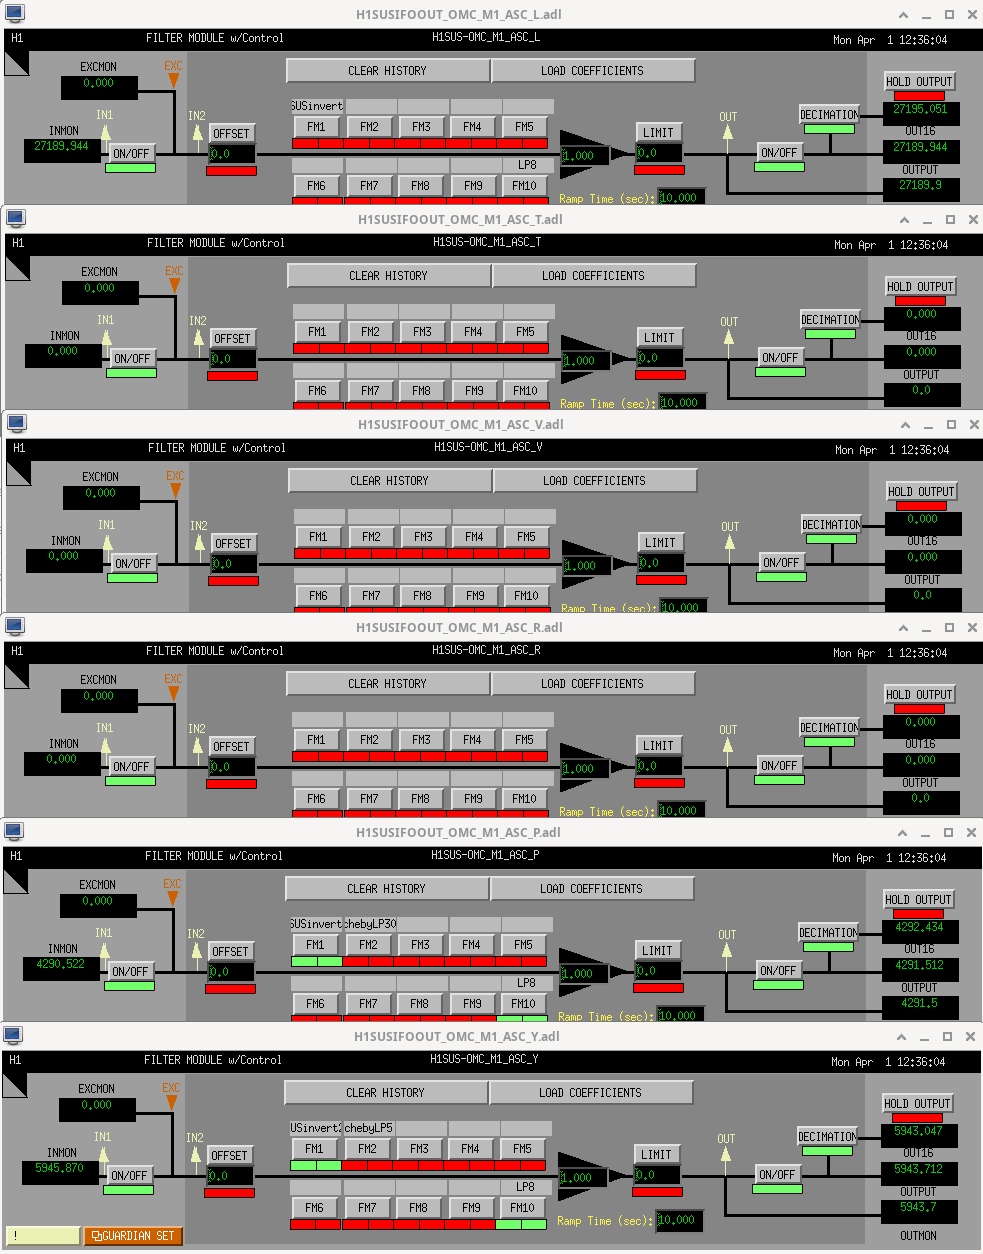
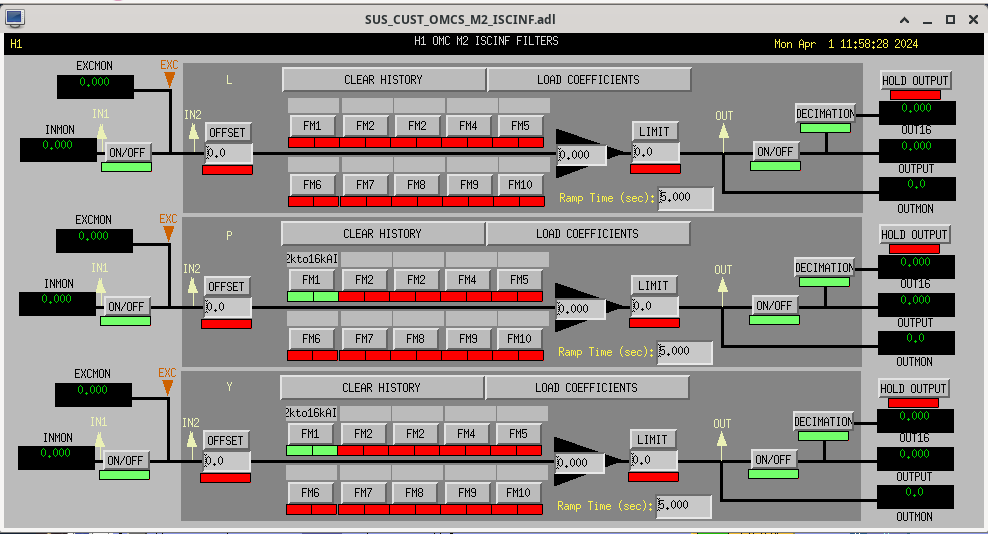
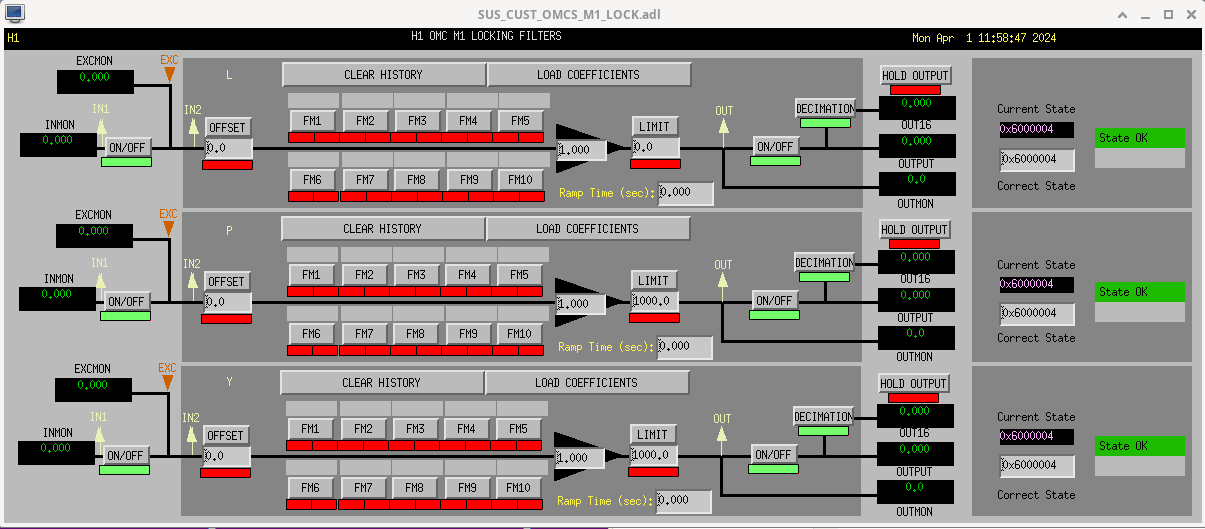
While doing so, I'm also going to address the OMC ASC routing bugs found in the h1susifoout top-level model and its OMCS_MASTER library part (which used to live in h1susomc.mdl), and fix those too.
As such, I'm doing a linear combination of the following changes:
(1) In library part, removed sending watchdog out to top level
(2) In library part, removed ODC parts from DAMP and LOCK banks
(3) In library part, removed never-usered software shutter system
(4) In library part, upgraded watchdog trigger generator to actual functional RMS
(5) At top level, removed USER DACKILL
(6) At top level, removed wires to ground (i.e. things never used) at top-level for WD, SHUTTER, and ODC outputs and SHUTTER input
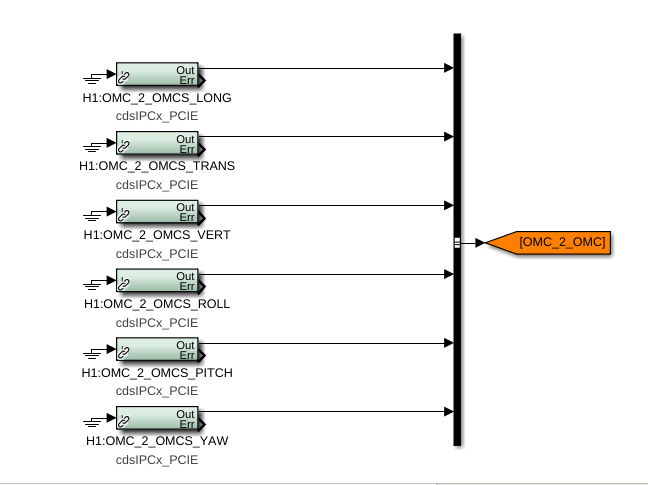
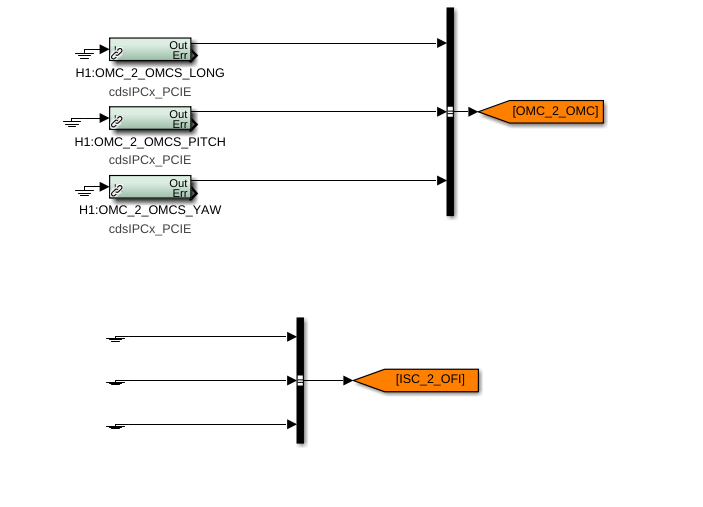
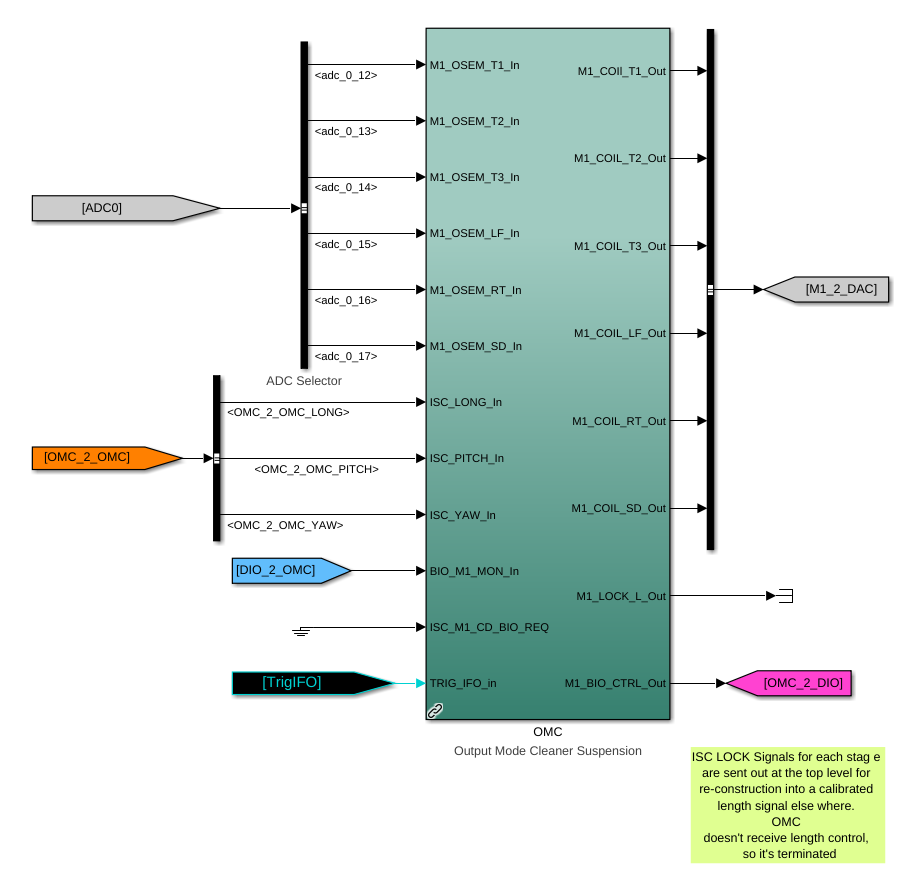
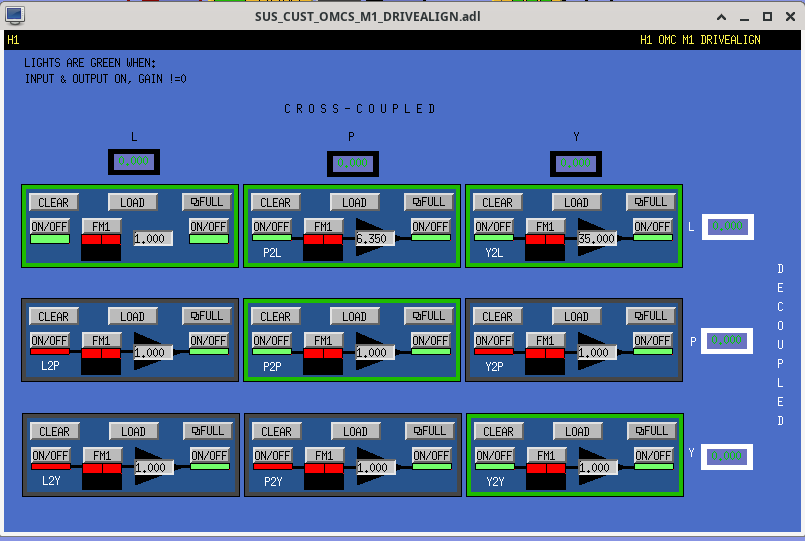
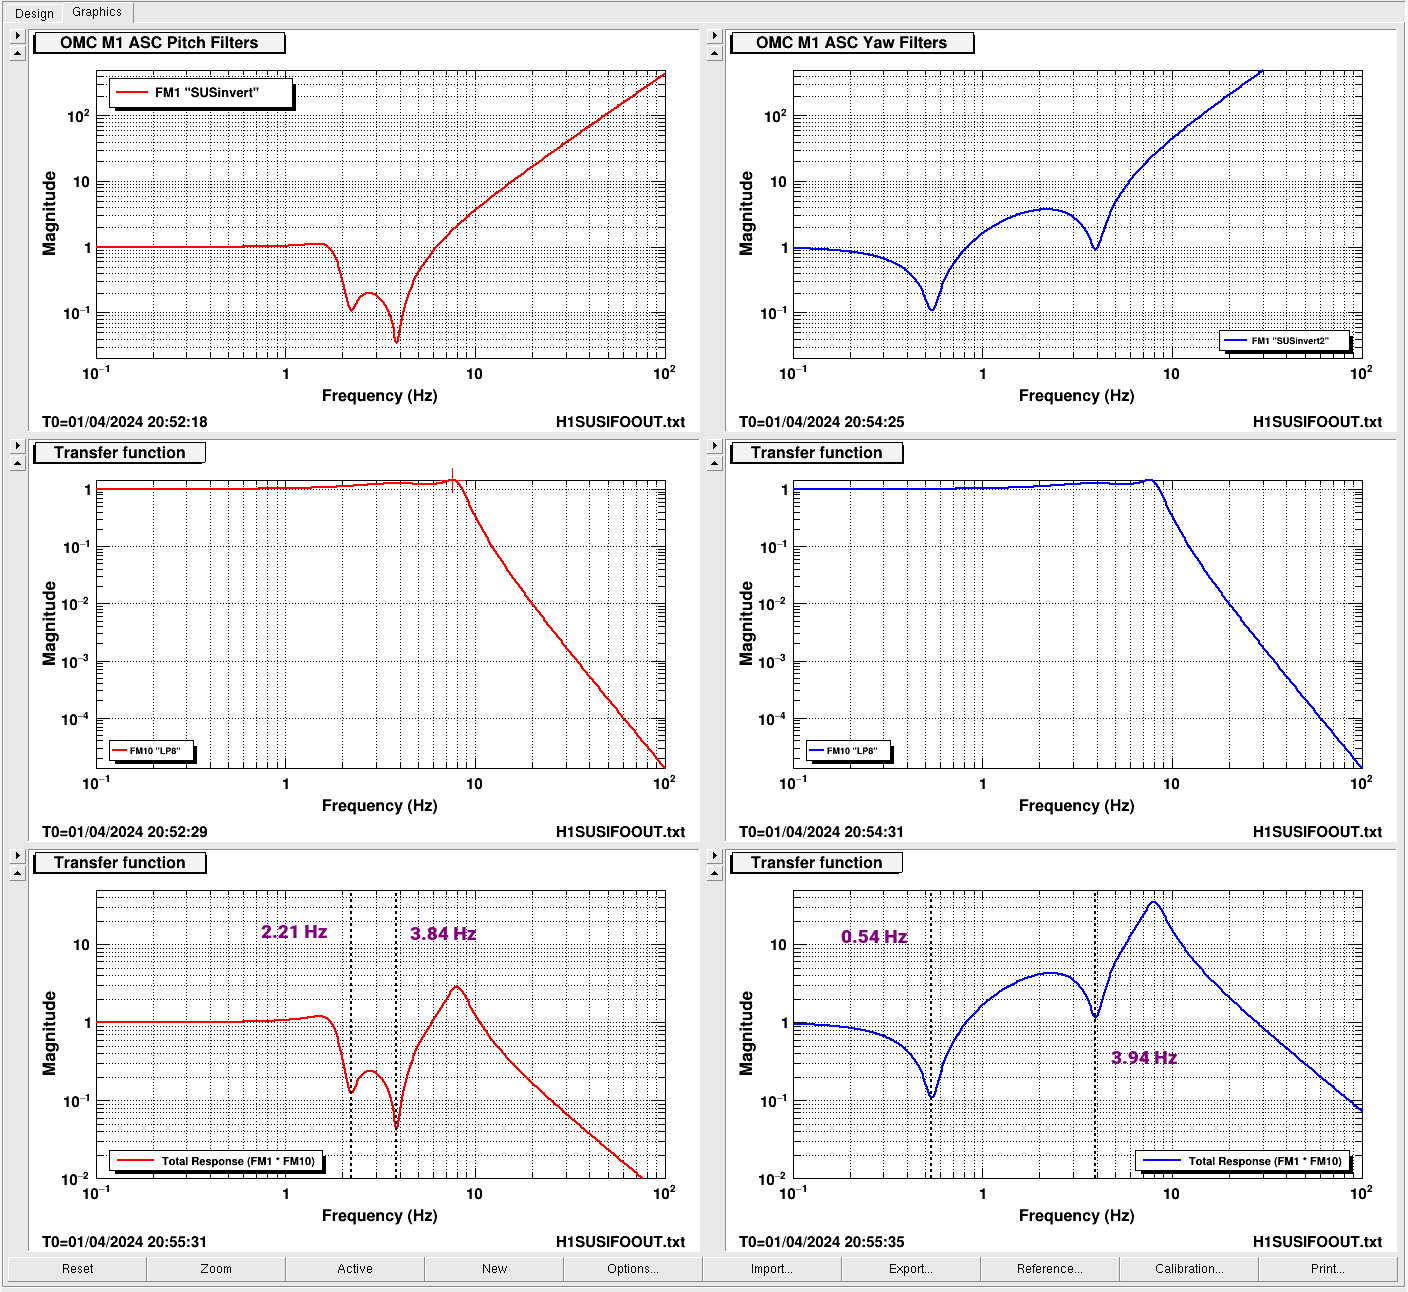
(7) At top level, cleaned up receiving of ISC ASC signals (see discussion in LHO:76842)
Below is the list of models, their respective library parts, and the optics in that model that this impacts, followed by a call out of which of the above changes happened
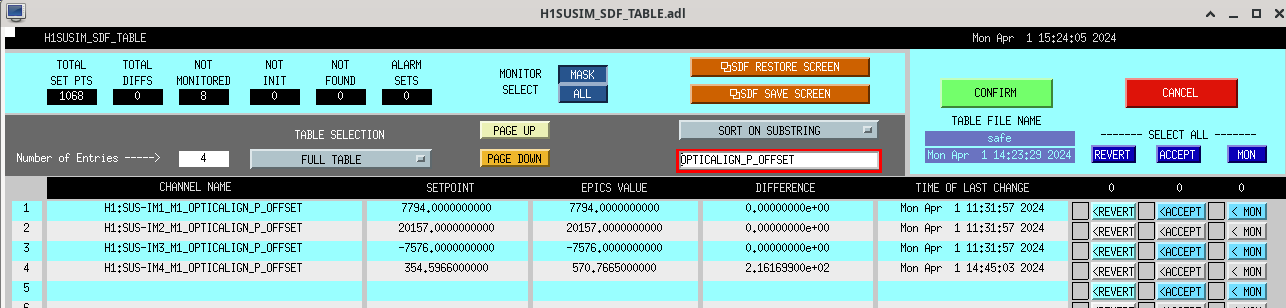
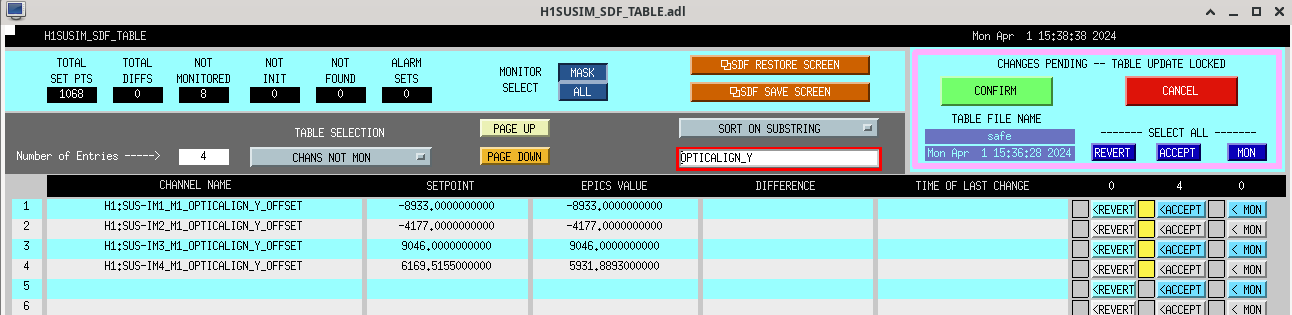
h1susim HSSS_MASTER IM1, IM2, IM3, IM4 (1), (2), (4), (5), (6)
h1sushtts HSSS_FF_MASTER RM1, RM2 (1), (2), (3), (4), (6)
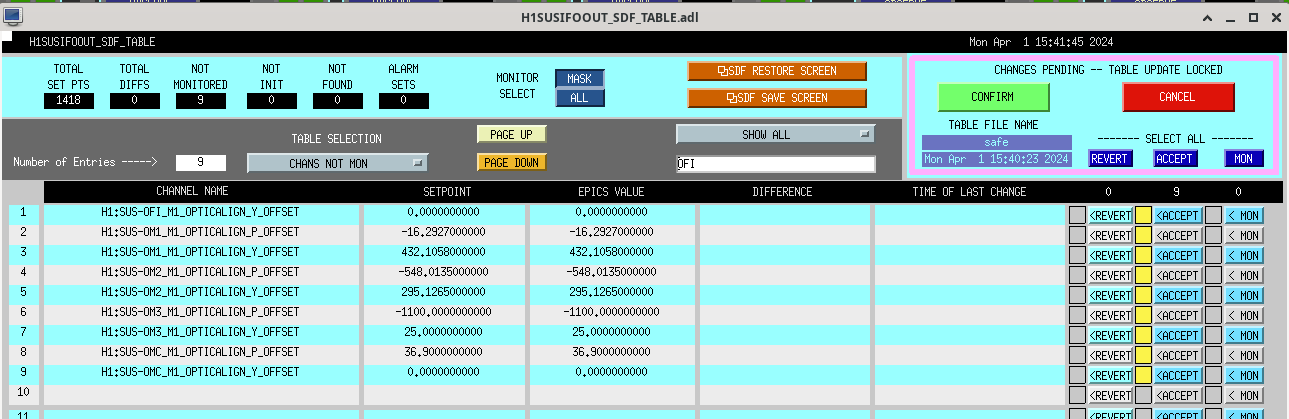
h1susifoout OMCS_MASTER OMC (1), (2), (4), (5), (6), (7)
OFIS_MASTER OFI (1), (2), (4), (6)
HSSS_MASTER OM1, OM2, OM3 (1), (2), (4), (5), (6)
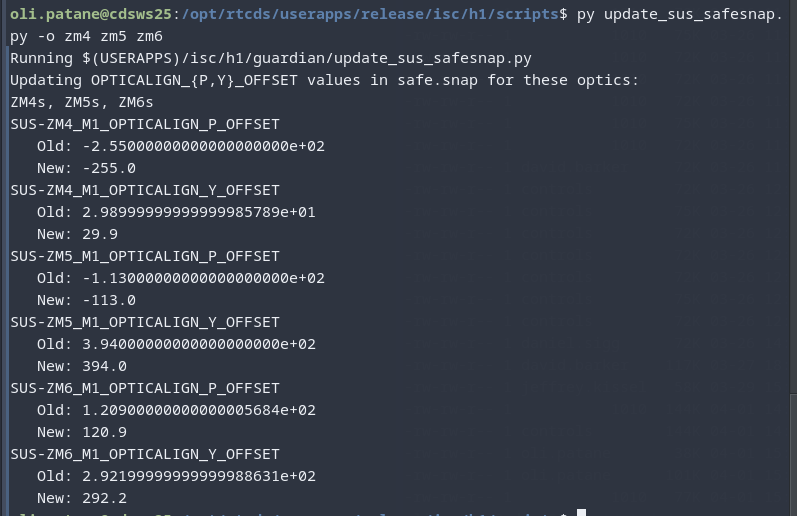
h1sussqzout HSSS_MASTER ZM4, ZM5, ZM6 (1), (2), (4), (5), (6)
h1sussqzin HDDS_MASTER ZM1, ZM3 (1), (4)
OPOS_MASTER OPO (1), (2), (4), (6)
HSSS_MASTER ZM2 (1), (2), (4), (5), (6)
I've test-compiled all of the above listed models, so they're ready for re-compile, install, and restart of the front-end process tomorrow morning.
All model changes have been committed to the userapps repo, either under
/opt/rtcds/userapps/release/sus/h1/models/
/opt/rtcds/userapps/release/sus/common/models/
where the above mentioned models live.
Screenshots describing the changes will be posted in the comments.