Displaying reports 41781-41800 of 88750.Go to page Start 2086 2087 2088 2089 2090 2091 2092 2093 2094 End
Reports until 13:01, Thursday 11 April 2019
H1 OpsInfo
jenne.driggers@LIGO.ORG - posted 13:01, Thursday 11 April 2019 (48417)
Changed DIAG_MAIN threshold for ALS fiber polarization

I have changed the threshold for the fiber polarization notification on DIAG_MAIN from 20% to 25%.  We still aren't sure why we can't get the ALS_X polarization below 20% (I don't think anyone has taken the time to check that no PD calibrations got lost in some reboot, or something like that), but the flashing on/off of the notification on the front wall is obnoxious, since everyone in every GW IFO control room is unhappy when there are flashes (since out of the corner of one's eye they look like a potential lockloss). 

H1 General
travis.sadecki@LIGO.ORG - posted 12:06, Thursday 11 April 2019 - last comment - 13:00, Thursday 11 April 2019(48415)
Out of Observe/Lockloss 19:05 UTC

Commissioners starting injections.

Comments related to this report
travis.sadecki@LIGO.ORG - 13:00, Thursday 11 April 2019 (48416)

Back to NLN at 19:40 and starting injections.

H1 General
travis.sadecki@LIGO.ORG - posted 08:14, Thursday 11 April 2019 (48408)
Ops Day Shift Transition

TITLE: 04/11 Day Shift: 15:00-23:00 UTC (08:00-16:00 PST), all times posted in UTC
STATE of H1: Observing at 109Mpc
OUTGOING OPERATOR: Jim
CURRENT ENVIRONMENT:
    Wind: 4mph Gusts, 2mph 5min avg
    Primary useism: 0.01 μm/s
    Secondary useism: 0.20 μm/s
QUICK SUMMARY:  Lock is ~18 hours old, past ~6 hours in Observing.  

H1 AOS
jim.warner@LIGO.ORG - posted 08:01, Thursday 11 April 2019 (48407)
Shift Summary

TITLE: 04/11 Owl Shift: 07:00-15:00 UTC (00:00-08:00 PST), all times posted in UTC
STATE of H1: Observing at 108Mpc
INCOMING OPERATOR: Travis
SHIFT SUMMARY:
LOG:

8:30 6.0 Earthquake in Japan, out of observing into earthquake modes for around an hour, IFO stays locked

9:30 Out of observing to turn yaw ads back on, was left off after work earlier in the day, LLO and Virgo were both down at this point any way.


LHO General
thomas.shaffer@LIGO.ORG - posted 00:00, Thursday 11 April 2019 (48401)
Ops Eve Shit Summary

TITLE: 04/11 Eve Shift: 23:00-07:00 UTC (16:00-00:00 PST), all times posted in UTC
STATE of H1: Observing at 110Mpc
INCOMING OPERATOR: Jim
SHIFT SUMMARY: TCS SR3 heater measurements taking us out of observing for short periods, but we are still riding a 10hr lock.
LOG:

H1 TCS (AOS, AWC, ISC, TCS)
georgia.mansell@LIGO.ORG - posted 23:28, Wednesday 10 April 2019 - last comment - 18:58, Monday 22 April 2019(48406)
SR3 heater steps down

Craig, Danny, Georgia

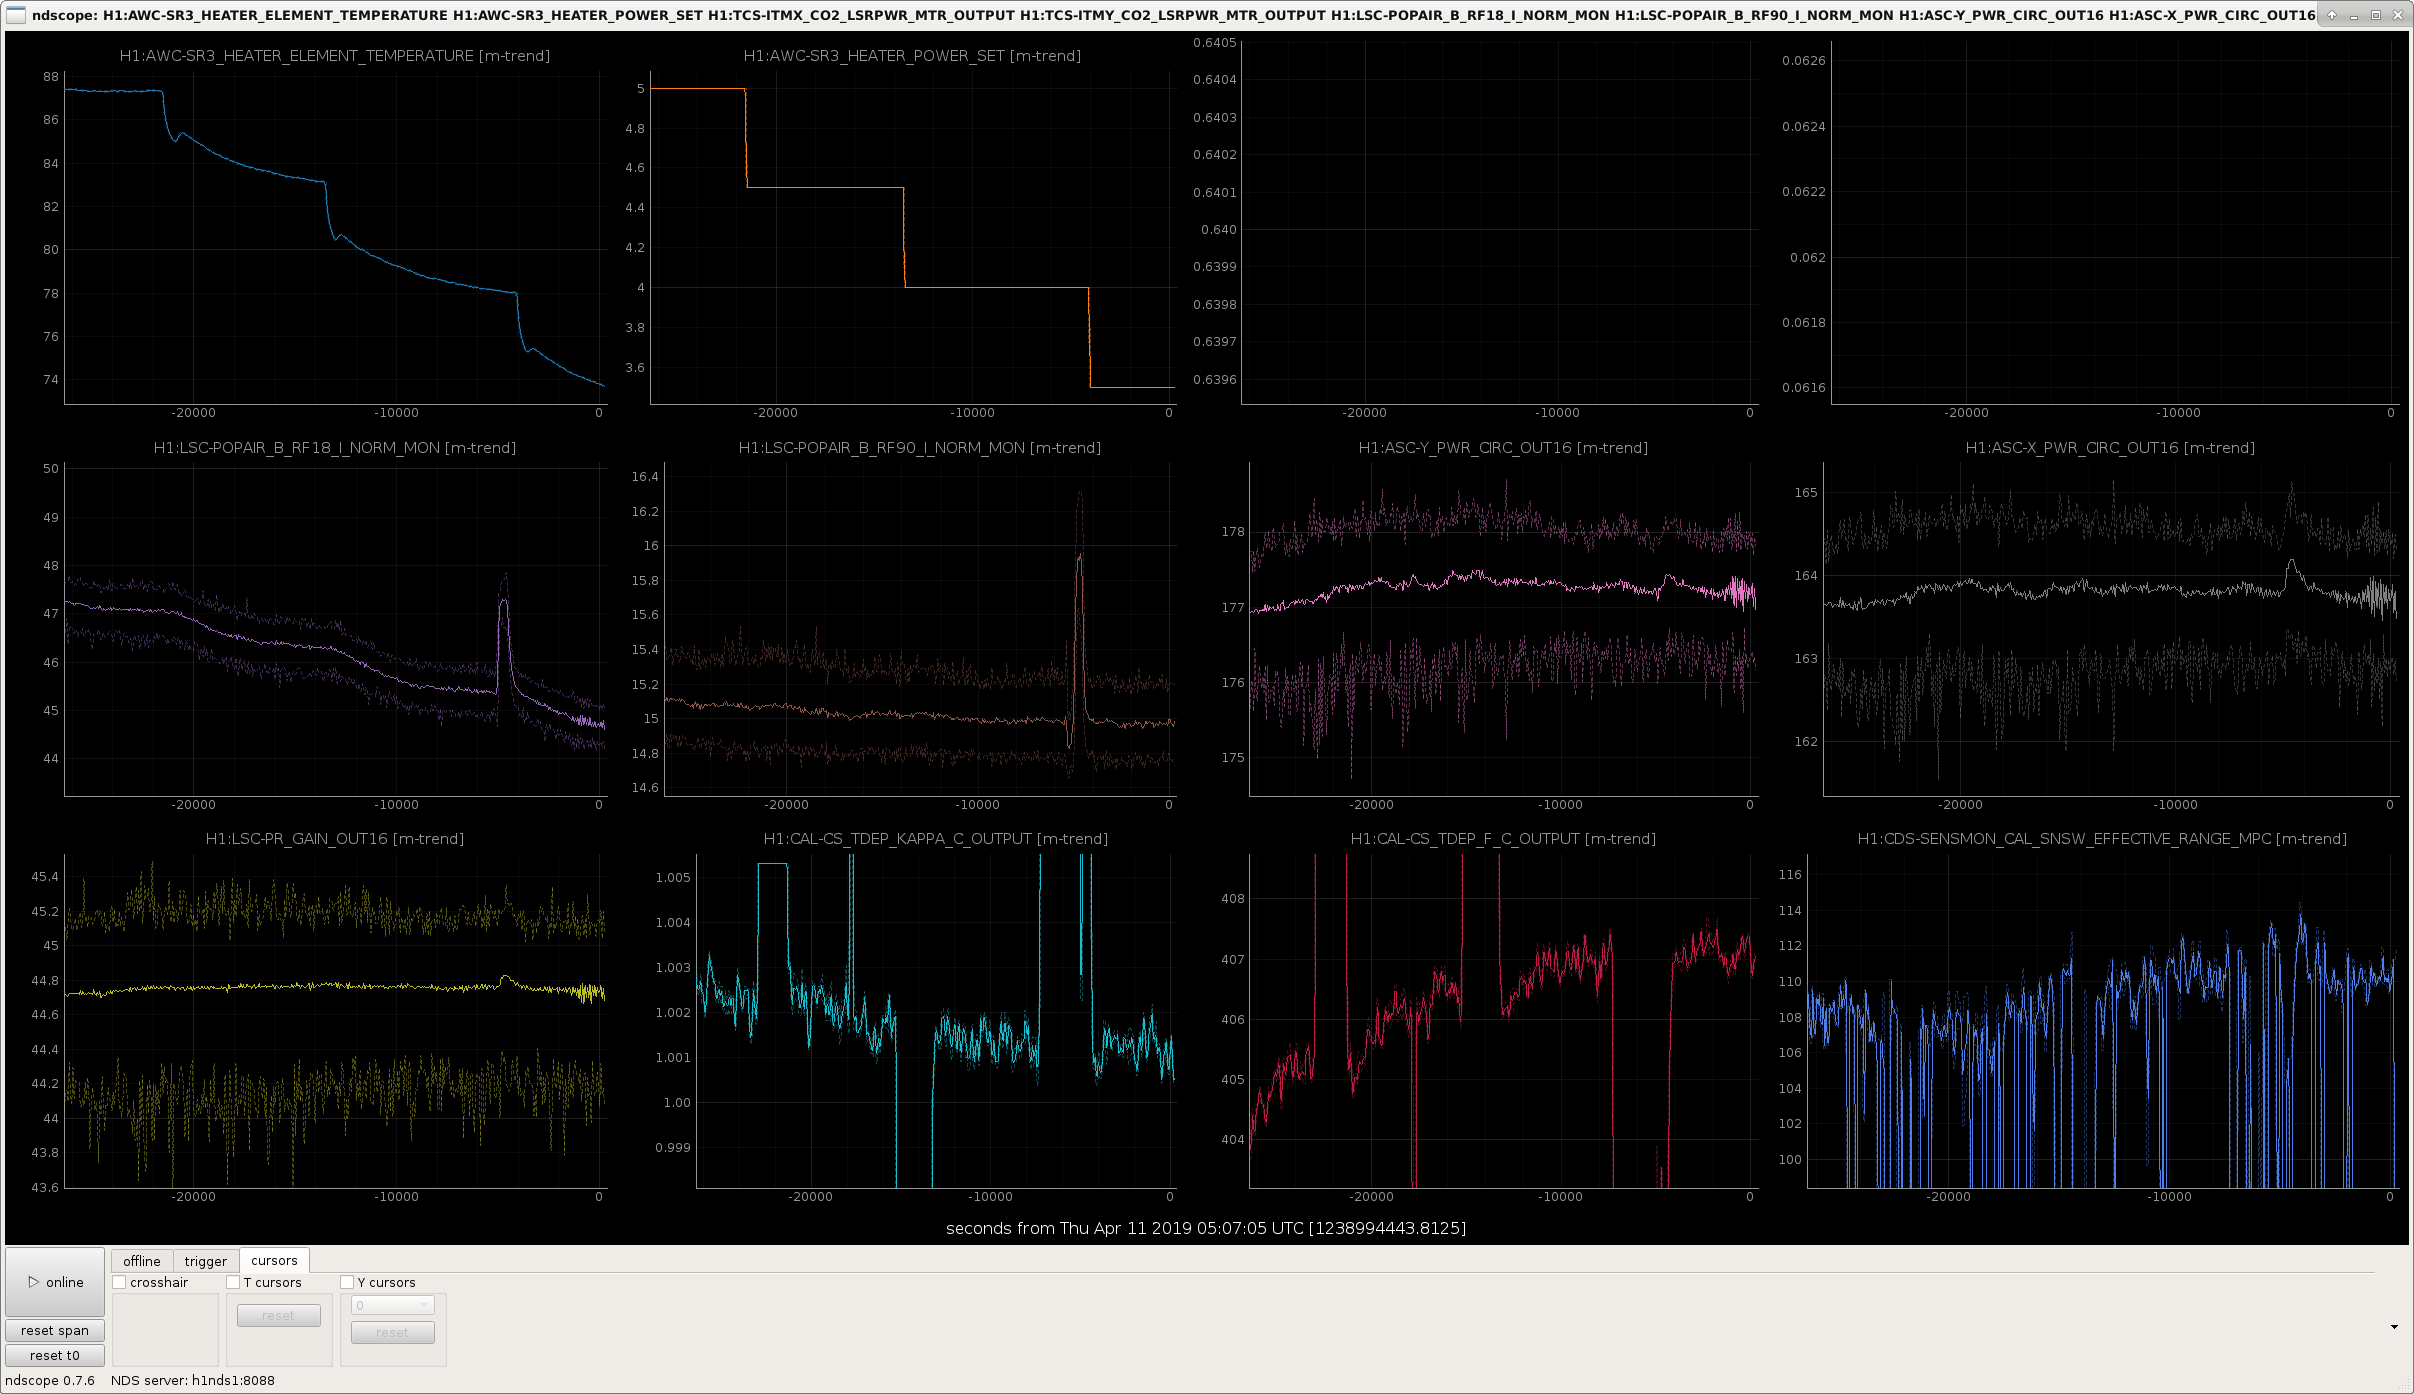
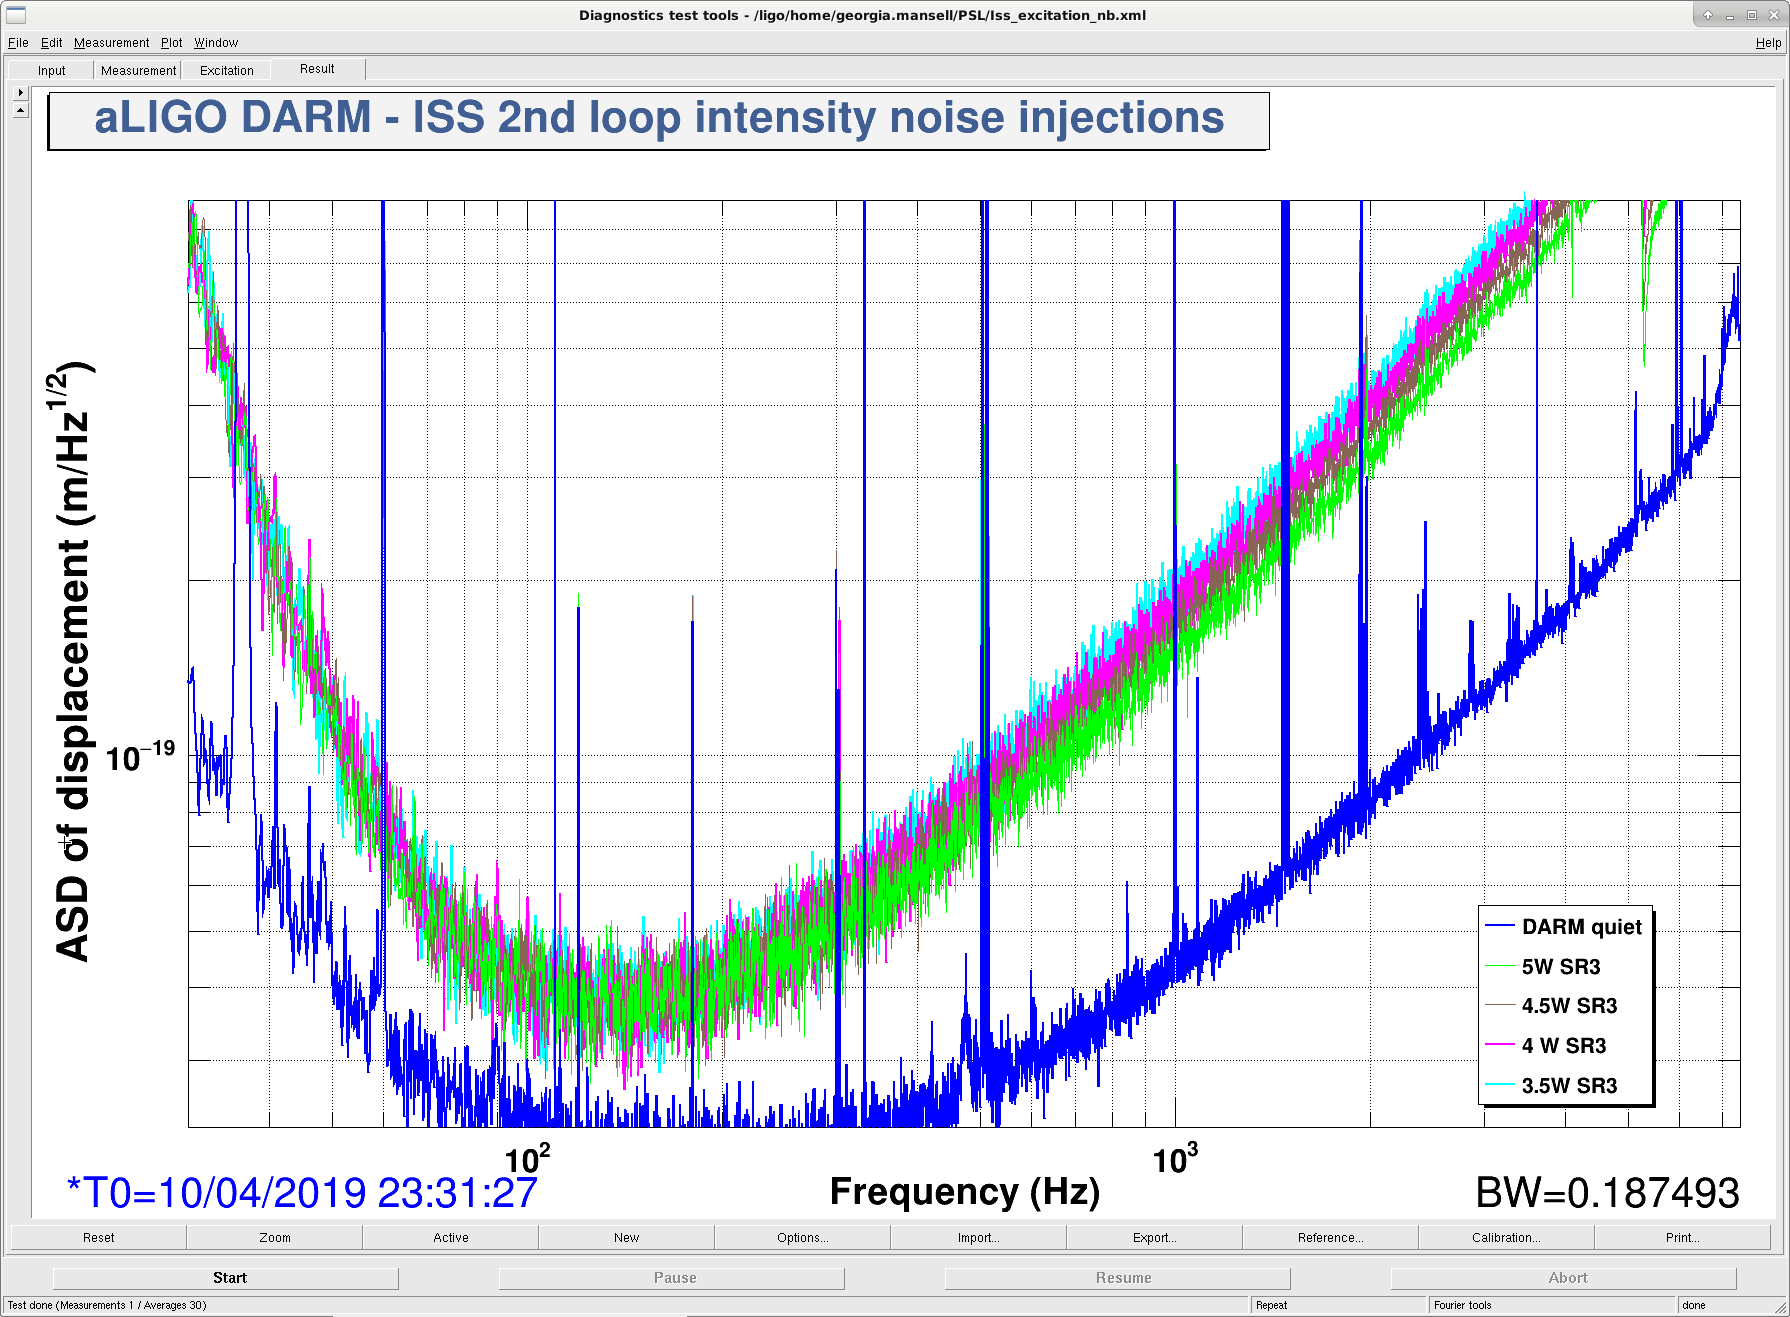
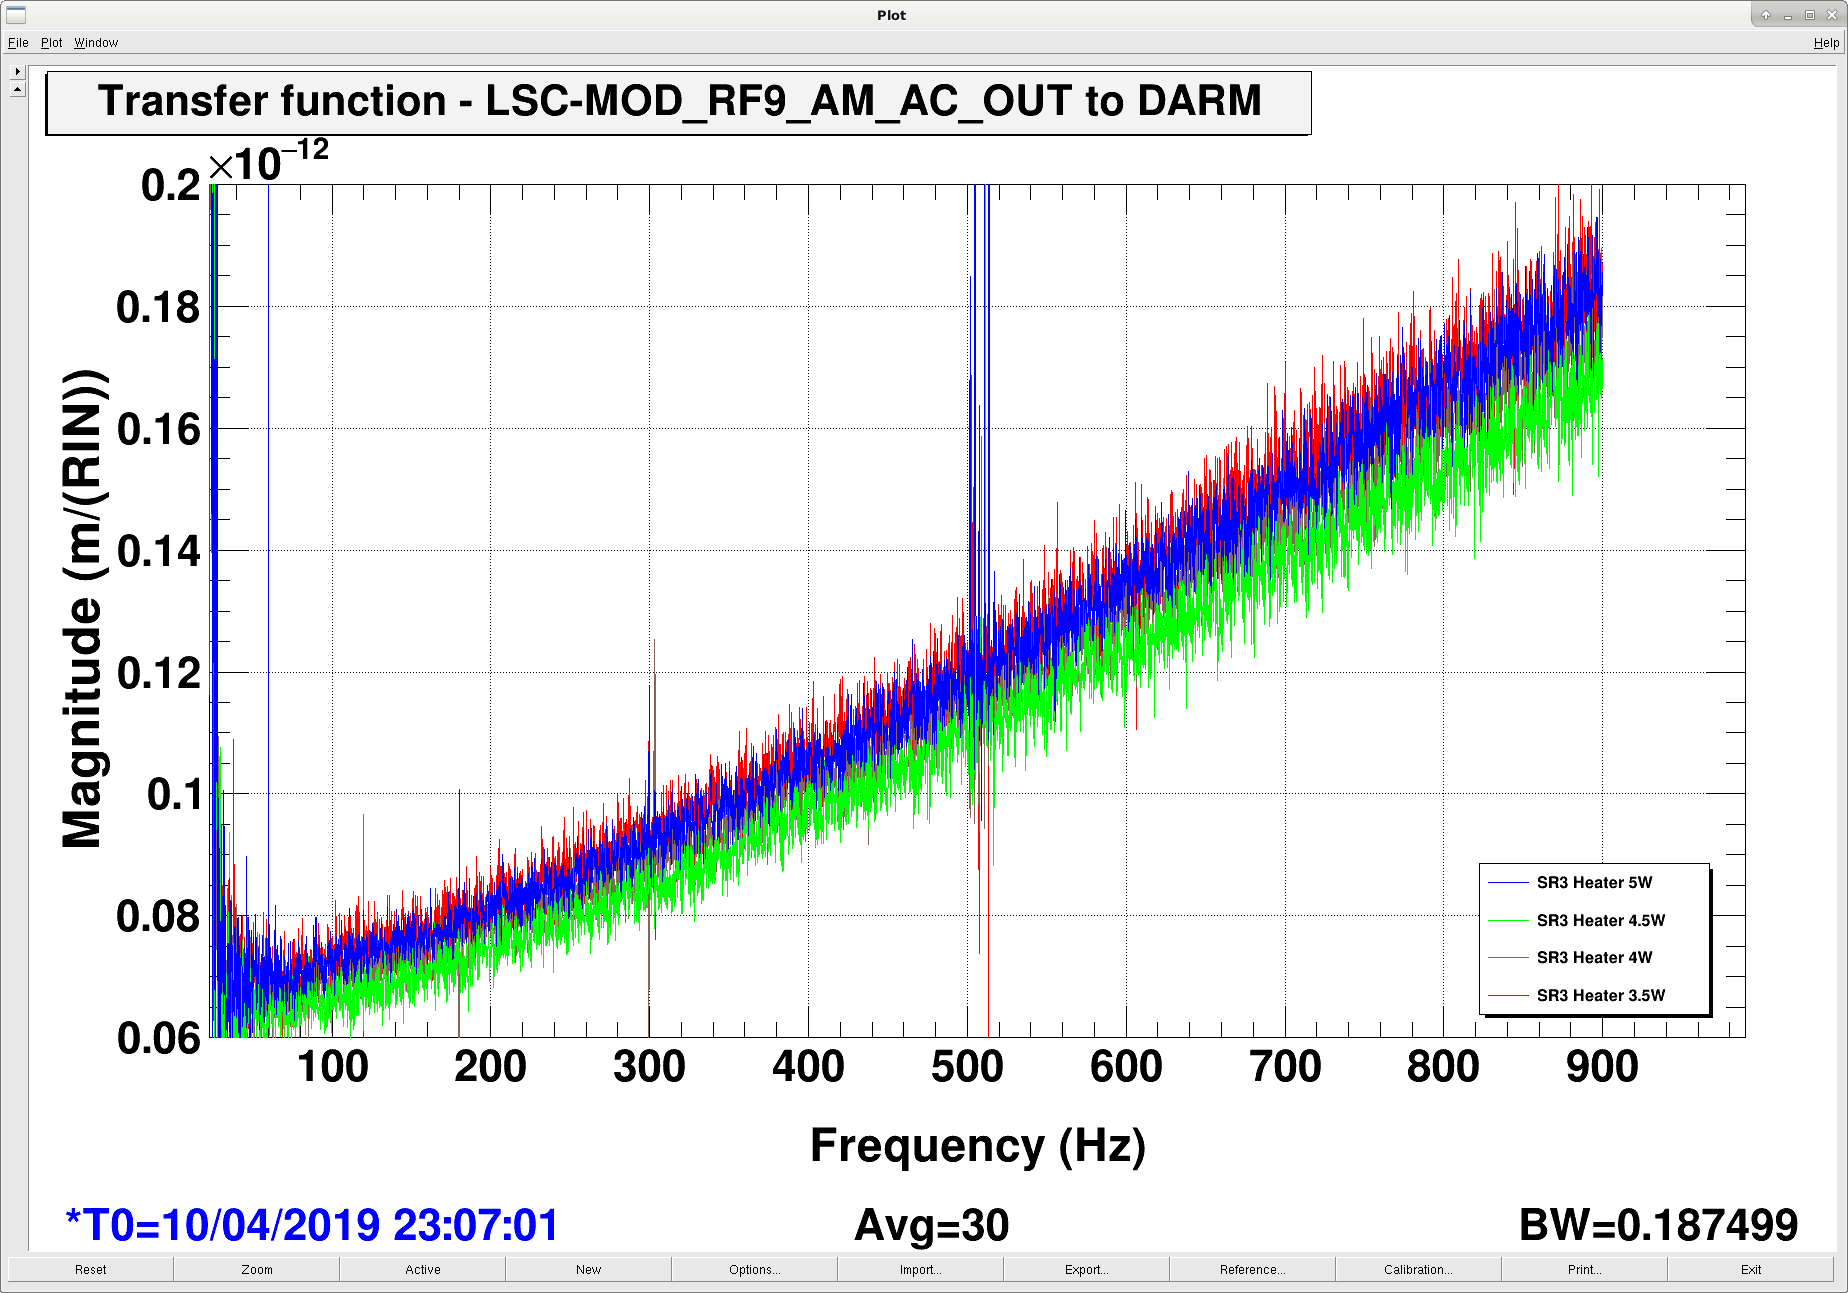
Today we stepped the SR3 heater down in 0.5 W steps, from 5W to 3.5W, according to plan. Here's what we found as we reduced the heating on SR3:

Buildups, cavity pole

These values are shown in the first attachment, The kick in many signals just before we stepped down to 3.5 W is explained below.

DARM plant and laser noise couplings

We also monitored the DARM plant, frequency noise coupling, intensity noise coupling, and RF9 RIN coupling at each step.

SRC ASC

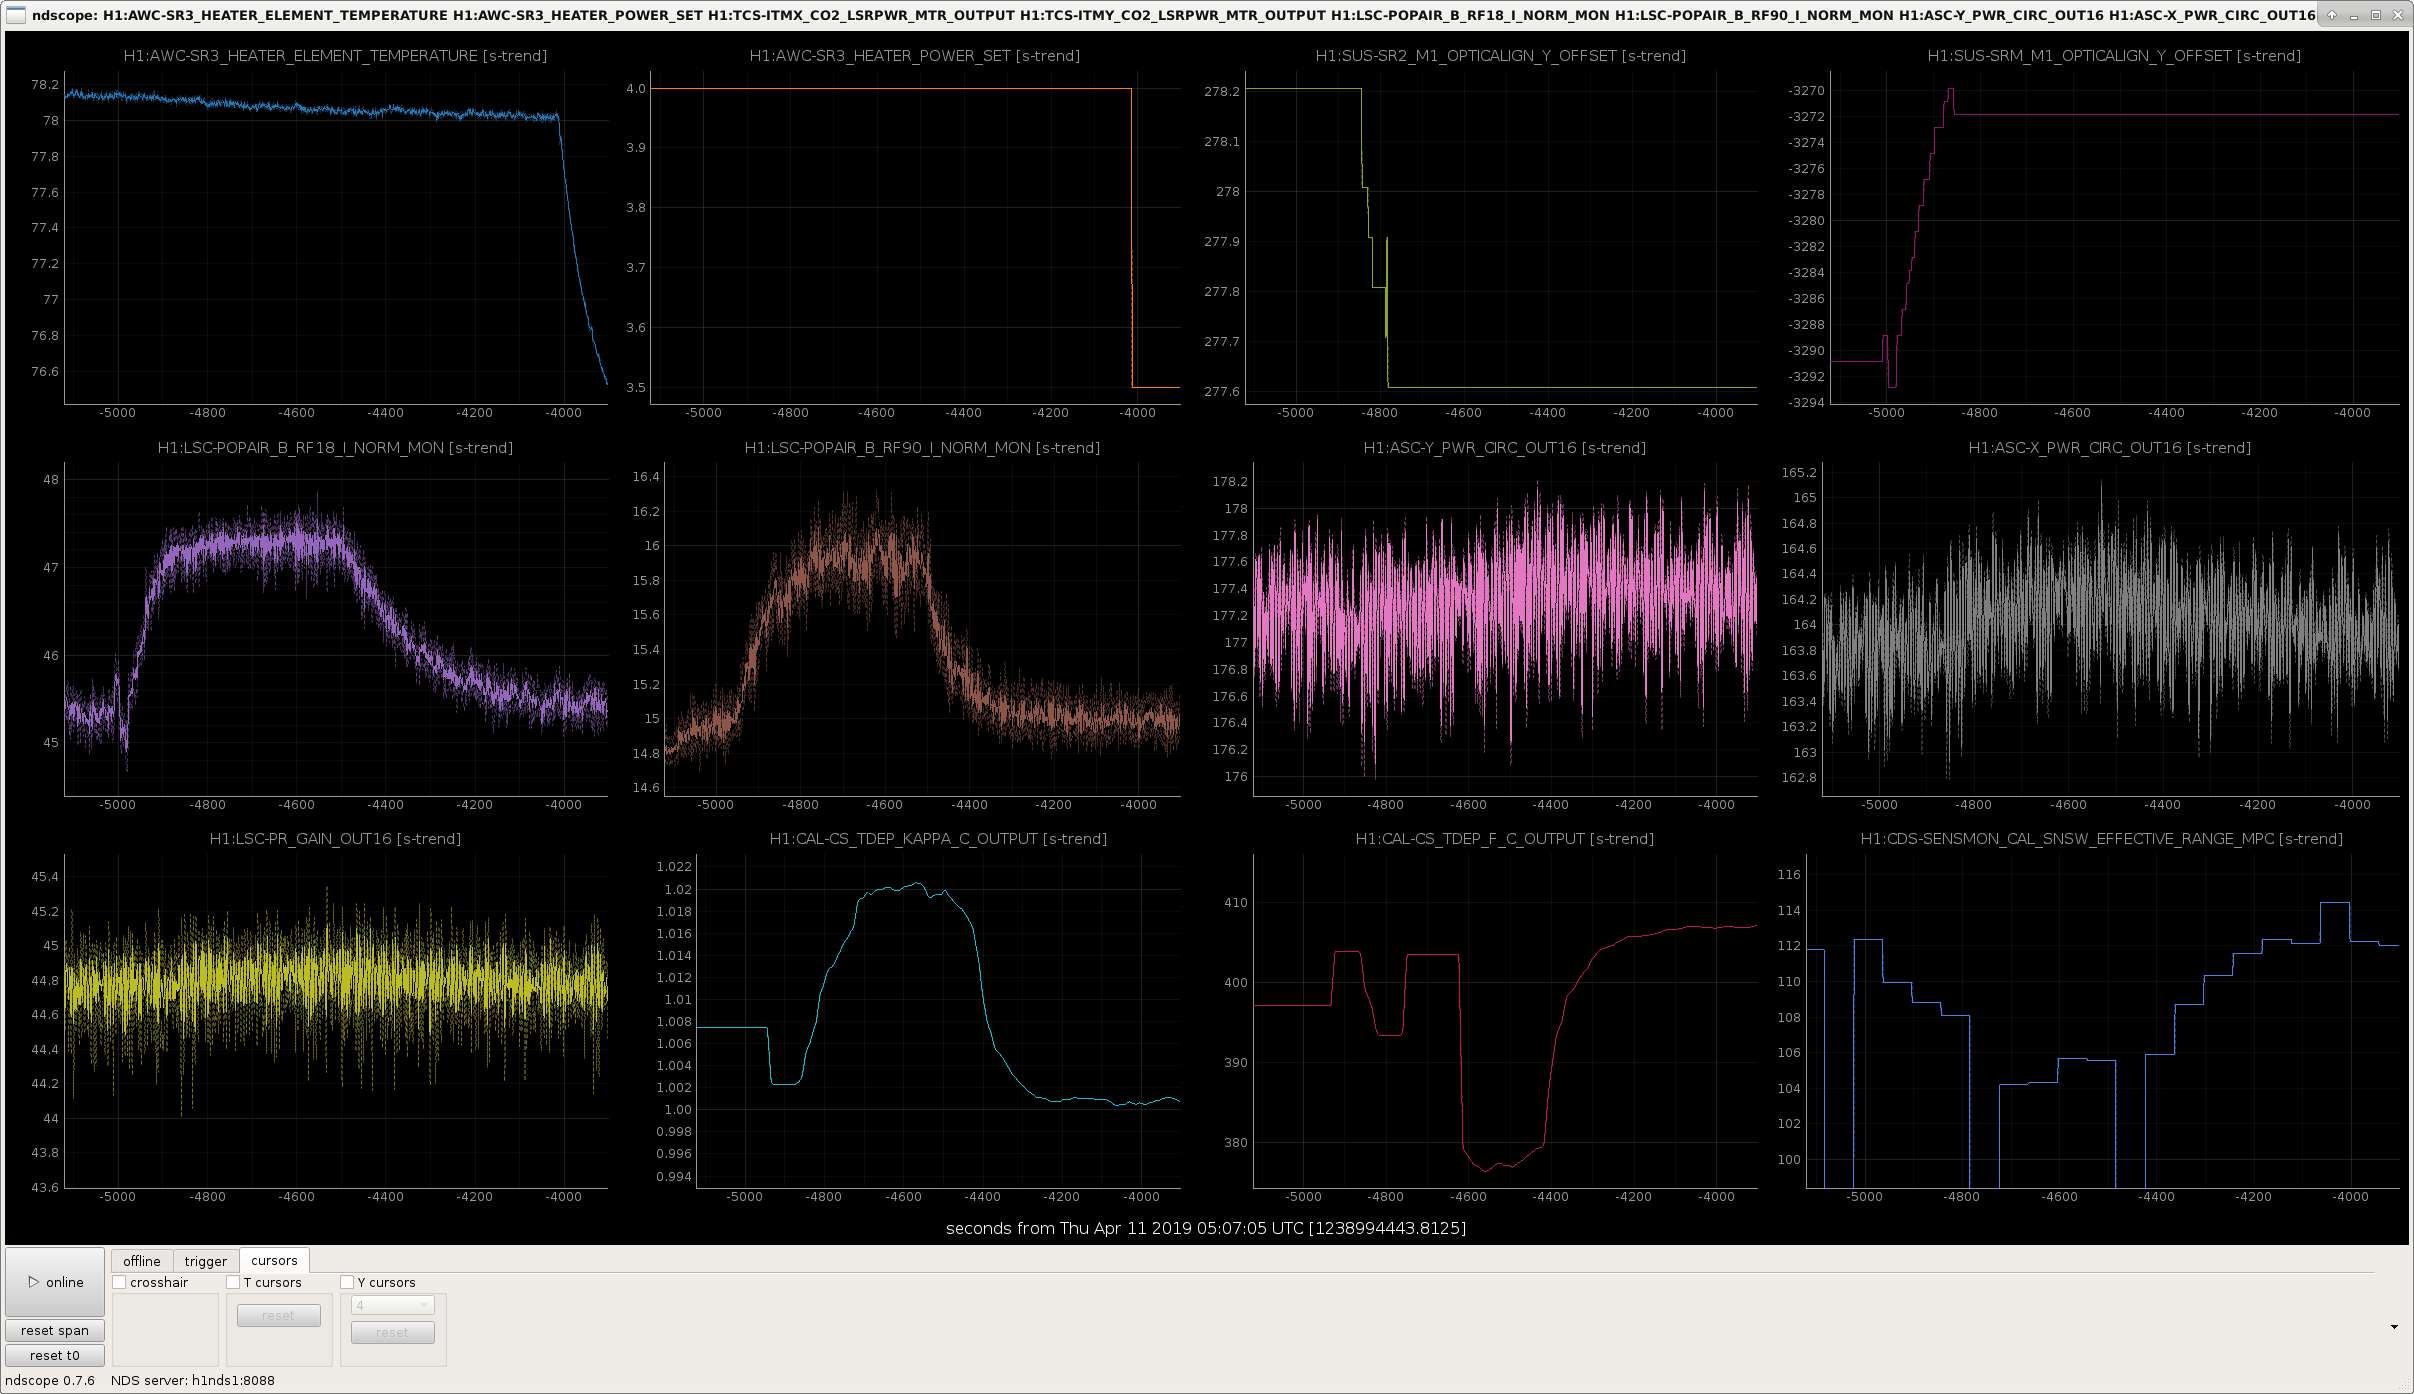
While we were sitting at 4W on the SR3 heater we checked for detuning in the SRC ASC. This is the big peak in RF18 and RF90 in the first attachment; the 4th attachment is zoomed in during this time. We opened the loops and moved the sliders (top right plots), found nothing too interesting in pitch, but while aligning yaw we saw:

We were surprised that the optical gain increased, that doesn't seem to hang together with the other pieces of information here. Maybe we should consider operating with 4W on the SR3 heater, and re-phasing the SRC ASC for this. [Edit: notes for attachment 4: at t = -4500s we turned the SRC ASC back on, which is why the alignment went back to its nominal level. The calibration lines were off before t = -4800s, and the calibration values before this time are not to be trusted.)

Other notes:

Images attached to this report
Comments related to this report
georgia.mansell@LIGO.ORG - 18:46, Thursday 11 April 2019 (48428)

We now understand that the increasing Kappa_C corresponded to a decrease in optical gain. So we were misaligning the SRC when we were aligning it by hand. The fact that RF18 was able to be improved with a misaligned SRC suggests there's room for improvement in the beamsplitter or PRC alignment. 


We have made some DARM spectra from times during our SR3 heater test, and SRC alignment test.

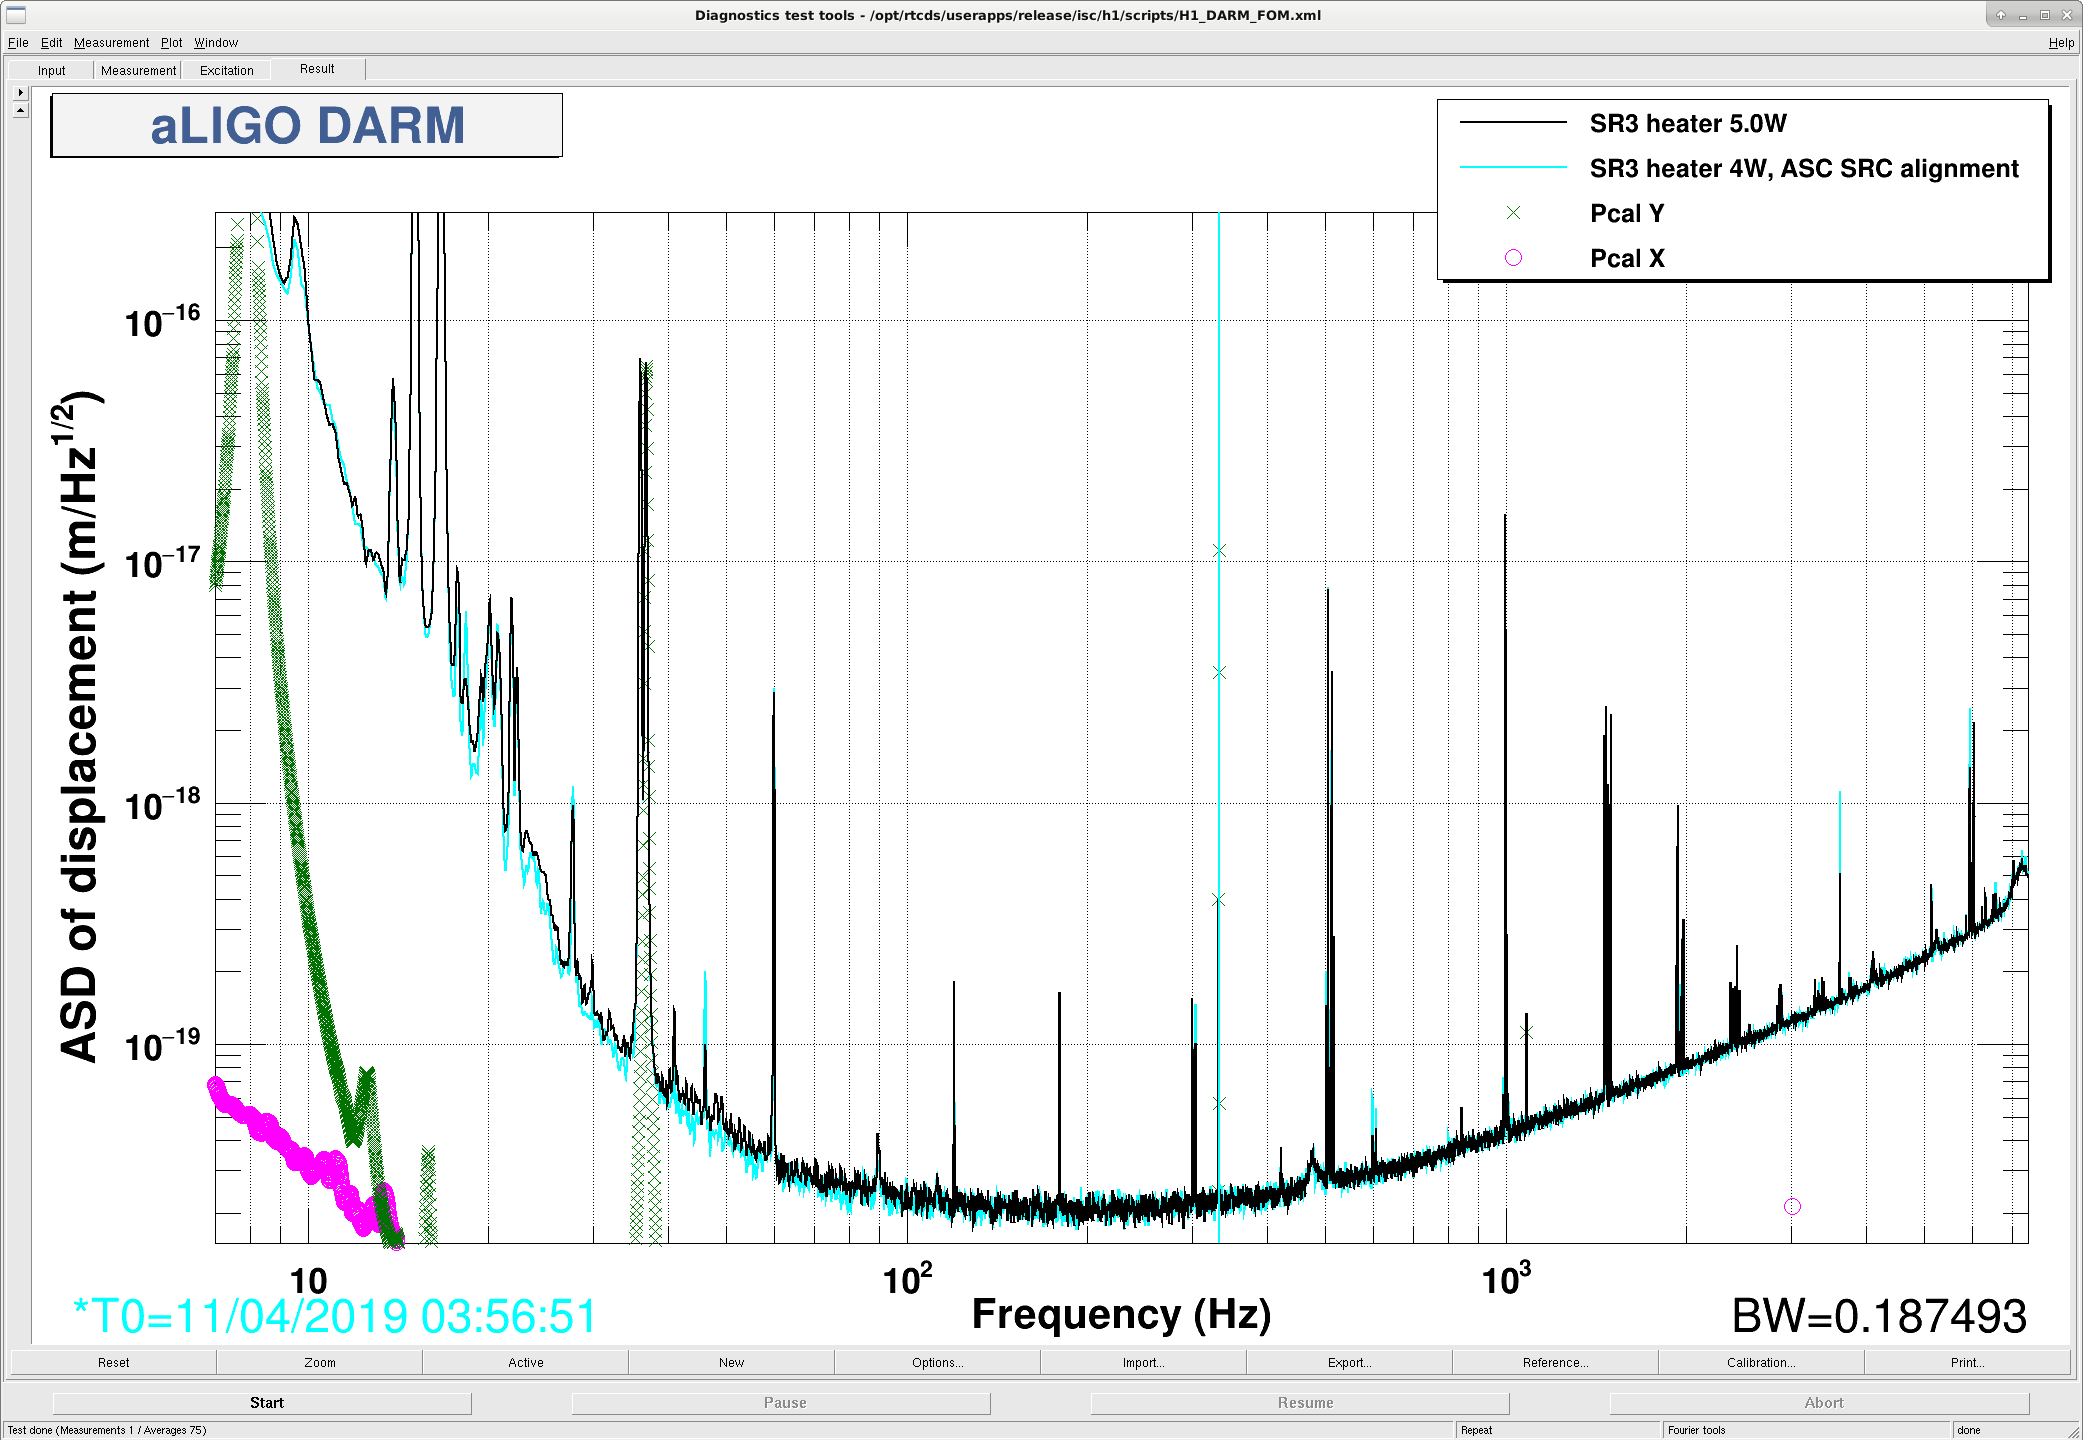
First attachment shows DARM with the SR3 heater at 5W (black) compared to 4W (cyan), showing definite improvement in the bucket, which explains our range increase. A similar spectrum at 3.5 W on the SR3 heater sits somewhere in between these two. 

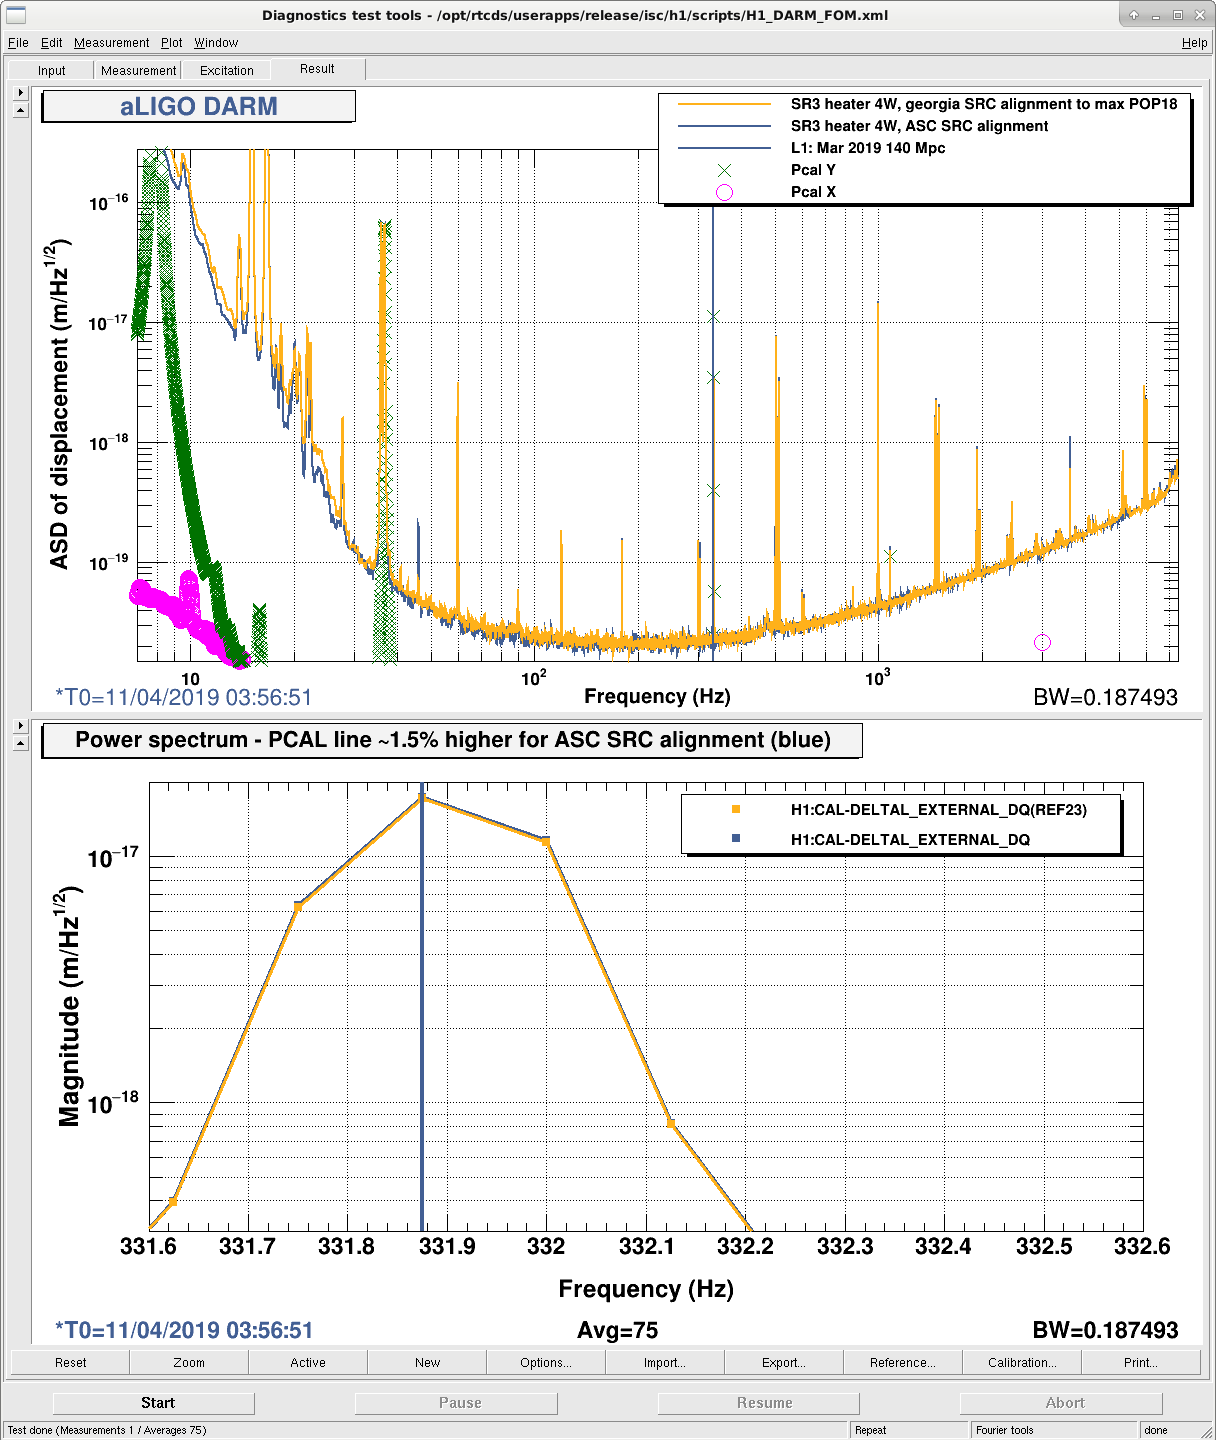
Second attachment shows DARM with SR3 heater at 4W, with the normal alignment (blue), and when we opened the SRC ASC loops and "aligned" by hand, maximising POPAIR_B_RF18 (yellow). It seems like I can undo the SR3 heater improvement by misaligning the SRC...


Images attached to this comment
craig.cahillane@LIGO.ORG - 18:40, Friday 12 April 2019 (48453)
The DARM plant did not change very much over the period of the SR3 heater move.  
I measured the DARM plant 4 times, at SR3 power of 5W, 4.5W, 4W, and 3.5W.  The DARM plant did not change very much this time.  

According to some MCMC fits:
Optical Gain = 3.20 +- .28 × 106 cts/m   (<0.8 % uncertainty)
DARM pole    = 417.80 +- 15 Hz          (4 % uncertainty)
Delay        = 5.31 +- 1.7 × 10⁻⁵ s     (33 % uncertainty)
Spring Freq  = -5.12 +- 1.6 Hz          (32 % uncertainty)
Spring Q     = 37.11 +- 4.7             (13 % uncertainty)


This is a different result than the SR3 heater move at 30W input power.  We moved the SR3 heater by less this time (from 5W to 3.5W rather than from 0 to 5 W before).  We would also like to test the DARM plant for SRCL offset and DARM offset changes.

Also the frequency noise coupling to DARM did not change.  Will post plots later once they are correct.
Non-image files attached to this comment
craig.cahillane@LIGO.ORG - 20:09, Monday 15 April 2019 (48511)
Posted DARM ASDs, calibrated frequency ASDs, and frequency coupling TF plots.

DARM calibration: 
6 zeros at 30 Hz, 6 poles at 0.3 Hz, gain of 1

Frequency Calibrations: Same as 46864.  See attached freqCals.txt.

Comparison to 30 W coupling: 45831.

Before, we had a dip in the freq-to-DARM coupling at around 30 Hz where the radiation pressure and contrast defect effects destructively interfered.  Now that effect seems to have flattened out. (Plot 3 in the PDF)

Over the SR3 heater test cooling from 5W to 3.5W, it seems our freq-to-DARM coupling increases by a few percent, but does not change too radically.


Non-image files attached to this comment
georgia.mansell@LIGO.ORG - 18:58, Monday 22 April 2019 (48677)

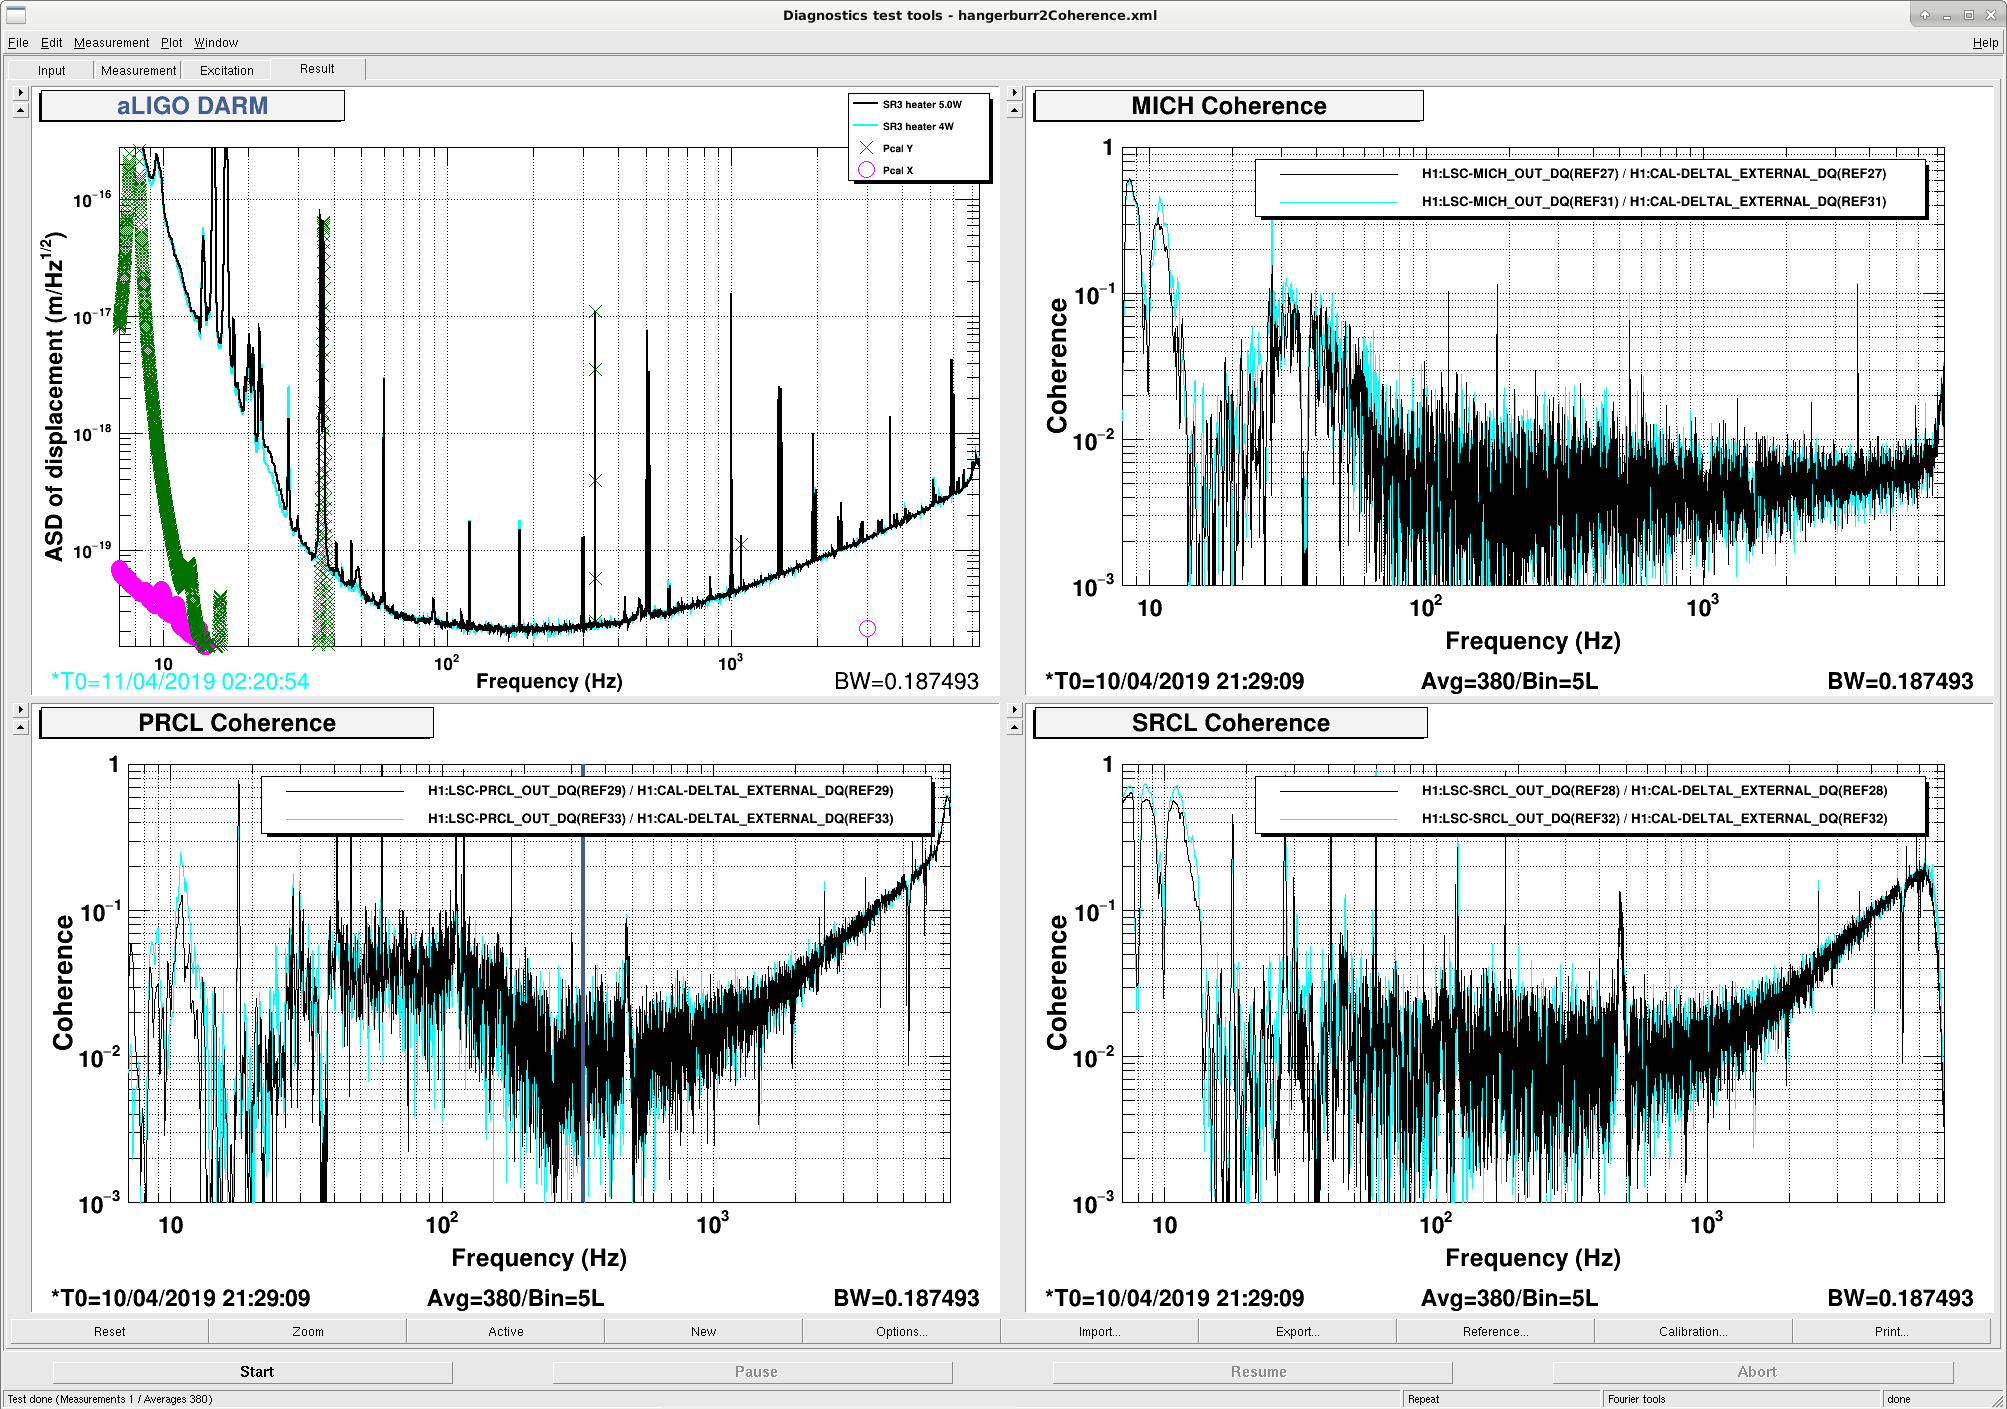
Sheila was thinking the SR3 heater improvement could be attributed to the changing MICH and SRCL feed forward. I had a look at the coherence between DARM and MICH/PRCL/SRCL during the SR3 heater test, comparing a time at 5W (black) and a time at 4W (cyan), and am not convinced the coupling changed significantly. If anything the MICH coherence is worse at 4W than 5W in our frequency band of interest (20-60 Hz).

Images attached to this comment
H1 General
thomas.shaffer@LIGO.ORG - posted 20:01, Wednesday 10 April 2019 (48404)
Ops Eve Mid Shift Update

Currently observing but will take small breaks for Team TCS to make SR3 heater adjustments, then back to observing. Range 108Mpc, wind <=20mph.

LHO General (PEM, VE)
gerardo.moreno@LIGO.ORG - posted 18:57, Wednesday 10 April 2019 (48403)
X-Mid HEPTA Pumps Unboxing

Today the X-Mid crane was used to remove four HEPTA pumps from their wooden crates.
There was two periods of activity with a break in between.  All times below are UTC.

The crane was used during the following times:

- start 21:28 stop 21:37
- start 21:51 stop 21:56
- start 23:55 stop 00:02
- start 00:05 stop 00:10
- start 00:25 stop 00:33 and crane was parked.

Also a drill was used to remove the screws from the wooden crates, sometimes it made some noise, times are as follows:

- start 21:10 stop 21:22
- start 21:39 stop 21:50
- start 23:22 stop 23:55

Work done under WP 8162.

LHO General
thomas.shaffer@LIGO.ORG - posted 16:05, Wednesday 10 April 2019 (48400)
Ops Eve Shit Transition

TITLE: 04/10 Eve Shift: 23:00-07:00 UTC (16:00-00:00 PST), all times posted in UTC
STATE of H1: Commissioning
OUTGOING OPERATOR: Travis
CURRENT ENVIRONMENT:
    Wind: 27mph Gusts, 22mph 5min avg
    Primary useism: 0.07 μm/s
    Secondary useism: 0.19 μm/s
QUICK SUMMARY: TCS crew has the machine for some quick scheduled measurements, then back to observing.

H1 General
travis.sadecki@LIGO.ORG - posted 16:00, Wednesday 10 April 2019 (48398)
Ops Day Shift Summary

TITLE: 04/10 Day Shift: 15:00-23:00 UTC (08:00-16:00 PST), all times posted in UTC
STATE of H1: Commissioning
INCOMING OPERATOR: TJ
SHIFT SUMMARY:  In and out of Observing all day for CAL and TCS measurements.  One lockloss but recovery was easy.  Currently locked at NLN but in Commissioning for more TCS measurements.
LOG:

15:00-15:45 Richard and Peter in and out of LVEA and end stations restarting lasers

17:48 Kyle to MY

18:18 Kyle back from MY, going to MX

18:52 Kyle back

20:51 Corey checking chillers

21:11 Corey done

21:23 Kyle to MY

21:41 Betsy, Nichole, Marc to MY

21:55 Kyle back

22:12 Betsy, Nichole, Marc back

22:44 Cheryl to optics lab

H1 General
travis.sadecki@LIGO.ORG - posted 15:44, Wednesday 10 April 2019 (48399)
Out of Observe at 22:44 UTC

For scheduled TCS measurements.

H1 TCS (AOS, TCS)
corey.gray@LIGO.ORG - posted 14:23, Wednesday 10 April 2019 (48397)
TCS Chillers FAMIS Task (#11486)

Addressed TCS Chillers (13:58 - 14:05 PM PST today/Wed)

NOTES

H1 CAL (CAL)
madeline.wade@LIGO.ORG - posted 13:23, Wednesday 10 April 2019 - last comment - 11:13, Thursday 11 April 2019(48388)
New GDS calibration filters based on updated calibration model params

M. Wade, A. Viets

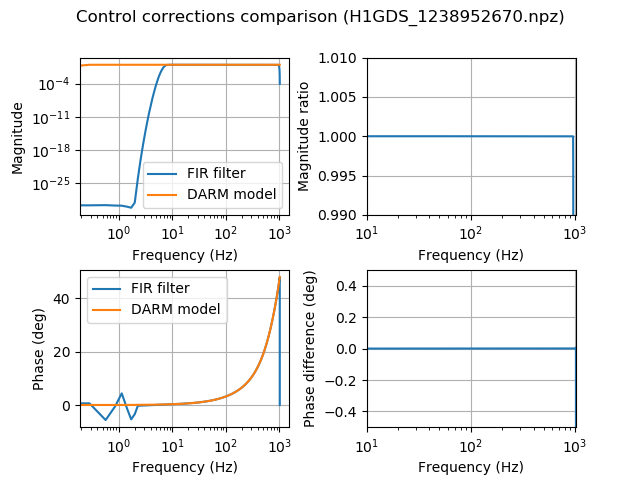
I have made new filters file for the GDS calibration pipeline based on the model params file aligocalibration/trunk/Runs/O3/H1/params/modelparams_H1_20190404.py in svn r7188.  The new filters are located in

aligocalibration/trunk/Runs/O3/GDSFilters/H1GDS_1238952670.npz 

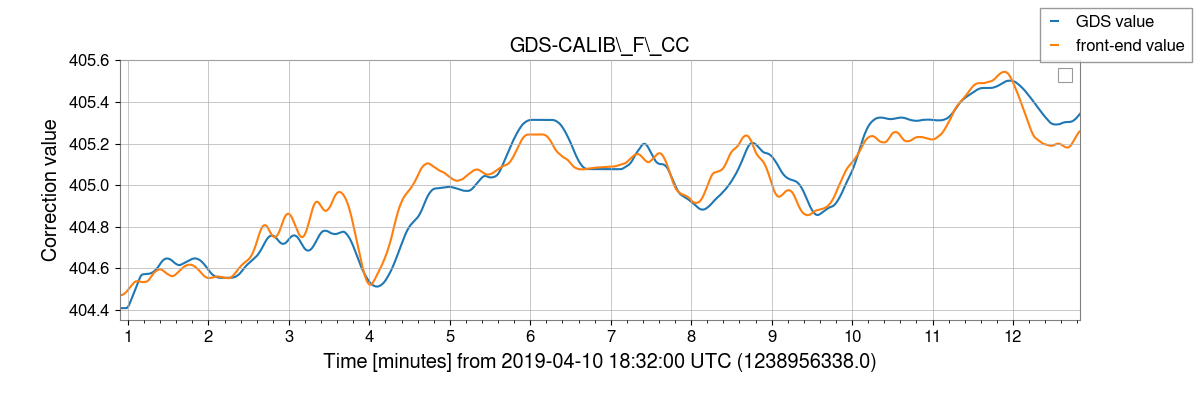
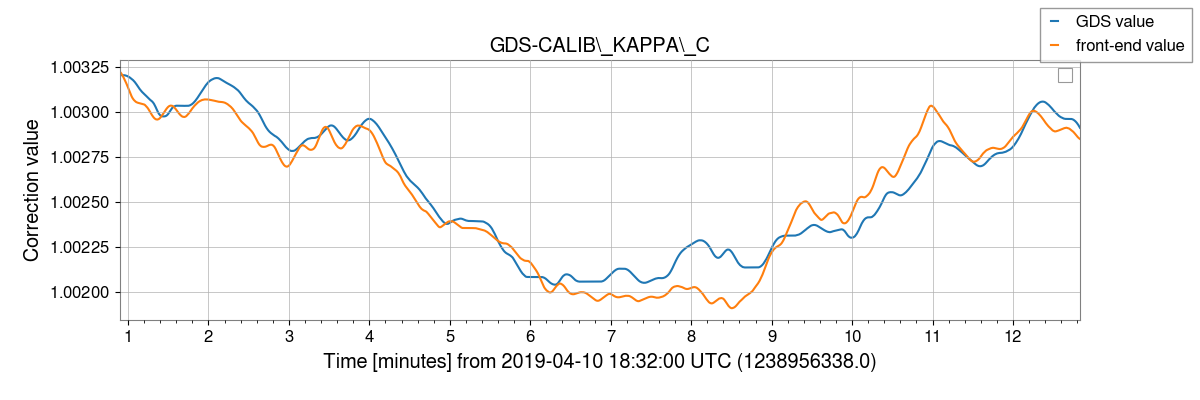
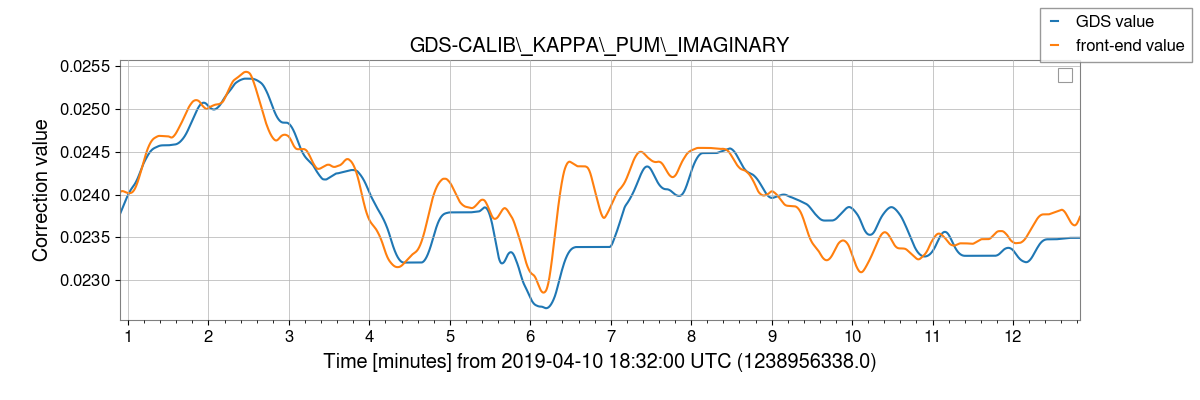
I have attached results from testing these filters as well as plots of the filters themselves.  The tests were run on a lock stretch from earlier today (GPS times 1238956172-1238956672).  For these tests I did 

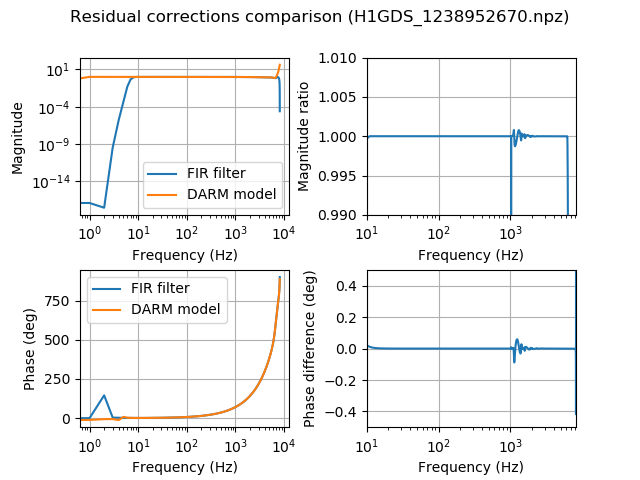
  1. The first attached plot is the response of the residual chain correction filter compared to the expected residual correction from pyDARM.
  2. The second attached plot is the response of the control chain correction filter compared to the expected control correction from pyDARM.
  3. The third attached plot is a comparison of the response function as derived from data calibrated (offline) with the GDS pipeline to the response function in pyDARM. 
  4. The fourth plot is a zoom-in on the ratio of this comparison.  Both of these plots indicate agreement at the expected level. 
  5. The fifth plot is a snapshot of the GDS-CALIB_STATE_VECTOR during this time, which looks as expected. 
  6. The sixth plot is a comparison of the ASD from the GDS pipeline with these filters and the two CALCS h(t) data streams (CFTD and not CFTD). 
  7. The seventh plot is a ratio of the ASDs from these three h(t) streams. 
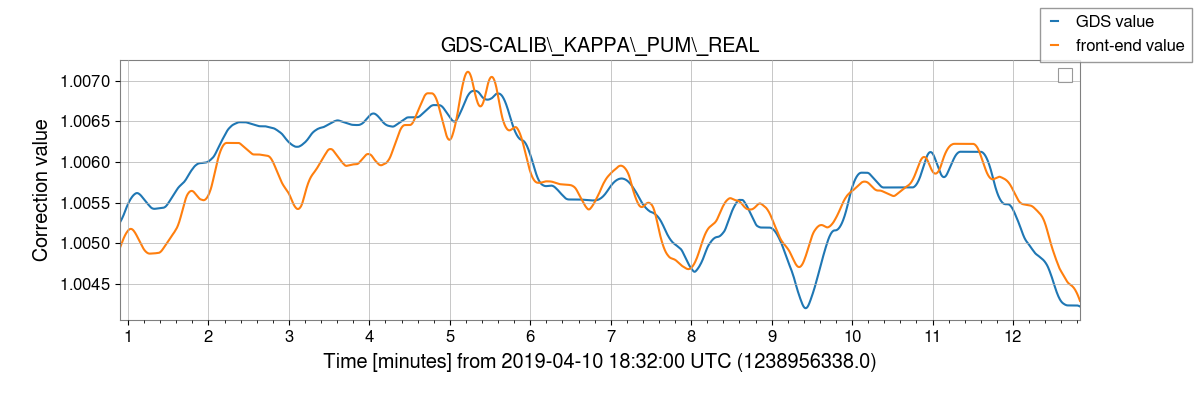
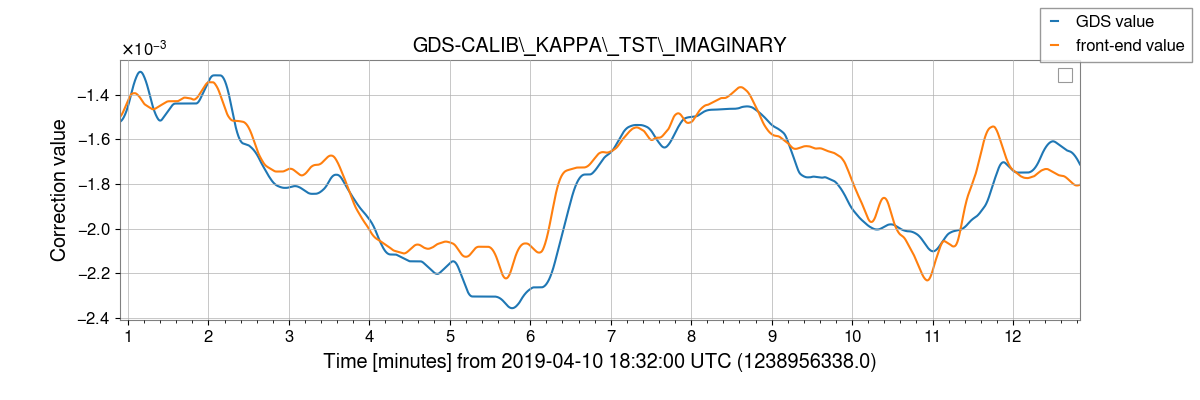
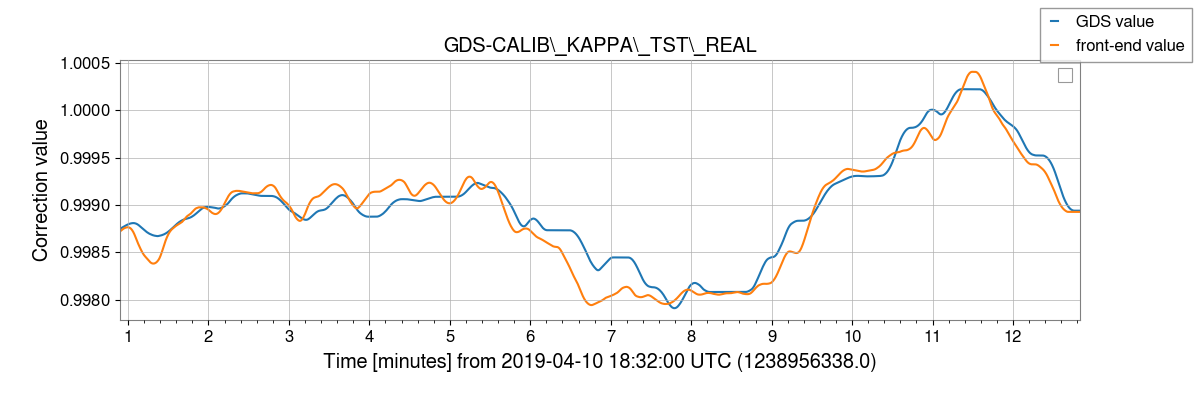
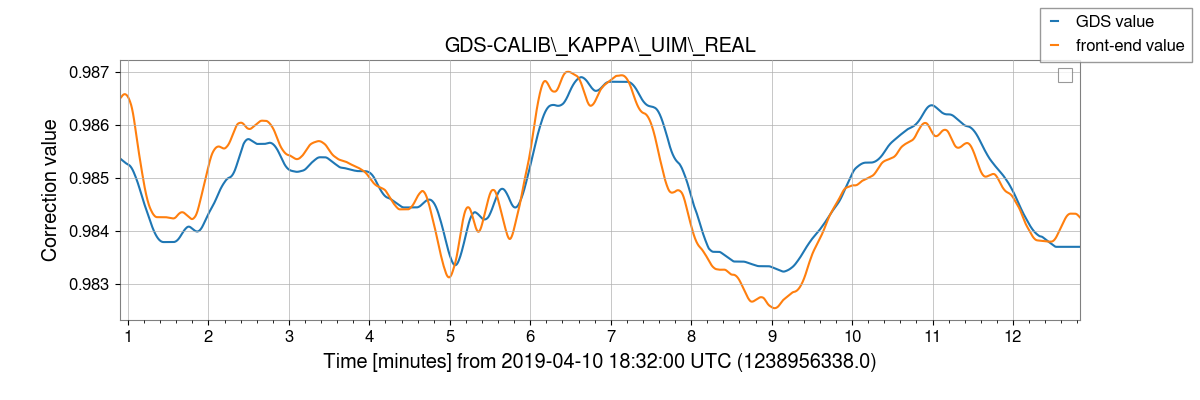
  8. The last set of plots are all time series plots of the TDCFs as produced by GDS and by CALCS. 

We see the expected level of agreement for all of these tests.  I would like to investigate more the differences between the GDS and the CALCS CFTD strain channels, but this should not inhibit the installation of these new filters.

I have also created a new configuration file.  The most significant change to the configuration is that we are now applying scalar corrections for kappa_TST and kappa_C and frequency-dependent corrections for the cavity pole frequency. Note that we are not yet applying scalar corrections for kappa_PUM or kappa_UIM.  We have decided to hold off on this until the calibration lines are moved closer together, which increases the validity of these calculations.  The configuration file can be found in the calibration SVN:

 aligocalibration/trunk/Runs/O3/GDSFilters/H1GDS_1238952670.ini

I installed the new filters and configurations and restarted the calibration pipeline at approximately GPS time 1238962221 on both the production and redundant DMT machines.

Images attached to this report
Comments related to this report
madeline.wade@LIGO.ORG - 11:13, Thursday 11 April 2019 (48411)

M. Wade, J. Kissel

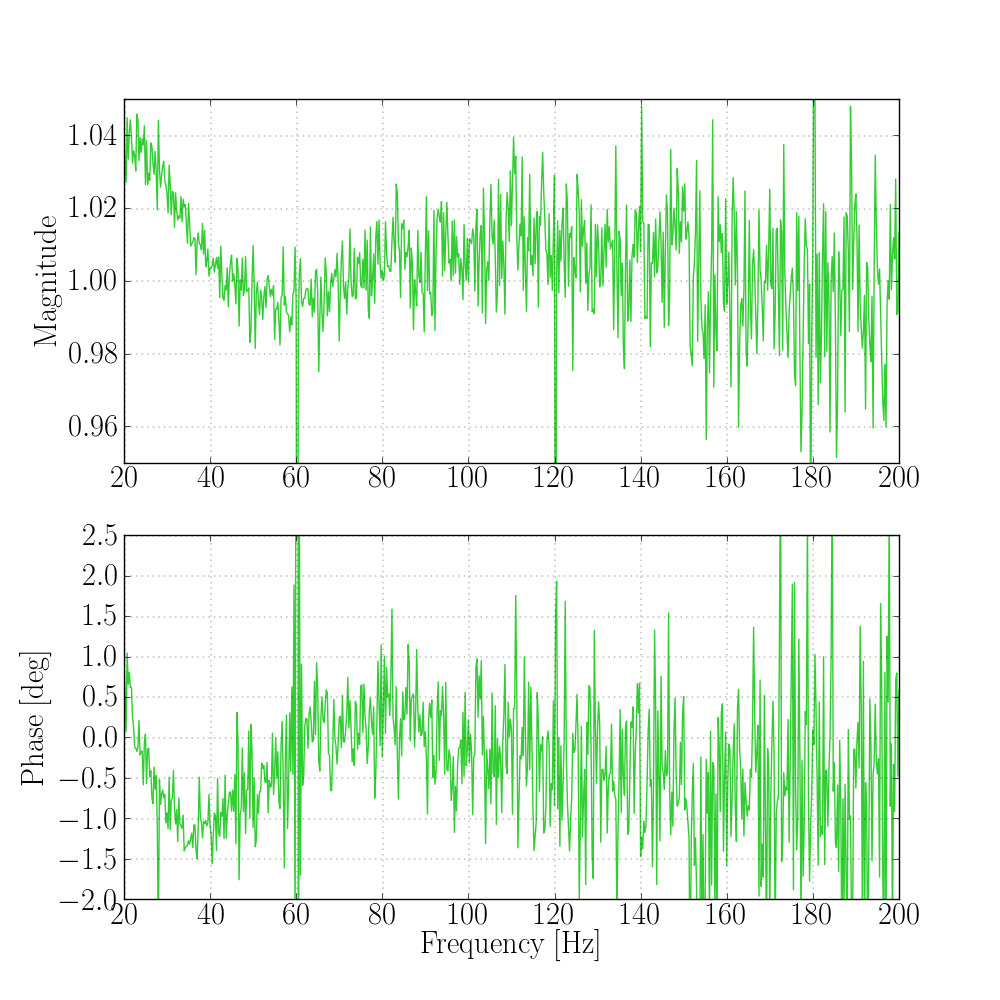
Jeff did a broadband PCAL sweep from 20:30:12 UTC to 20:31:58 UTC.  I analyzed the transfer function of GDS / PCALY during this sweep.  I've attached the results, which are consistent with our uncertainty budget in this frequency region (20 - 200 Hz).  I applied the pyDARM PCAL correction factors as the calibration to the PCAL channel and applied a gain of 3994.5 to the GDS channel to bring both channels into units of meters.

Images attached to this comment
H1 DetChar (ISC)
sheila.dwyer@LIGO.ORG - posted 11:21, Wednesday 10 April 2019 - last comment - 09:23, Thursday 11 April 2019(48380)
lowered OMC ASC gain as a test for 10-15 Hz glitches.

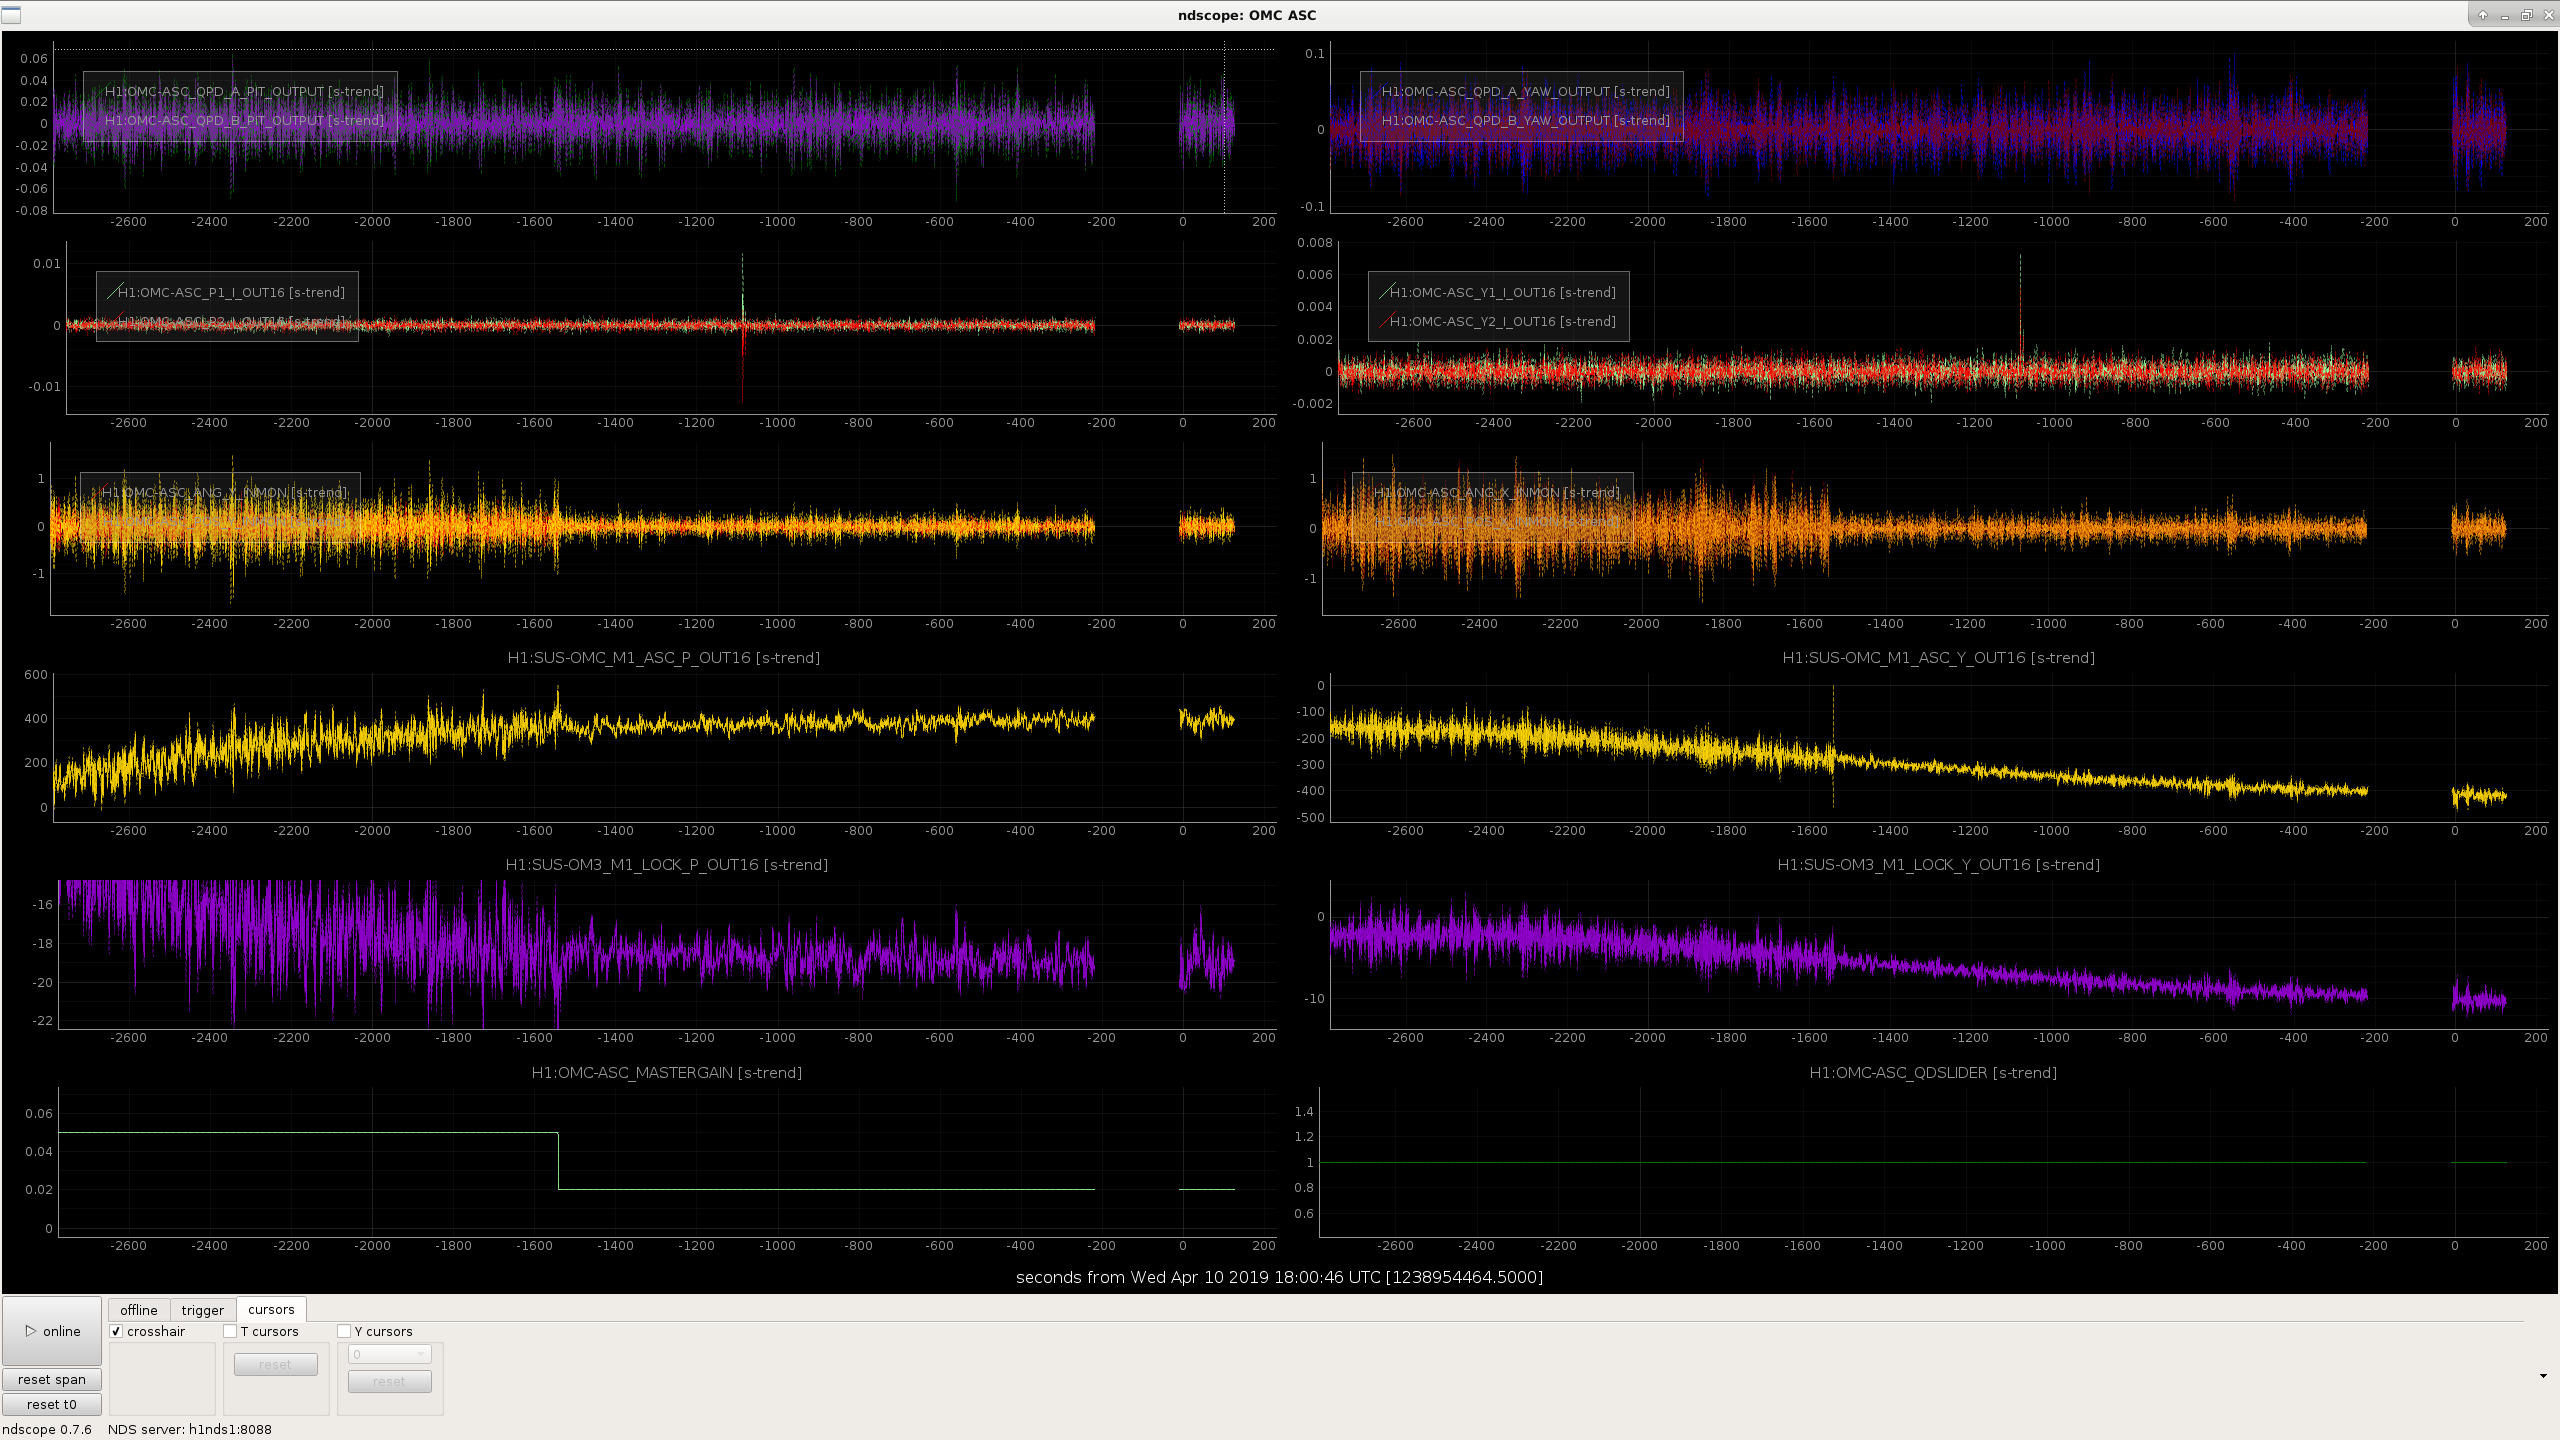
As a test, I lowered H1:OMC-ASC_MASTER_GAIN from 0.05 to 0.02 at 17:35 UTC during calibration sweeps.  We have been having frequency glitches at 10-15 Hz for the last few weeks, I was wondering if reducing the control signal sent to the OMC would reduce these glitches.  

Lowering the gain of the OMC ASC did reduce the control signal, although the  rms of the QPD error signals don't seem to change much (attachment).  Based on the DMT Omega monitor over the last half hour the low frequency glitches do seem to be reduced,  This time doesn't show up on the summary page because the ISC_LOCK state was NLN_CAL_MEAS, not the nominal state.  

I haven't put this into the gaurdian yet, but Travis has accepted the change in SDF for this observing segment.  If the low frequency glitches do look better we can make this change permanent.  

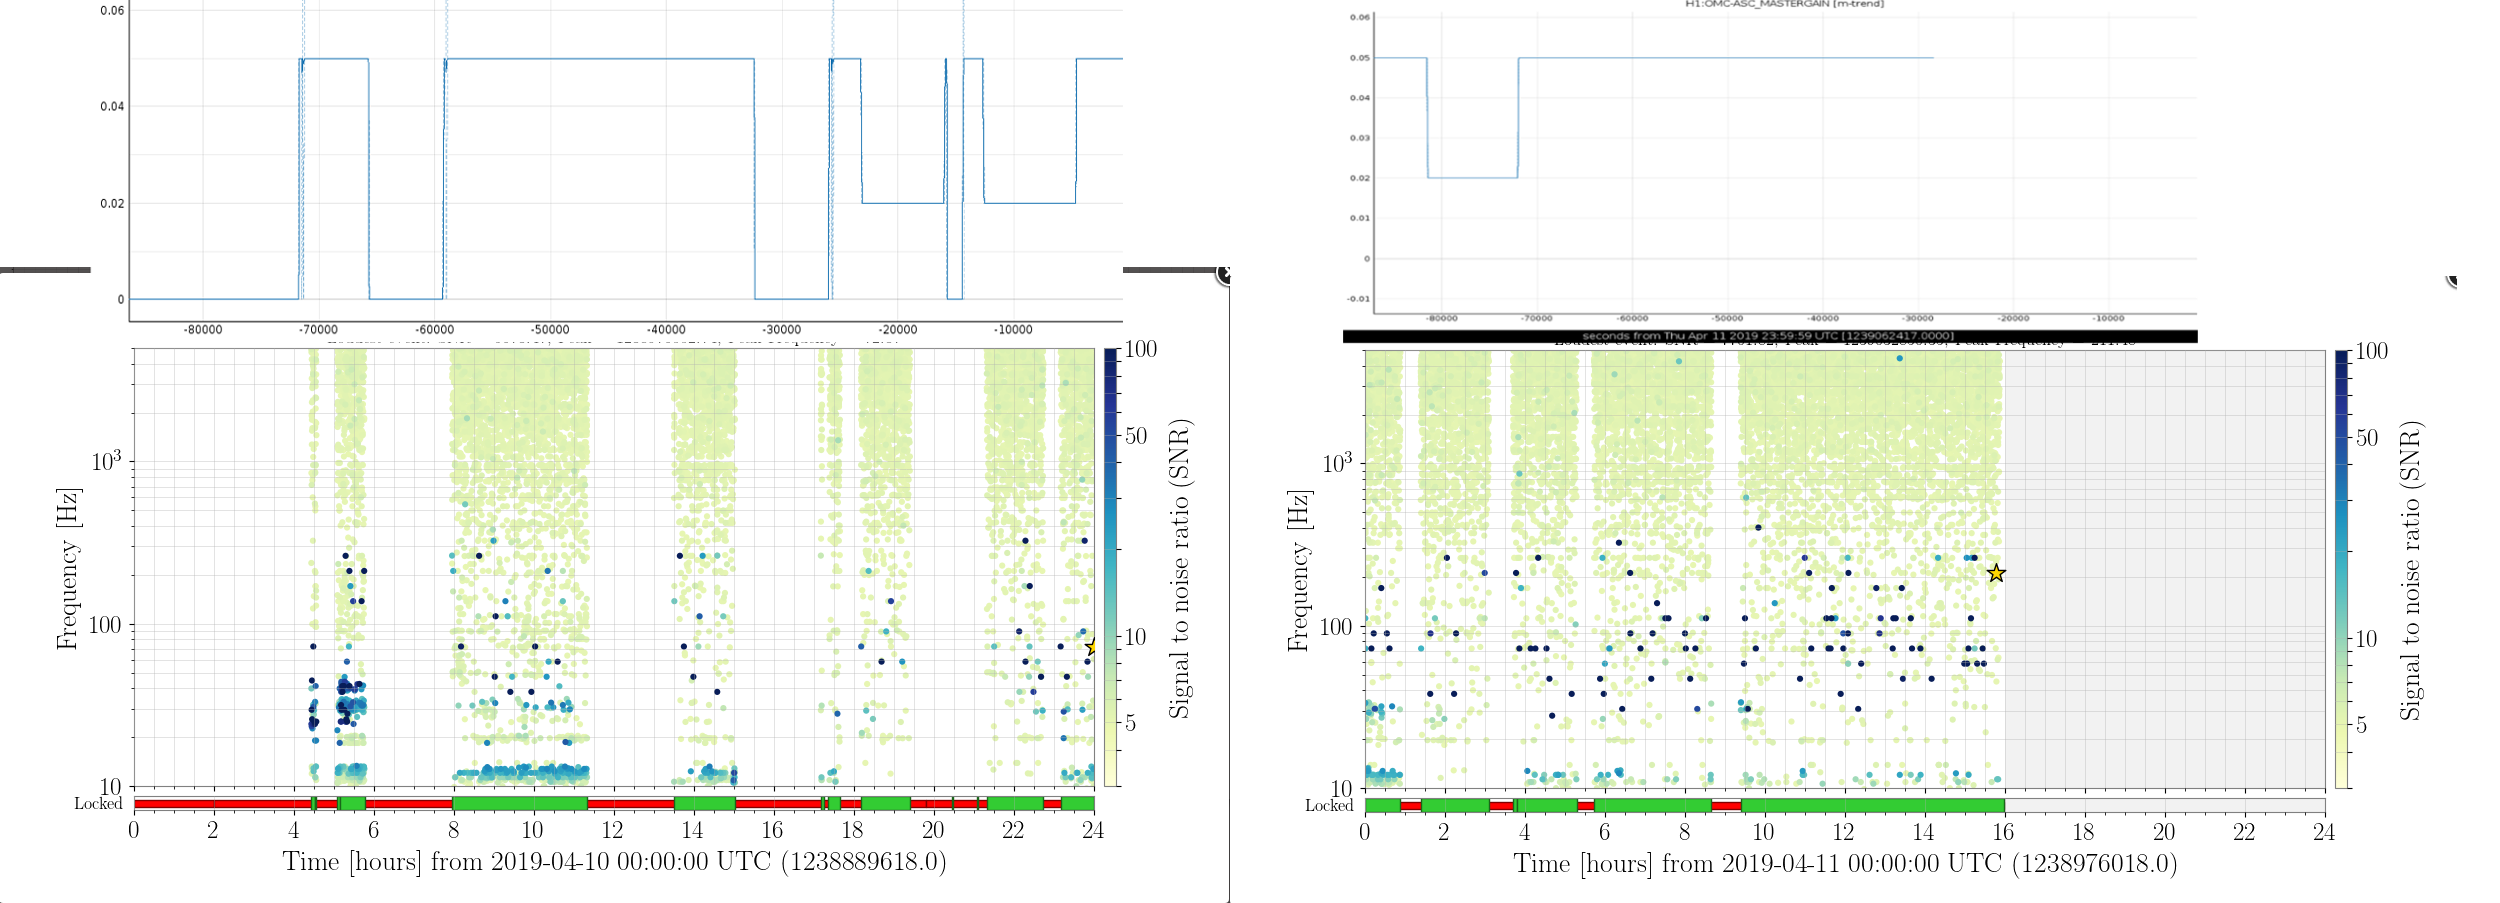
Update: Based on the summary pages there were fewer low frequency glitches while the gain was lowered, but the wind is also dying down simultaneously, so I've turned the gain back up at 19:35 UTC while we are out of observing for SR3 heater tests to see if they come back.The interferometer unlocked shortly after I increased the gain again. 

The gain was set to 0.02 for the lock segment from 20:30 UTC to 22:44 UTC, when I set it back to 0.05.

Images attached to this report
Comments related to this report
sheila.dwyer@LIGO.ORG - 09:23, Thursday 11 April 2019 (48409)

The SR3 heater crew continued to change this gain for different observing segments, and it does seem that lower OMC ASC gain reduces the low frequency scattering. I've lined up some screenshots in the attachment to show this.  I will go ahead and put this into the guardian for now.  It might be that we could further improve the situation by moving the OMC alignment back to the dithers, we were planning to try a test of that soon.

Images attached to this comment
H1 CAL
ling.sun@LIGO.ORG - posted 10:40, Wednesday 10 April 2019 - last comment - 11:34, Thursday 11 April 2019(48378)
Created new model 20190404 and broadband + sweeps validation

Lilli S, Jeff K,

Lately we have tracked down some bugs and misunderstandings -- see more details in 48272, 48276. Now we have made a new model file /ligo/svncommon/CalSVN/aligocalibration/trunk/Runs/O3/H1/params/modelparams_H1_20190404.py, using the measurements taken on 2019-04-03. This new model has been validated and installed in CAL-CS.

--------------------------------------------------

The measurements used to create the model live in /ligo/svncommon/CalSVN/aligocalibration/trunk/Runs/O3/H1/Measurements
The processing scripts live in /ligo/svncommon/CalSVN/aligocalibration/trunk/Runs/O3/H1/Scripts
See attached pdfs for the fitting results. See the detailed fitting output below.

To validate the model, we processed the broadband + sweeps measurements taken last night -- /ligo/svncommon/CalSVN/aligocalibration/trunk/Runs/O3/H1/Measurements (2019-04-10)

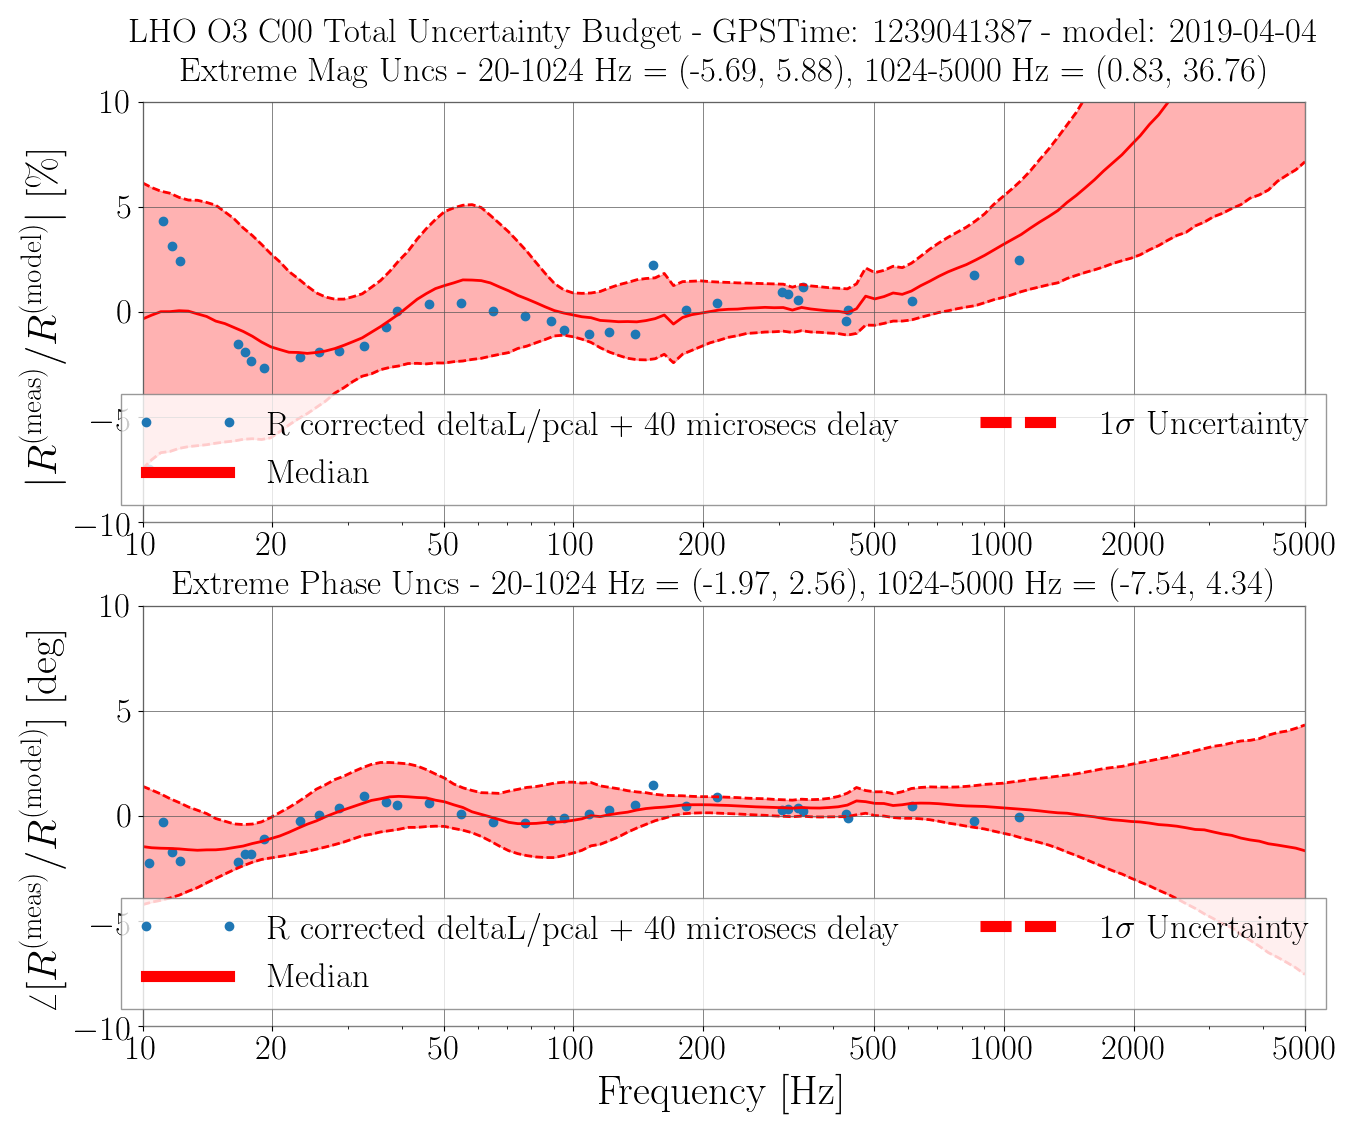
The results are attached as BB_deltaL/pcal and SS_deltaL/pcal files. With the response correction factors and a 40-microsecond delay applied, the results (red dots) look good. (Scripts are/ligo/svncommon/CalSVN/aligocalibration/trunk/Runs/O3/H1/Scripts/CALCS_FE/process_broadband_pcal_20190410.py and /ligo/svncommon/CalSVN/aligocalibration/trunk/Runs/O3/H1/Scripts/FullIFOSensingTFs/process_sweep_pcal2darm_20190410.py)

--------------------------------------------------

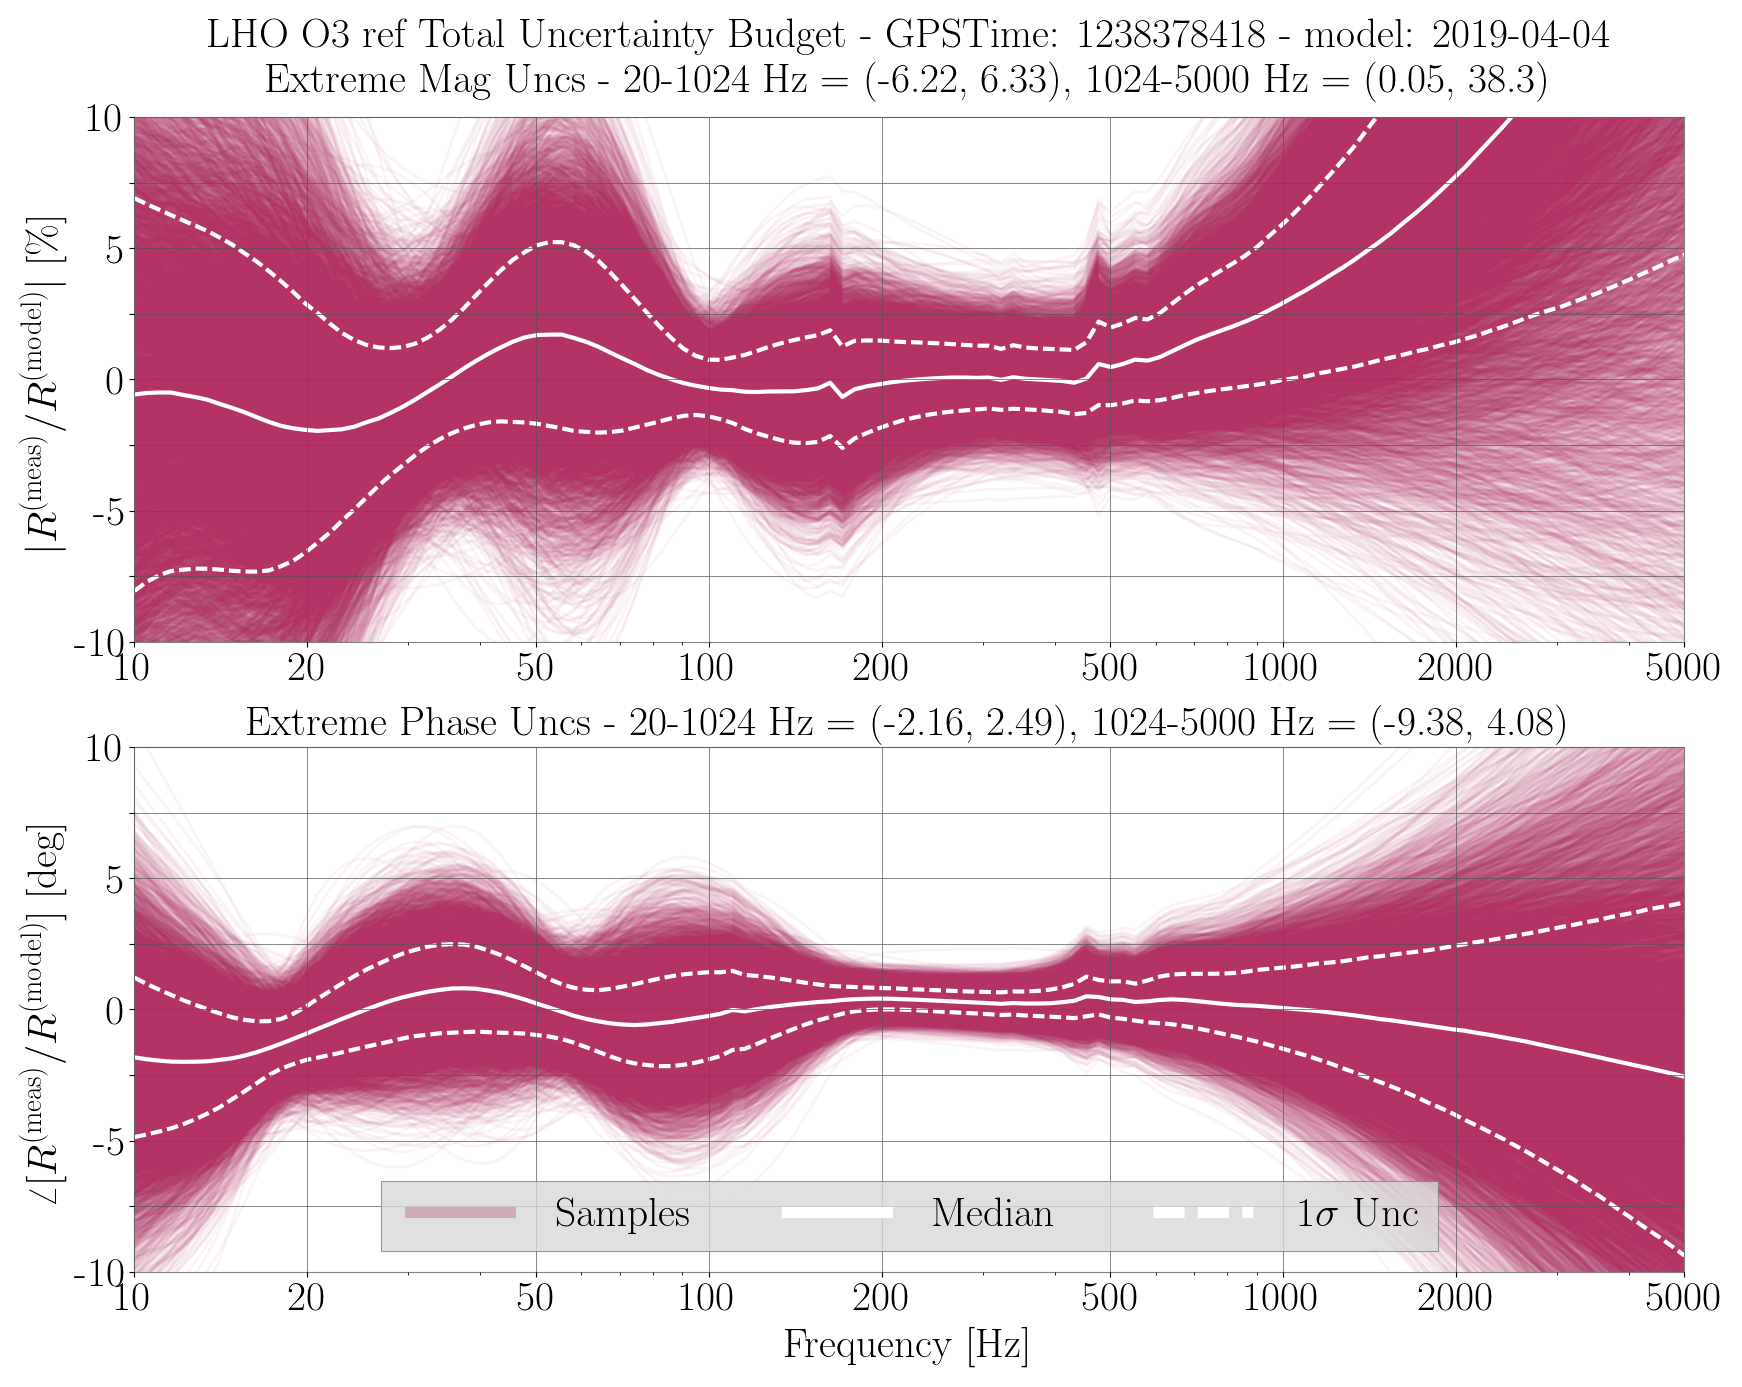
We also did an estimate of the uncertainty for the reference model (i.e. all kappas set to 1).

The GPR fitting using multiple measurements are shown in multi-meas-GPR.pdf (4 meas for sensing and 2 meas for actuation); Script -- /ligo/svncommon/CalSVN/aligocalibration/trunk/Runs/O3/H1/Scripts/Uncertainty/process_allmeas_writeGPRHDF5_20190404.py

The uncertainty plot for the reference model is attached.


Fitting details are as below:

---------------------------------------------------------------------
Sensing
---------------------------------------------------------------------
Inverse Sensing FOTON values: [NB: SRCD2N zpk gain based on sensing sign in parameters file]
SRCD2N: zpk([410.5556;0.0428+i*4.4689;0.0428-i*4.4689],[0.1;0.1;7000],1,"n")gain(1997.42)
Gain: gain(3.077e-07)

Inverse Sensing without cavity pole FOTON values for CFTD path: [NB: SRCD2N zpk gain based on sensing sign in parameters file]
SRCD2N: zpk([0.0428+i*4.4689;0.0428-i*4.4689],[0.1;0.1],1,"n")gain(1997.42)
Gain: gain(3.077e-07)

Parameter                                | Quantiles (0.15, 0.50, 0.84)
---------------------------------------------------------------------
Optical gain, H_c (ct/m)                 | 3.249e+06, 3.25e+06, 3.252e+06
Cavity pole, f_cc (Hz)                   | 409.8, 410.6, 411.3
Detuned SRC spring frequency, f_s (Hz)   | 4.425, 4.469, 4.513
Detuned SRC spring quality factor, 1/Q_s | 64.37, 52.19, 43.88
Residual time delay, tau_c (usec)        | 0.5522, 0.9963, 1.438
------------------------------- OR ----------------------------------
Optical gain, H_c (ct/m)                 | 3.25e+06 (+1430,-1408) or (+0.04399%,-0.04333%)
Optical gain, H_c (mA/pm)                | 4.34 (+0.001909,-0.00188) or (+0.04399%,-0.04333%)
Cavity pole, f_cc (Hz)                   | 410.6 (+0.7268,-0.7248) or (+0.177%,-0.1765%)
Detuned SRC spring frequency, f_s (Hz)   | 4.469 (+0.04354,-0.04401) or (+0.9743%,-0.9847%)
Detuned SRC spring quality factor, Q_s   | 52.19 (+275.5,-275.9) or (+18.94%,-18.92%)
Residual time delay, tau_c (usec)        | 0.9963 (+0.4416,-0.4441) or (+44.32%,-44.58%)

---------------------------------------------------------------------
UIM
---------------------------------------------------------------------
The Force Coefficient "answer" in terms of ...
    Force per count of longitudinal DAC request (just down stream of DRIVEALIGN bank):
    Gain = 7.67e-08 (N/ct)
    Force per actuator signal (current or voltage):
    Gain = 1.634 (N/A)
 
All MCMC Results (w/ Uncertainty) for UIM Parameters:
    Parameter                              | Quantiles (0.15, 0.50, 0.84)
    ---------------------------------------------------------------------
    Actuator gain, H_c (N/ct)              | 7.666e-08, 7.67e-08, 7.673e-08
    Residual time delay, tau_A (usec)      | 58.27, 61.05, 63.85
    ------------------------------- OR ----------------------------------
    Actuator gain, H_c (N/ct)              | 7.67e-08 (+3.684e-11,-3.709e-11) or (+0.04803%,-0.04835%)
    Residual time delay, tau_A (usec)      | 61.05 (+2.794,-2.786) or (+4.576%,-4.563%)

---------------------------------------------------------------------
PUM
---------------------------------------------------------------------
The Force Coefficient "answer" in terms of ...
    Force per count of longitudinal DAC request (just down stream of DRIVEALIGN bank):
    Gain = 6.036e-10 (N/ct)
    Force per actuator signal (current or voltage):
    Gain = 0.02947 (N/A)
 
All MCMC Results (w/ Uncertainty) for PUM Parameters:
    Parameter                              | Quantiles (0.15, 0.50, 0.84)
    ---------------------------------------------------------------------
    Actuator gain, H_c (N/ct)              | 6.033e-10, 6.036e-10, 6.039e-10
    Residual time delay, tau_A (usec)      | 38.6, 40.88, 43.17
    ------------------------------- OR ----------------------------------
    Actuator gain, H_c (N/ct)              | 6.036e-10 (+3.143e-13,-3.131e-13) or (+0.05207%,-0.05187%)
    Residual time delay, tau_A (usec)      | 40.88 (+2.296,-2.276) or (+5.617%,-5.569%)

---------------------------------------------------------------------
TST
---------------------------------------------------------------------
The Force Coefficient "answer" in terms of ...
    Force per count of longitudinal DAC request (just down stream of DRIVEALIGN bank):
    Gain = 4.727e-12 (N/ct)
    Force per actuator signal (current or voltage):
    Gain = 4.427e-11 (N/V**2)
 
All MCMC Results (w/ Uncertainty) for TST Parameters:
    Parameter                              | Quantiles (0.15, 0.50, 0.84)
    ---------------------------------------------------------------------
    Actuator gain, H_c (N/ct)              | 4.724e-12, 4.727e-12, 4.729e-12
    Residual time delay, tau_A (usec)      | 5.352, 5.947, 6.538
    ------------------------------- OR ----------------------------------
    Actuator gain, H_c (N/ct)              | 4.727e-12 (+2.411e-15,-2.393e-15) or (+0.051%,-0.05062%)
    Residual time delay, tau_A (usec)      | 5.947 (+0.5917,-0.5942) or (+9.951%,-9.993%)

Images attached to this report
Non-image files attached to this report
Comments related to this report
ling.sun@LIGO.ORG - 11:34, Thursday 11 April 2019 (48412)

As a sanity check, I have plotted the corrected PCAL to DARM sweep measurements on top of the uncertainty curves. They are consistent with each other.

Images attached to this comment
H1 CDS (CDS, ISC, Lockloss, SQZ)
richard.mccarthy@LIGO.ORG - posted 09:29, Wednesday 10 April 2019 - last comment - 11:44, Thursday 11 April 2019(48377)
UPS FAILURE ON SAFETY SYSTEM

In an effort for robustness we had installed a UPS on the safety system power supply last year to help ride through any minor power bumps.  This morning at 14:34 UTC the UPS failed and took down the lasers that are connected to it.   We probably would not have been down as long but I misinterpreted the error message.   It was a communication error the Term6-Term20.  I took this to mean term 20 which is the TCS CO2 laser interlock had failed.   Sure enough there were no link lights.  Swapped out the module but still not link lights.  So new interpretation is it was terminal through 20 not just 20.  Went to the chassis in the LVEAj and power was off.  The UPS that feeds the 24V power supply was off.  Bypassed the unit for now and the system has been restored.  Since we were down anyway rebooted the computer since it had been running for months.  Reset all the systems and turned on all the lasers that were off. Finishing with EY ALS.

Laser that went down.

TCS CO2-X

TCS CO2-Y

SQZ-

ALS X

ALS Y

Comments related to this report
betsy.weaver@LIGO.ORG - 11:44, Thursday 11 April 2019 (48413)

FRS 12699

H1 ISC (ISC)
craig.cahillane@LIGO.ORG - posted 21:21, Tuesday 09 April 2019 - last comment - 16:11, Monday 15 April 2019(48366)
Calibration group, Hall, and Ward DARM plants are not sufficient to explain the phase behavior seen in the DARM plant at frequencies below 10 Hz
We've measured the DARM plant to have a prospring at 6 Hz and a Q of about 4. About the spring frequency, the phase goes through around -90 degrees, and not the expected +180 degrees alog 48083 

This +180 degrees is not typical for causal control systems, but it is expected from SR IFOs as discussed in Section II B from BnC.

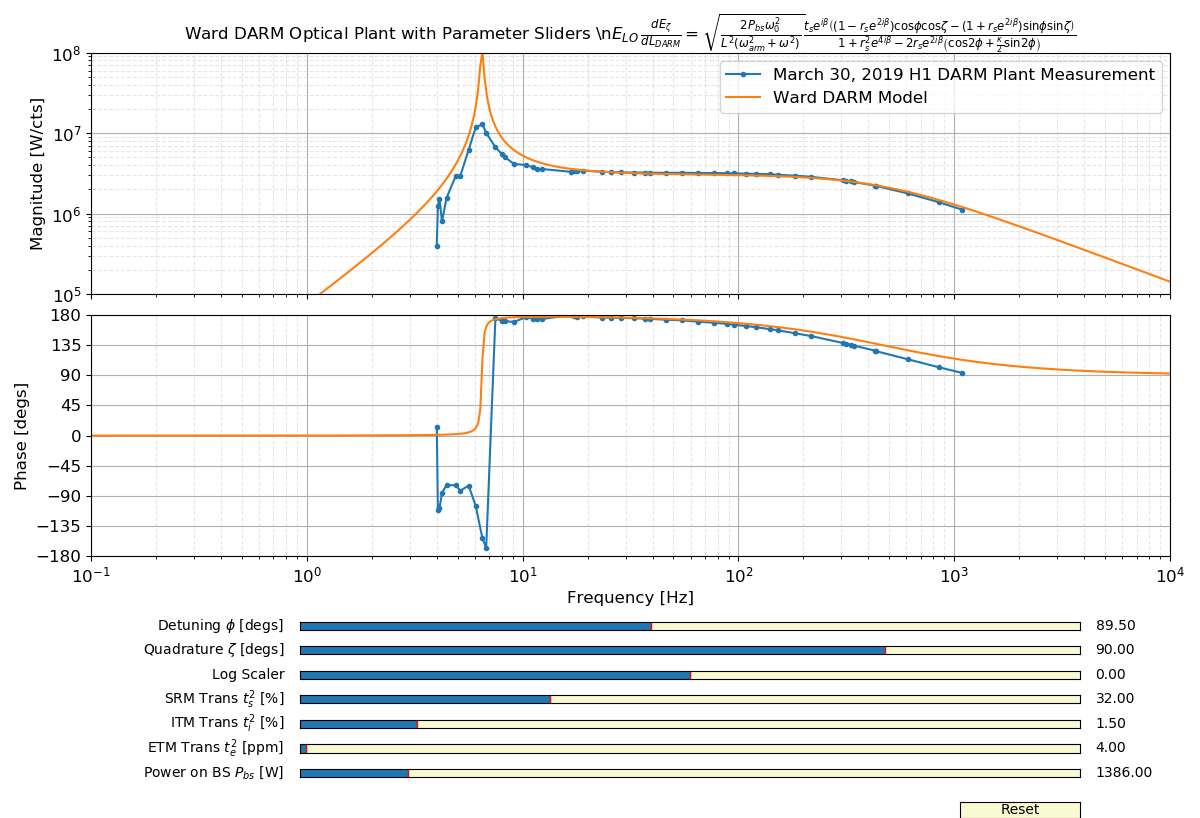
Using the Ward DARM model (Eq 3.83) I was unable to achieve a satisfactory fit of the H1 DARM plant at low frequencies, so I made some sliders to see if I could get a heuristic match.  I was not able to for reasonable IFO parameters.

I discovered that our Q is far too low given our optic transmissions.  One can lower the Q of the optical spring by increasing the SRM transmission or reducing the ITM transmission.  However, changes to these parameters also change the frequency of the optical spring and the DARM pole.  The pictured plot shows the best Ward model I was able to come up with to explain the current plant, featuring detuning of -0.5 degrees.

DARM Plant Measurement
I began questioning the measurement itself, but the procedure is pretty simple.  A PCAL to DARM measurement gives C/(1 - G), where C is the DARM plant, and G is the DARM OLG.  Then a DARM OLG is taken to get 1/(1 - G), and these two measurements are divided to give the DARM plant C. 
 
The PCAL calibration into meters is just two real poles at 1 Hz.  This has phase of -160 degrees at 6 Hz, i.e. there is some dynamic phase rotation happening at LF due to the calibration which may not be real.  
Images attached to this report
Non-image files attached to this report
Comments related to this report
evan.hall@LIGO.ORG - 20:01, Wednesday 10 April 2019 (48405)

Does it change with arm power? dc offset power? Does AS45 see the same feature?

craig.cahillane@LIGO.ORG - 16:11, Monday 15 April 2019 (48510)
March 13 antispring DARM plant at 30 W Input Power and 0 W on SR3 heater: 47493

March 18 antispring to prospring at 30 W Input Power with 0 W to 5 W on the SR3 heater: 47604

March 20 prospring at 35 W Input Power with 5 W on SR3 heater: 47728

April 12 prospring at 35 W with 5 W to 3.5 W on SR3 heater: 48453

There have not been tests for the following:
- Spot positions (for L2A2L effects)
- SRCL offset
- DARM offset

Based on the above results, I think that higher arm power and higher SR3 heater power both push the DARM optical prospring to higher frequency. 

Danny Vander-Hyde tells me that the SRC gouy phase goes like around ~1 degree/watt of SR3 disk heater power, so we probably change the SRC gouy phase by ~5 degrees on March 18. 
H1 ISC
filiberto.clara@LIGO.ORG - posted 11:17, Tuesday 09 April 2019 - last comment - 19:34, Wednesday 24 June 2020(48338)
OMC DCPD (PI) Reackback Channels

WP 8158

AA chassis S/N S1102788

Channels 13-16 were modified with faster OpAmps for U2 and U3. New opAmp installed ADA4075-2ARZ. Same mods as were done with the CM SQZ readback channels, alog 47459.
Verified the following capacitors for the Twin T notch were all removed as mentioned in alog 28010 (CH15 & 16): C1, C3, C4, C5, C6, C7, C9, C10, and C11.

F. Clara, J. Kissel, D. Sigg

Comments related to this report
jeffrey.kissel@LIGO.ORG - 17:52, Wednesday 10 April 2019 (48358)CAL, CDS, ISC
F. Clara, J. Kissel, D. Sigg

While the team had the OMC DCPD's AA chassis out in the shop, I gathered transfer functions each channel,
    (a) to confirm their functionality after the ECR change (E1900105)
    (b) to understand the DC gain of the chassis better, given the recent confusion about AA chassis gains (see LHO aLOG 48272 and IIET Ticket 12642)

It turns out, in the heat of battle, I measured the wrong channels for the low-frequency (i.e. gravitational wave channel) versions of the OMC DCPDs -- CH13 and 14, I measured 4 channels over, CH09 and 10. 
But I still learned a lot.

Here're my conclusions:
(1) The low-frequency channels I measured (CH09 and CH10 of the AA chassis) behave as expected, with a DC gain of 1.0 +/- 0.04%, and a butterworth lowpass with a notch at *roughly* 65 kHz (measured minimum magnitude's frequency within 2% of 2^16 Hz), and suppression *at* 2^16 Hz for both channels is -90 dB = 3e-5 V/V.
(2) The PI channels for the OMC DCPD (CH15 and 16 of the AA chassis) have had all anti-aliasing removed, and the through-signal has no modification of signal from DC to 10 kHz, and above 10 kHz, at MOST a 0.25% / 1 deg change up to 100 kHz.
(3) As far as measuring the low-frequency "DC" gain of the AA channels, electrical grounding of measurement equipment is very important. If one does *not* properly reference all equipment to a common ground, i.e. leaves the ground floating, then the data will errantly suggest that the DC gain of the AA chassis is 0.99, the frequency of the notch will shift, and the depth of the notch will also shift.

Check out the first attachment 2019-04-09_H1OMC_AAChassisTFs.pdf. 
The first two pages shows the "final answer" for CHs 09, 10, 15, and 16 for the OMC AA chassis, as reported with correctly grounded test equipment.
The legend label "CHSGND" stands for "properly referencing the measurement equipment to the AA CHaSsis GrouND." "FLTGND" stands for "the ground of the measurement equipment is FLoaTing with respect to the chassis GrouND."
The third page shows what happens what you measure the coil driver test box (D1000931) with proper grounding (as was done in today's measurement) vs. the ground floating (i.e. as shown in all of the diagrams in -v1 of D1900027-v1). One can clearly a reported gain of 1.983 V_{se}/V_{diff} when the ground properly referenced, and a reported gain of 2.002 V_{se}/V_{diff} when floating.
The fourth page shows what happens when you measure the anti-aliasing channels with proper grounding (as was done in today's measurement) vs. with the ground floating. Here, one can clearly see that with the floating ground, the AA notch has far less Q and the notch frequency is much more variable.

Unfortunately with today's measurement, we had the rare treat of being able to pull the chassis out of the rack, pull off the lid, and directly access test points and grounding pins the filter board (D070081). Rarely do we get this luxury, as we're often stuck in the rack, at an end station, having to use the clumsy SCSI breakout board.

The second attachment (AAChassisSetup_20190409.pdf) shows the proposed method of performing this clumsy technique while paying much better attention to referencing a common electrical ground.

The third attachment (2019-04-09_AAChassis_Meas_Pics.pdf) shows some pictures of what it was like today, comparing properly grounded configurations and floating configurations that correspond to

I believe the lack of attention to (3) is what has lead LHO to measure a low-frequency gain of 0.99 back in ER7/ER8 (i.e. in 2015), and we've been using the model from that data set for both AA and AI filters for *anything* that has one since then. That model is 
    ^/trunk/Runs/ER8/H1/Scripts/AAAI/20150813_H1ER7_AA_upto10kHzFitLTI.mat
which we used for O1 and O2, and has now been unceremoniously dumped into a new .mat file in a python compatible format, but in doing so lost its origin story, 
    ^/trunk/Common/pyDARM/H1aa.mat
which is now used for O3.

I've followed the rabbit hole of that model, which lead me to the last time we systematically measured the PCAL AA chassis, in May 2015 (see LHO aLOG 18658), during Pre ER7 times, which was processed by the script 
    ^/trunk/Runs/PreER7/H1/Measurements/ElectronicsMeasurements/process_H1PCALEX_AA_Measurements_20150527.m
which reveals a plot that I re-attach because I couldn't find the aLOG in which I said I'd write about it.
Check out the fourth attachment, 2015-05-26_H1PCALEY_AAChassis_S1203519.pdf.
It has a DC gain of 1.0 +/- 0.02%, which is *not* the case for the model we've been using for the AA chassis since ER7.

That model, came from Kiwamu's processing script, 
     ^/trunk/Runs/ER8/H1/Scripts/AAAI/gen_H1ER7_AA_upto10kHzFitLTI.m
which took data from  
     ^/trunk/Runs/PreER7/H1/Measurements/ElectronicsMeasurements
which just like above, uses the Coil Driver Test Box to create a differential signal, whose transfer function, 
     ^/trunk/Runs/PreER7/H1/Measurements/ElectronicsMeasurements/TESTBOX_CH1In_Pins1-6Out_2015-05-19_092805.txt
you can clearly see has a gain of 2.002 V_{se}/V_{diff} instead of the properly grounded 1.983 V_{se}/V_{diff}.

No bueno!!

Well -- hopefully now this lesson has been learned -- we'll update our calibration group documentation in such a way that hopefully this mistake will never happen again. AND we'll save a new python-friendly model, likely based on the data that Joe / LLO originally put together in 
     ^/trunk/Common/Documents/T1500165/
or we'll go around and measure every AA and AI chassis properly.

The message: AA and AI filters have a DC gain of 1.0 +/- 0.0(something)%, so we should stop treating them as otherwise.
Non-image files attached to this comment
jeffrey.kissel@LIGO.ORG - 19:34, Wednesday 24 June 2020 (56212)ISC
Wrapping up loose ends from O3, I've plotted the 2019-04-09 measurements for channel 09 and 10 (i.e. OMC DCPD A and B) against the model of the AA chassis that we used throughout O3 in the calibration models. 

While one might immediately get alarmed by the 1.01 gain discrepancy with the measurement and the H1aa.mat model -- this is again a relic of the poorly grounded measurement that Kiwamu took as described above. 

The calibration group has danced around this H1 model issue by dividing out the DC gain of the model every time it appears in calculation of the sensing function or the corrections to the PCAL channels, as discussed in originally in IIET Ticket 12642, which has now been closed and transferred to the pyDARM 2.0 git repo's Issue 11.

This is why I show the L1aa.mat model too -- which was created with the correct gain -- but is otherwise identical in frequency response.

The conclusion remains the same: using the either model, as long as the DC gain normalized out, provides a good model of H1's measured response for either channel with negligible systematic error (growing with frequency only to 1.0005% / 0.1 deg by 1 kHz and only 1.004% / 0.6 deg at 5 kHz).

In fact, because the systematic error for each channel coincidentally are in opposite directions, when averaged as is done in the control system (balanced with gains as mentioned in LHO aLOG 47217 and then further tweaked with the preceding filter modules as described in 47257), the frequency dependence of the two channels probably "cancels" to even smaller systematic error (tracing out all the digital gains, doing the math, and making some further plots is probably in order, but not worth it at this time.)

Since the world has moved to python, the script to produce these plots is in the same folder as the previous study, but y'know, in python: 
/ligo/svncommon/CalSVN/aligocalibration/trunk/Common/Electronics/H1/Scripts/
    plot_omcaachassis_20190409meas_vs_O3Bmodel_20200624.py

(and, of course, uses the same properly grounded AA chassis data, divided by the properly grounded test box data.)

The models live in
/ligo/svncommon/CalSVN/aligocalibration/trunk/Common/pyDARM/
    H1aa.mat
    L1aa.mat


EDIT: As a bonus, I also plotted the H1 EY PCAL RXPD AA chassis channel as well (just modifying the python script called out above, which now isn't so accurately named, but so be it). I only divided it against the L1 model, since we now know the H1 model is just different by a gain. The H1 EY PCAL RXPD AA chassis channel is similarly, negligibly different from the L1 model.
Note -- have this also be negligible is important for sensing function measurements, for which we divide DARM_IN1 by PCAL, and in doing so, we sneakily assume (because we assume AA chassis channels are the same) that the AA's cancel, and we don't have to account for this frequency dependence. 
Non-image files attached to this comment
H1 ISC (ISC)
craig.cahillane@LIGO.ORG - posted 00:47, Saturday 23 March 2019 - last comment - 16:51, Wednesday 10 April 2019(47784)
Locking in high noise coil drivers (~90 MPc range) to combat 4.1 Hz + microseism for overnight observing
Anamaria, Georgia, Danny, Corey, Craig

Locking has been a problem since we keep saturating our ETMX PUM drive.
The problem is a combination of this oft-referenced 4.1 Hz ringing somewhere in our pitch ASC (from the control signal, CHARD P is the most likely culprit), in combination with high microseism finding it's way into the PUM length drive.  Together, these two effects ask too much of the PUM stage and causes locklosses.

Similar to last night, we've sacrificed range for stability to get more observing time for ER14.  We decreased L2 LOCK gain from 23 to 15, increased L1 LOCK gain from 1.06 to 1.16, and left all quad coil drivers in the "1" high noise state rather than the "3" low noise state.  These changes are in guardian.  We have not tried putting the coil drivers into low noise with the gain changes.  

We updated and checked the calibration, it seems fine from 25 Hz up, so the high noise is real.

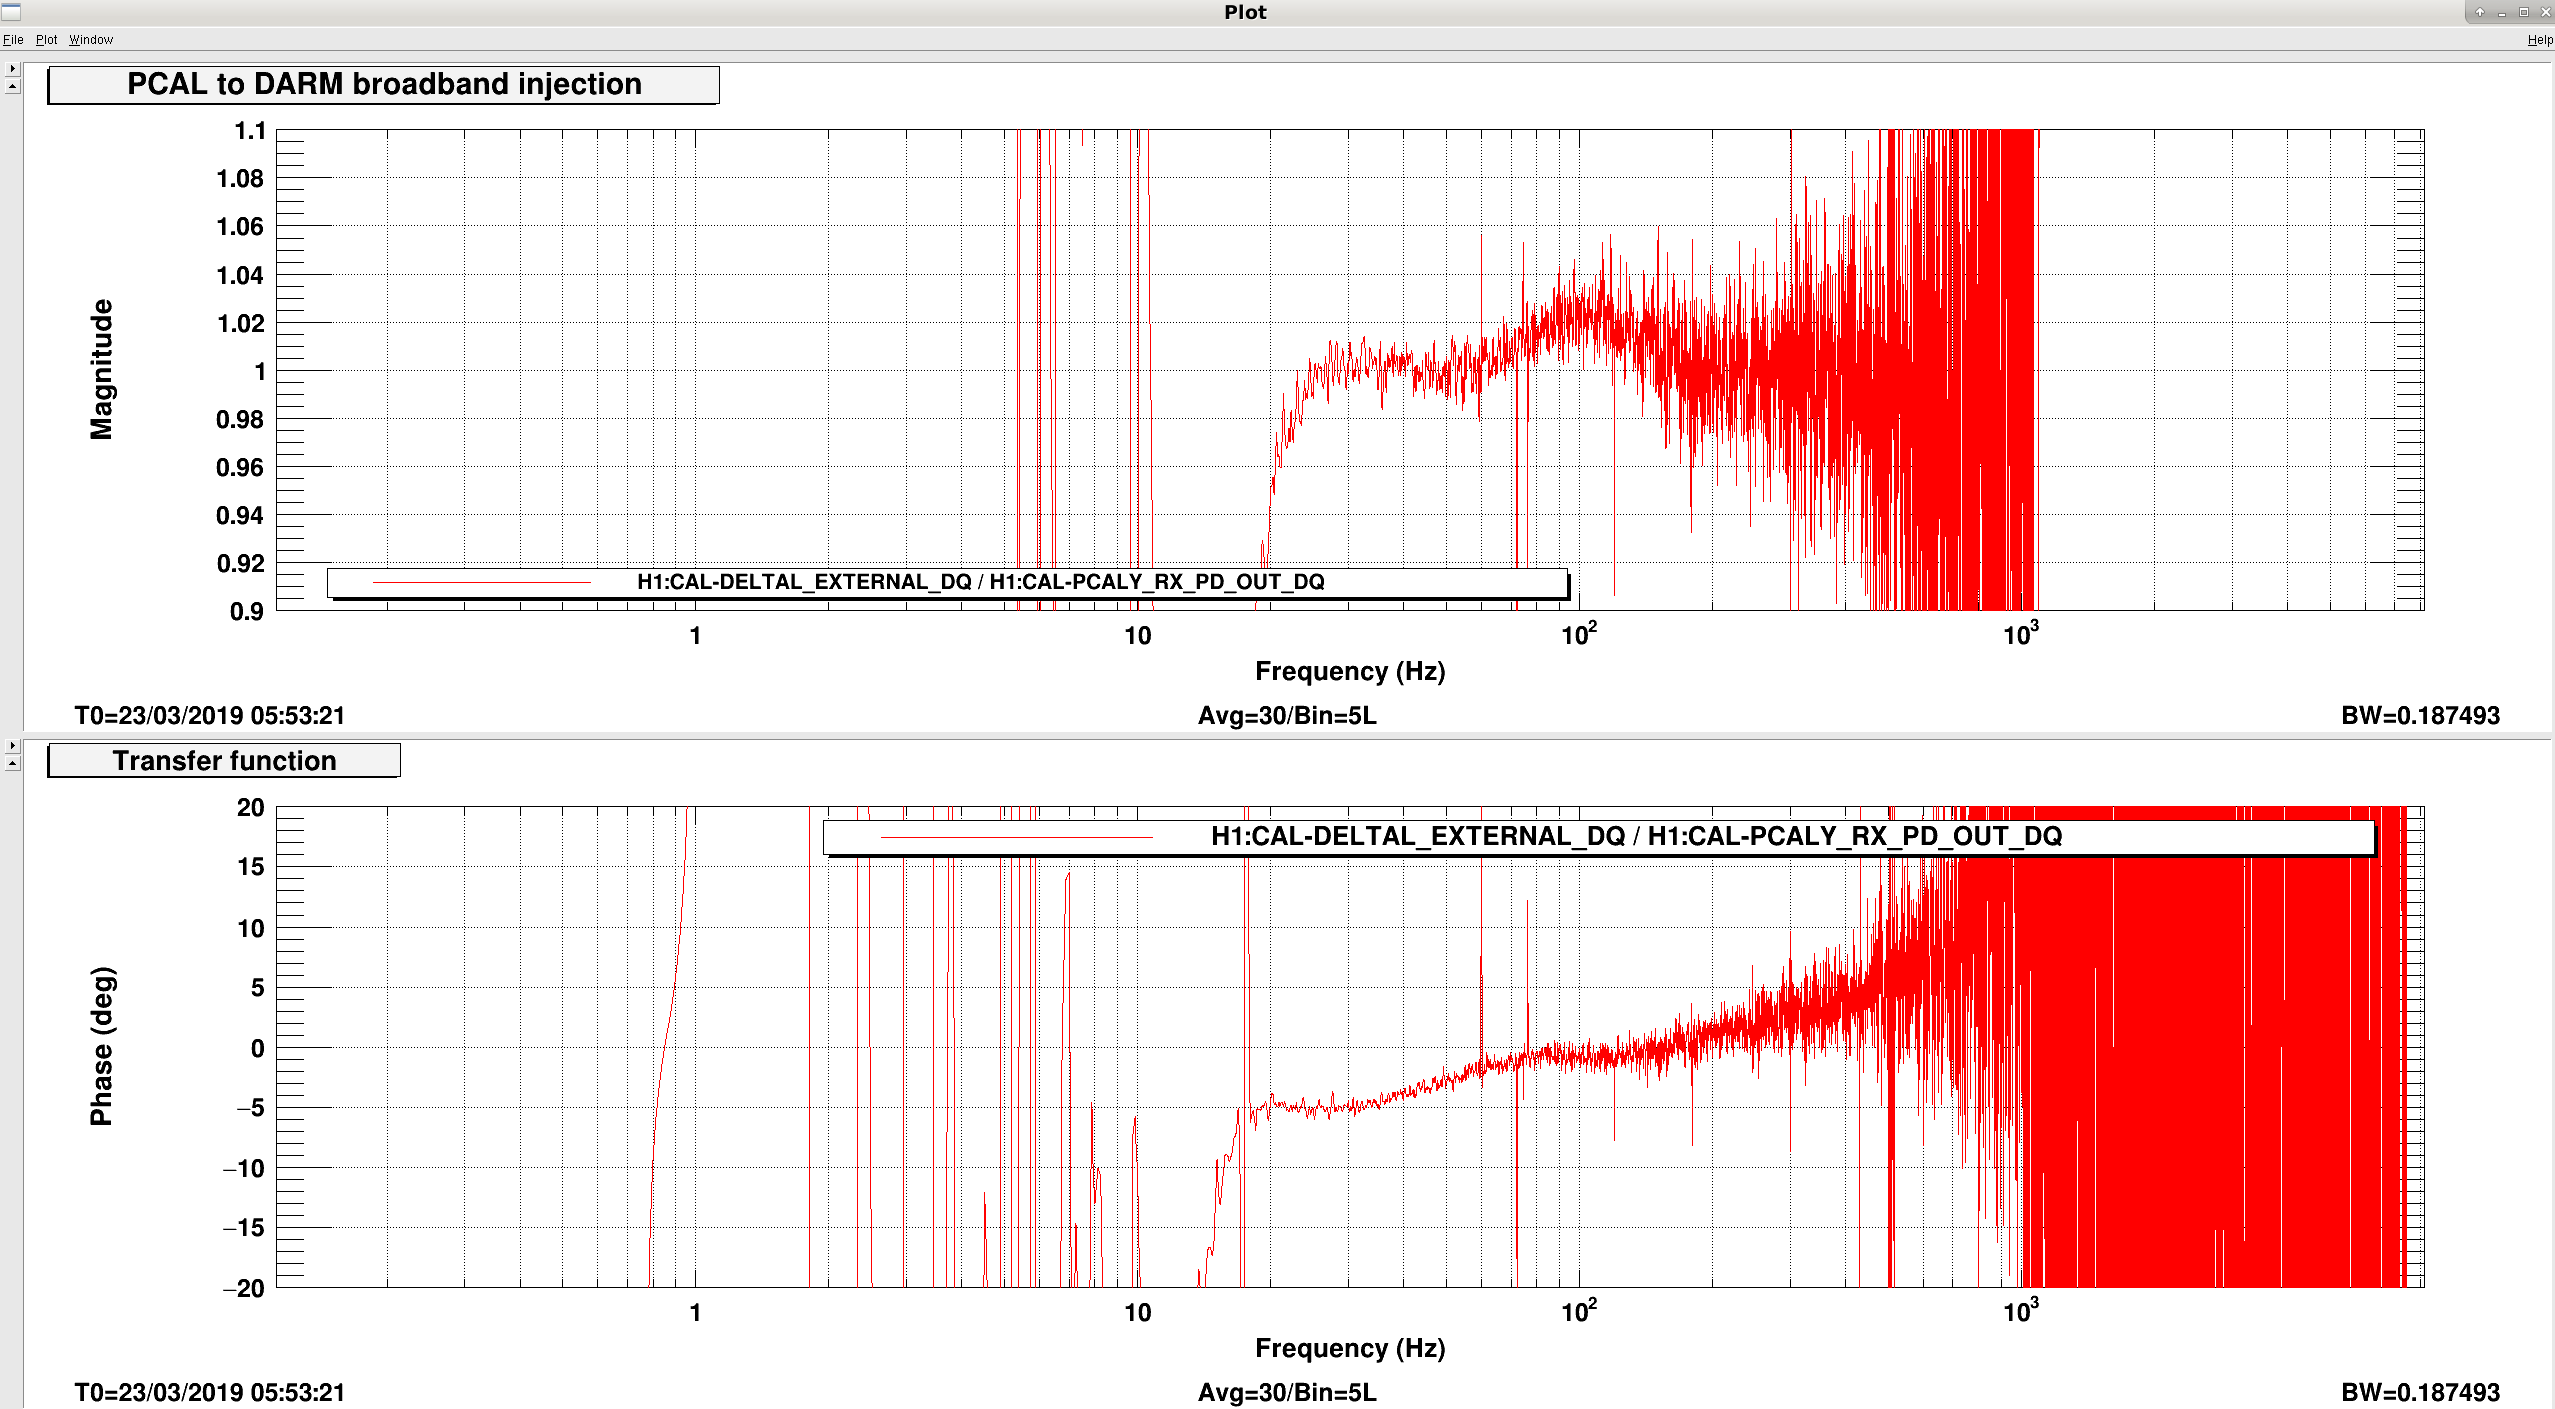
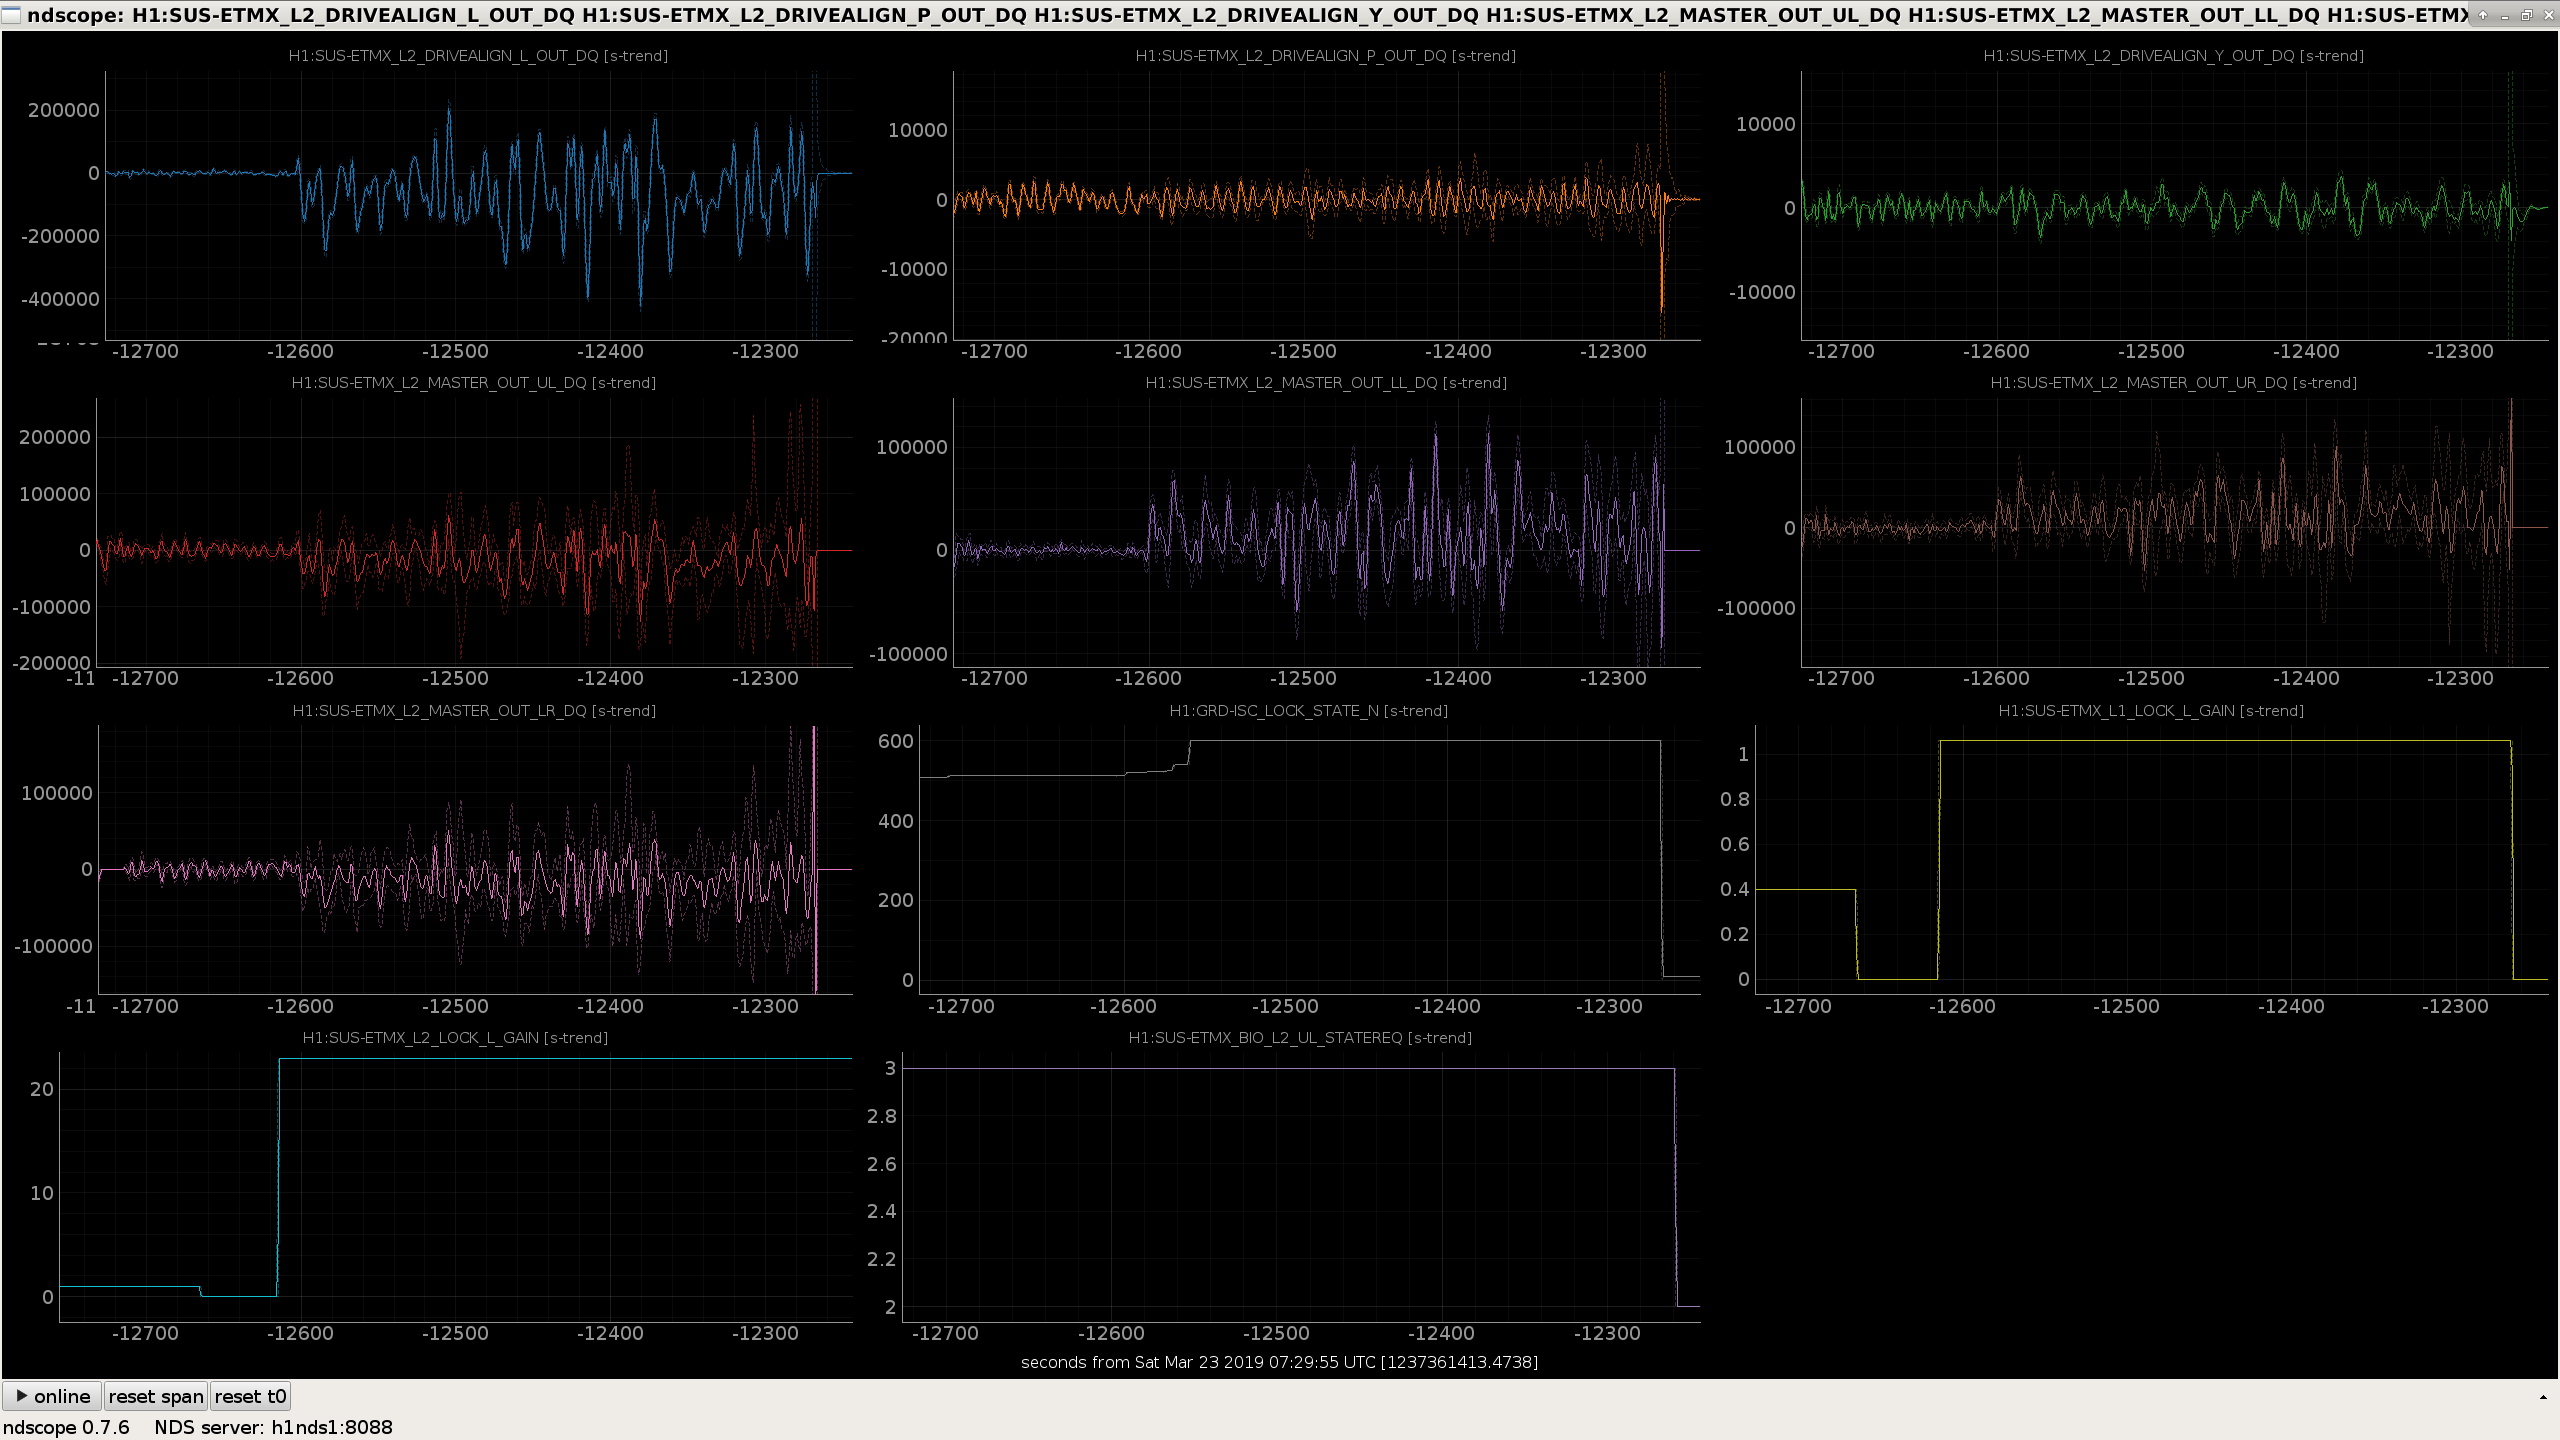
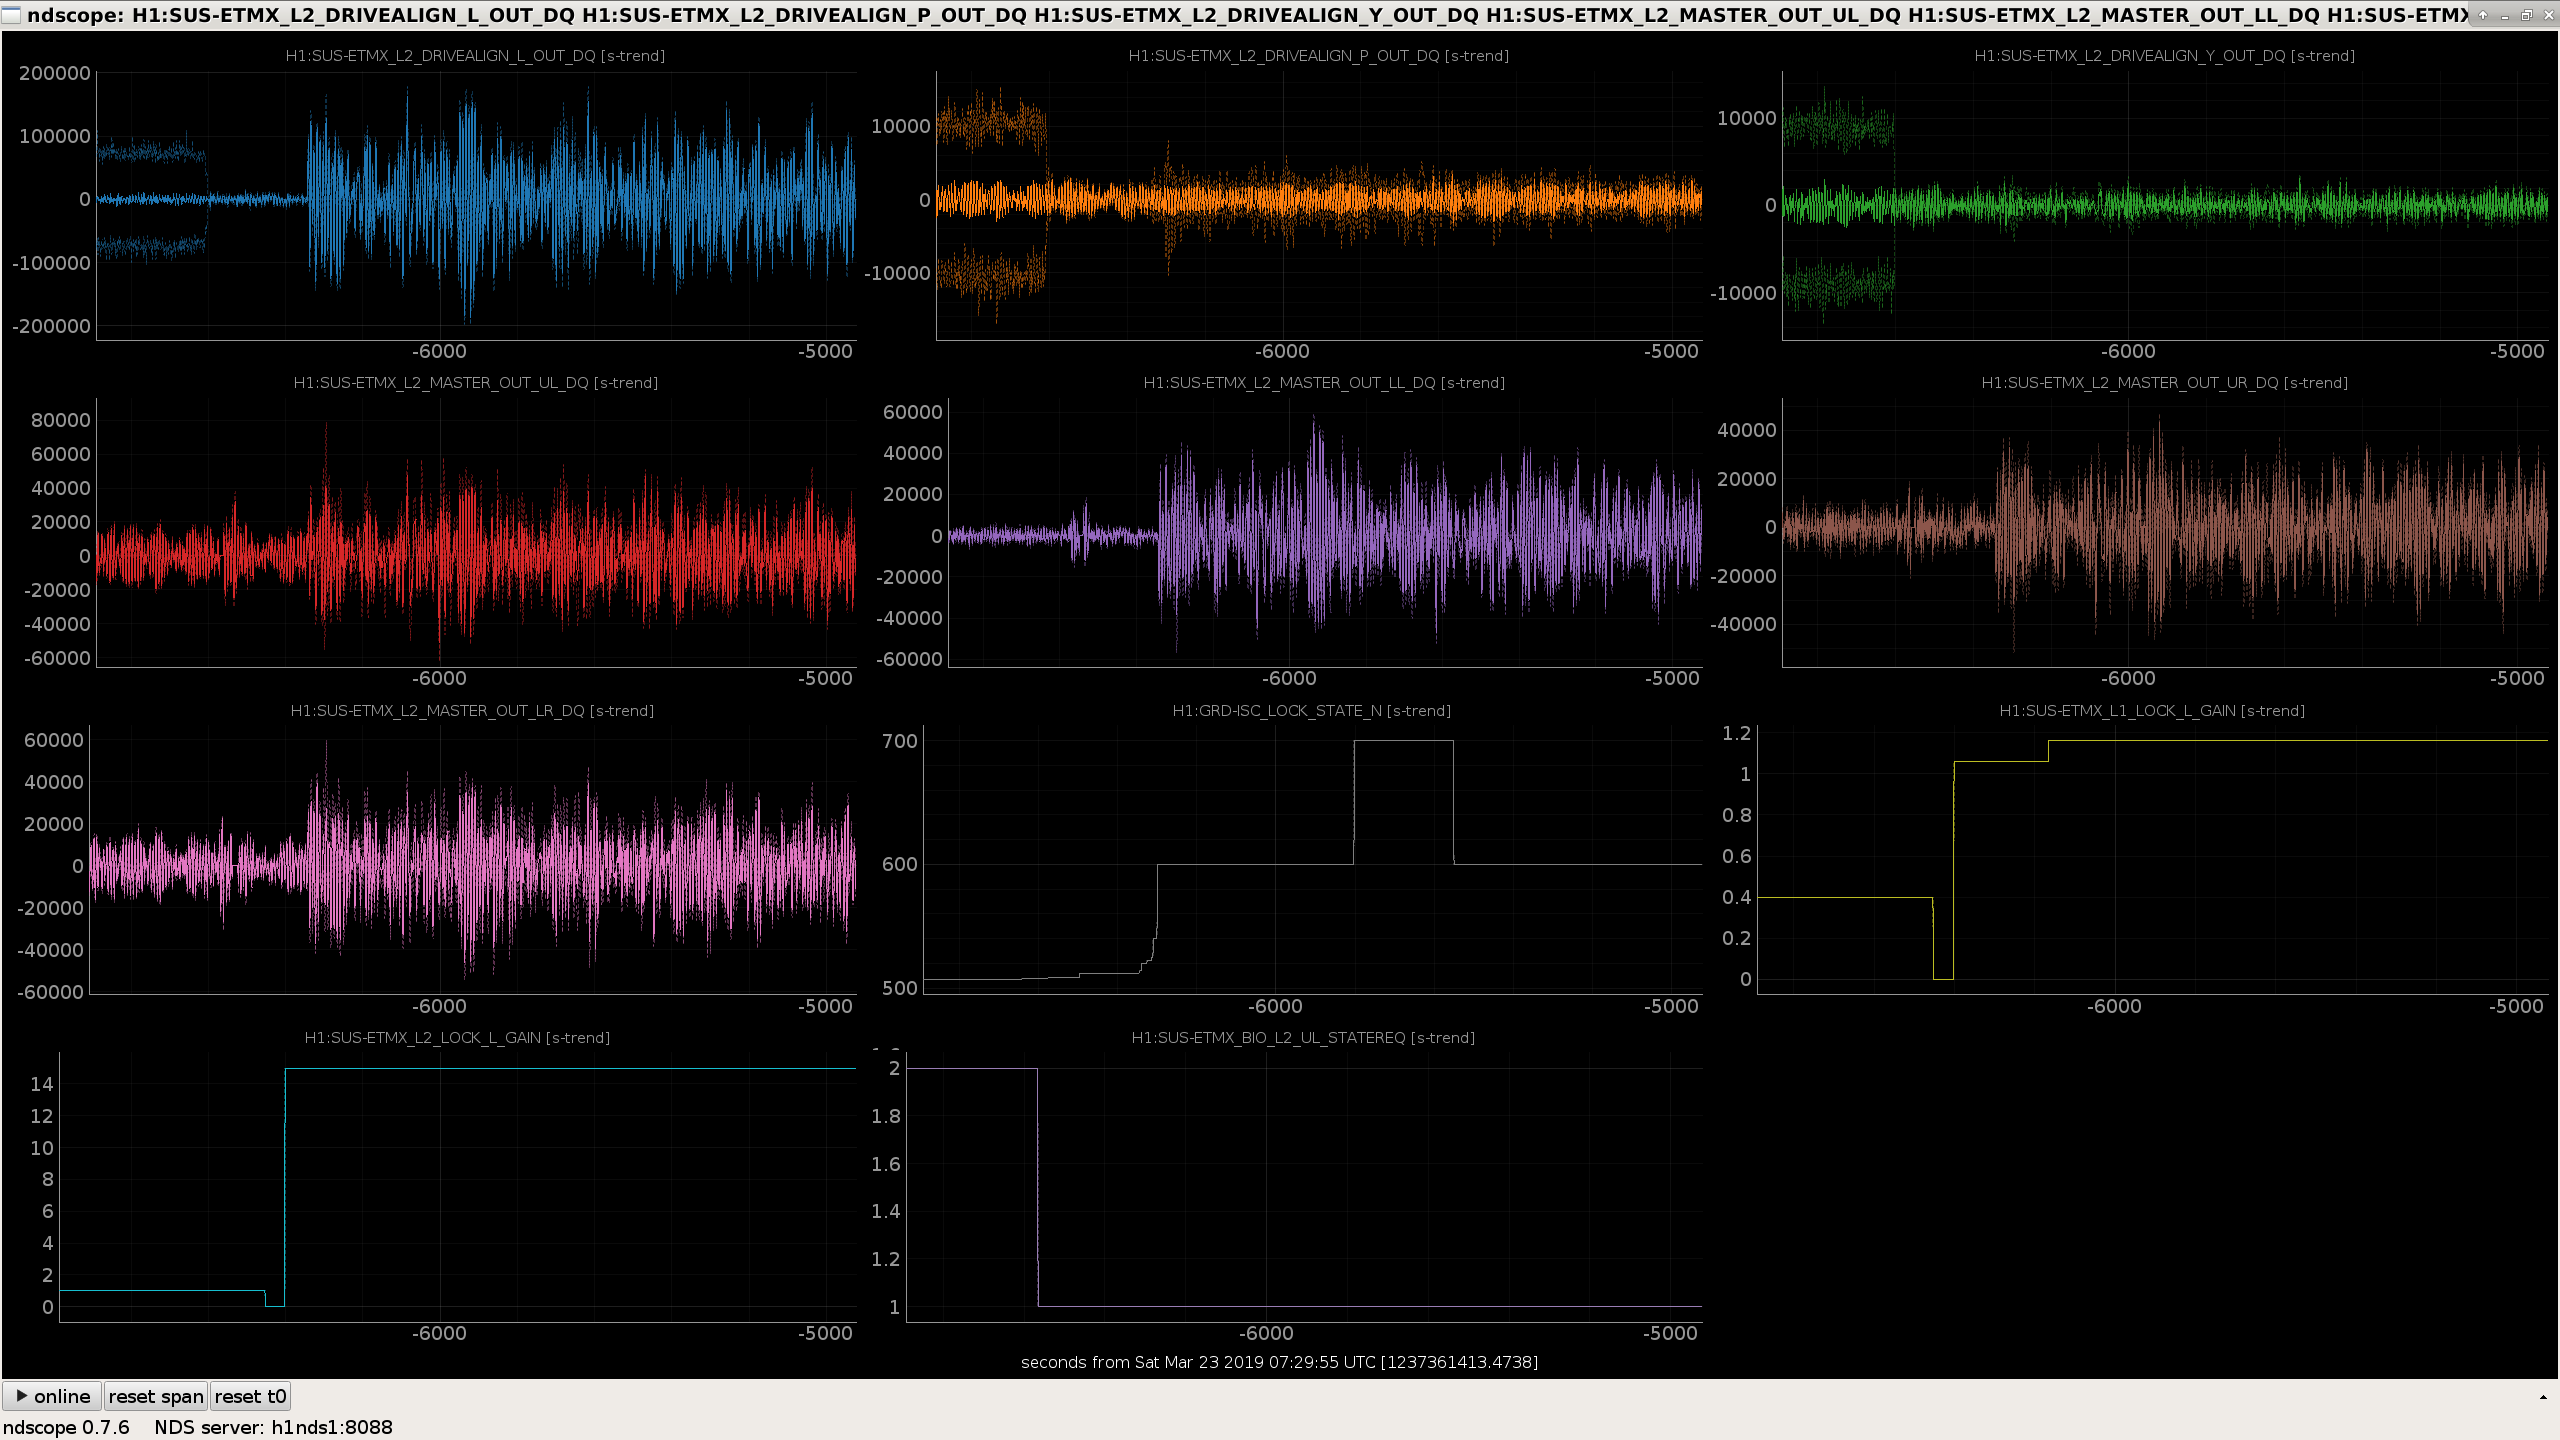
The first attachment is the PCAL BB injection.  The second is the ETMX PUM Coil MASTER OUT channels before changing the suspension hierarchy around.  The third is the same plot after.  It is clear our coils were saturating before, and now are not coming close to their rails.  More thought required on why our LSC microseism is showing up so strongly in PUM.
Images attached to this report
Comments related to this report
georgia.mansell@LIGO.ORG - 02:11, Saturday 23 March 2019 (47788)

Looking at the sensemon range FOM, it seemed like we were losing ~10 Mpc when we locked with lower ETMX L2 gain and higher range on our coil drivers.

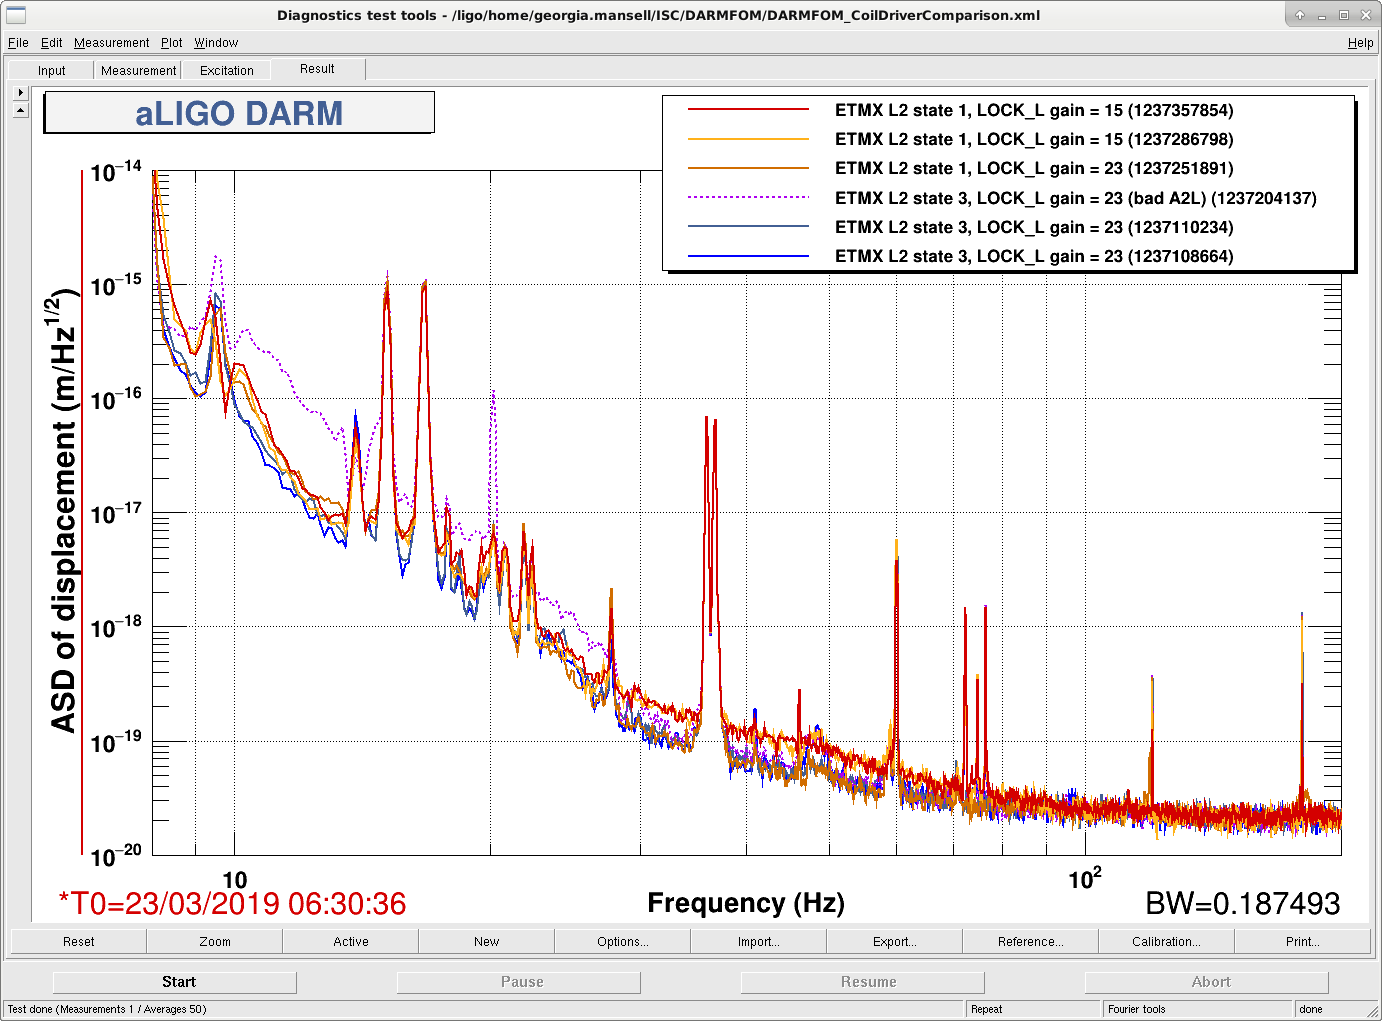
I had a look at the DARM spectrum during a few locks over the last few days, it seems like in locks with low ETMX L2 gain there is additional broadband noise in DARM from 28 - 80 Hz. There's at least one lock with the coil drivers in their high range state (state 1) , and nominal L2 gain, and the noise in DARM is lower (brown trace).

Images attached to this comment
georgia.mansell@LIGO.ORG - 03:22, Saturday 23 March 2019 (47789)

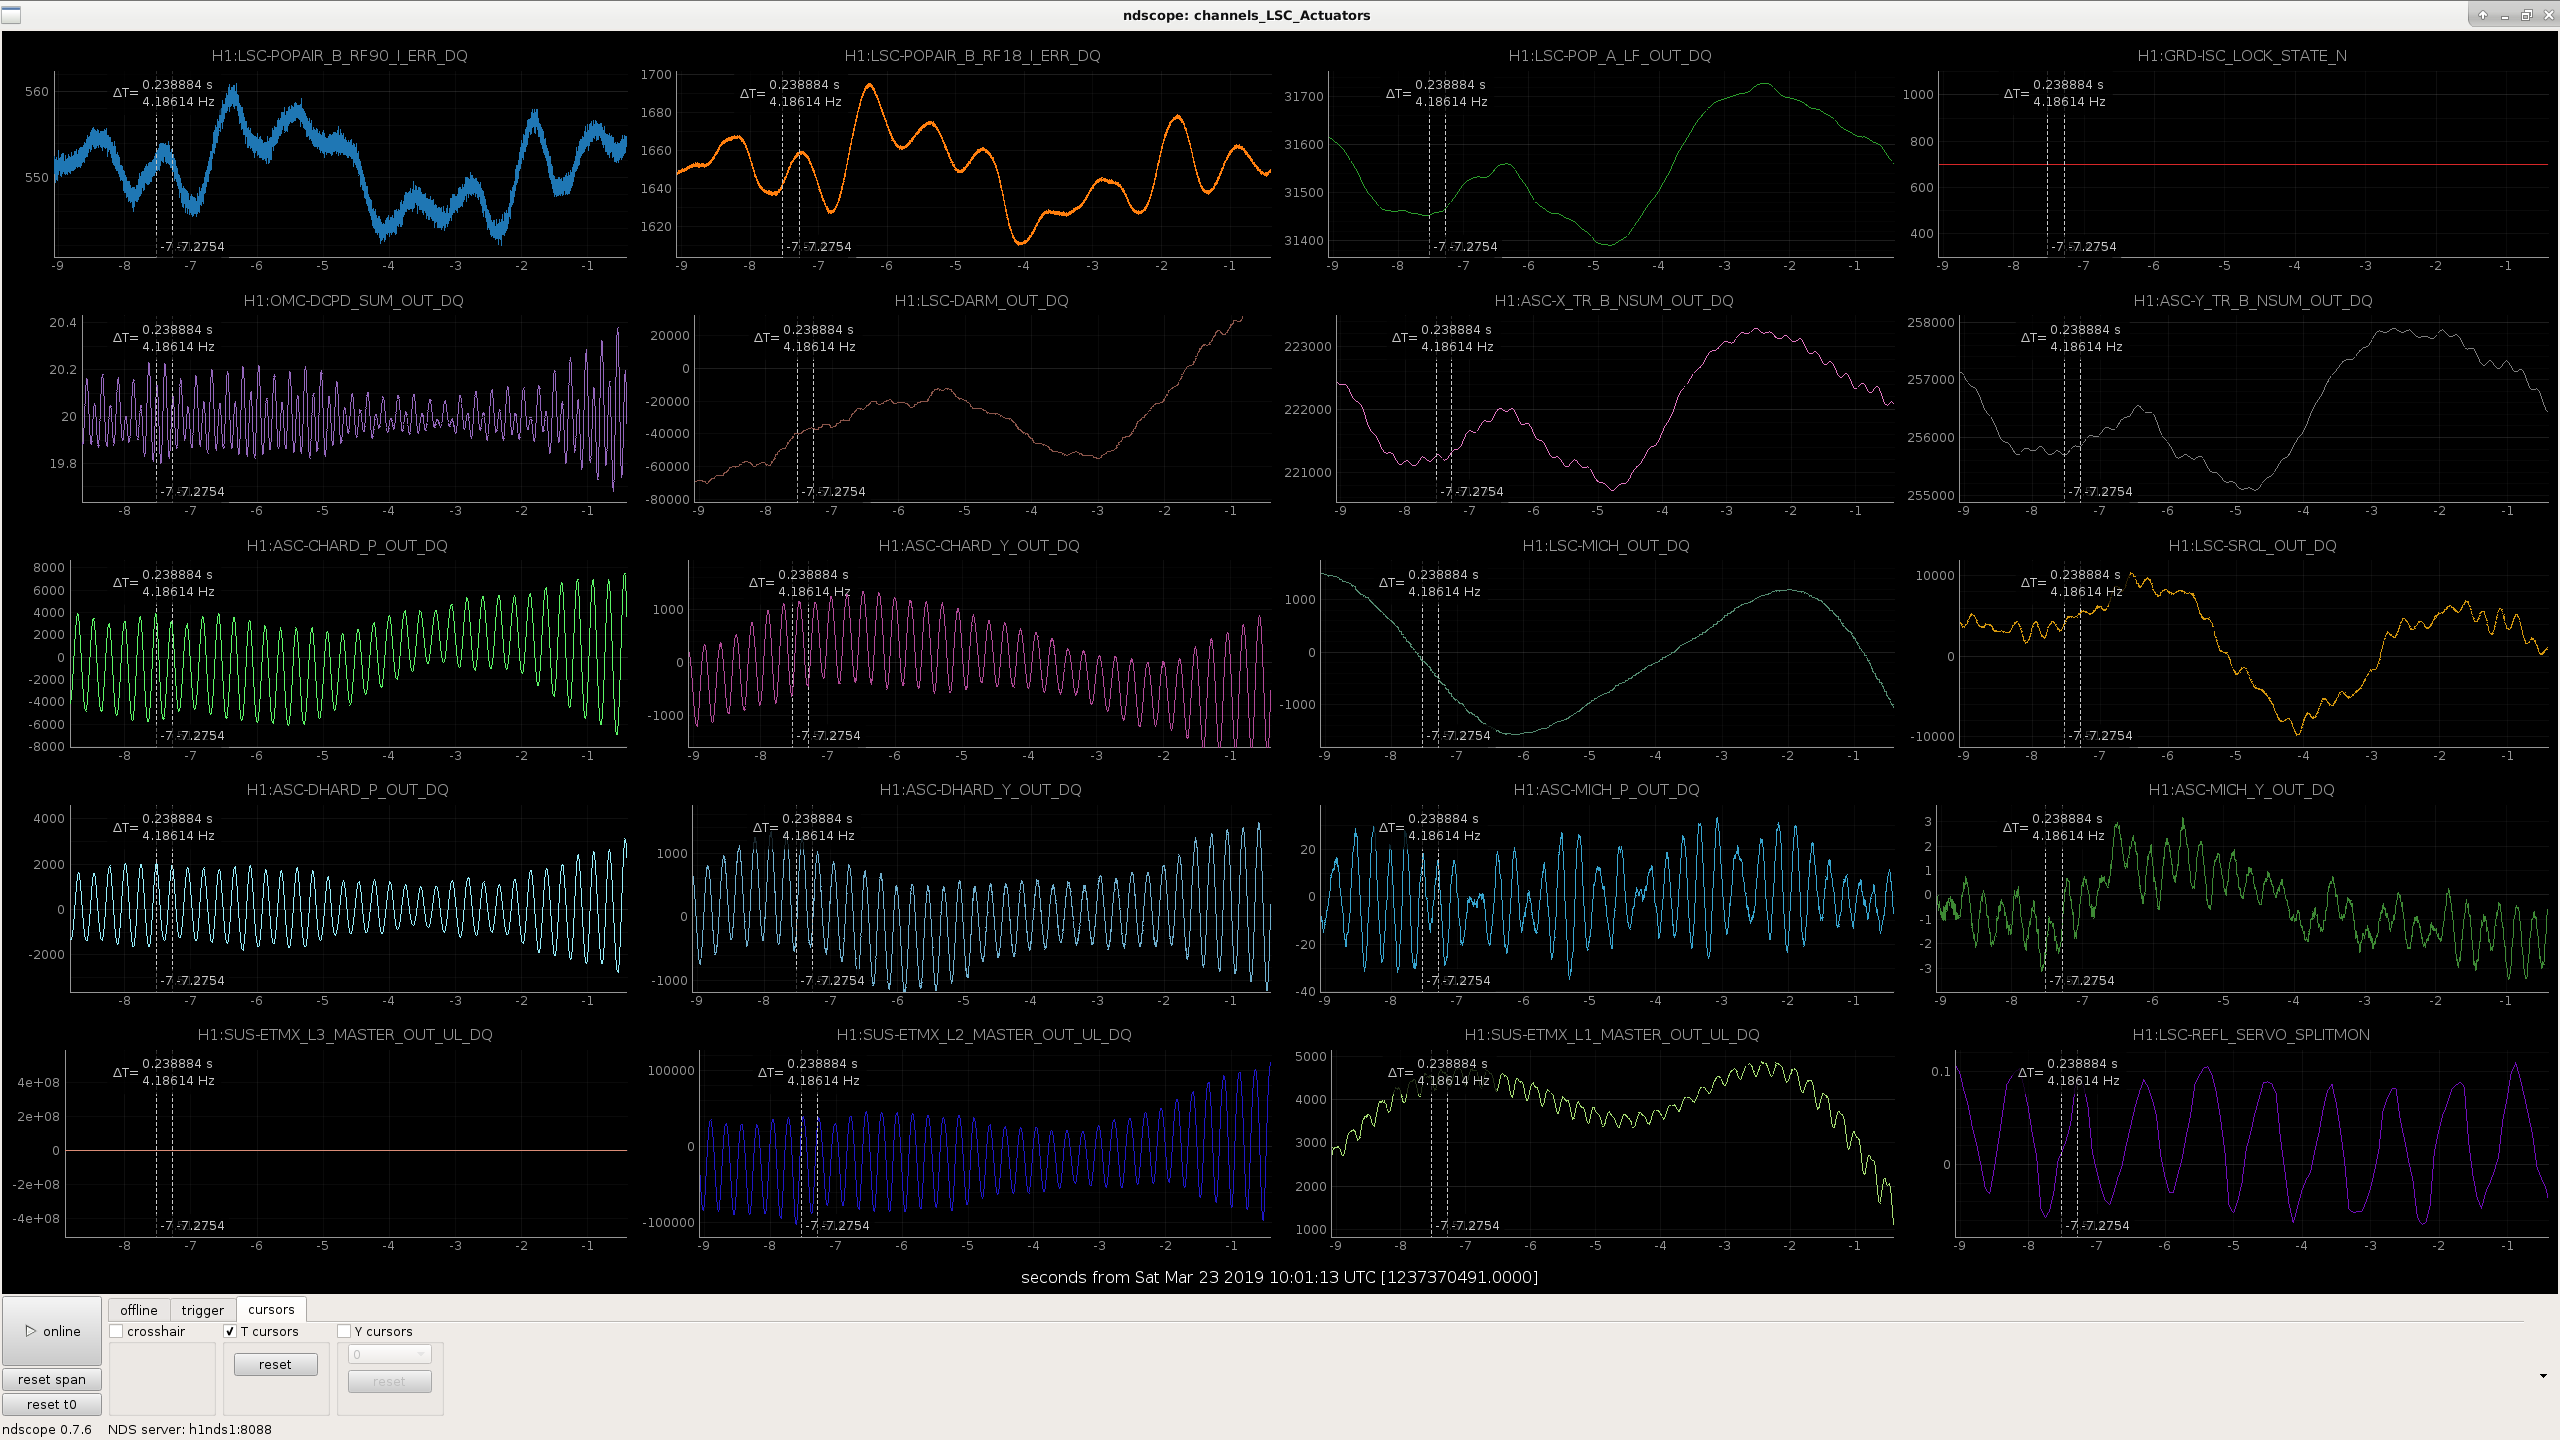
We had a lockloss at 1237370491 due to the 4.2 Hz ringup again, even after we changed the ETMX_L1_LOCK and ETMX_L2_LOCK gains. Looking at the drive to ETMX L2 (bottom row, second-from-left in attached plot), our gain changes are doing their job - the low frequency drive to L2 is small - but the 4.2 Hz is still too big (most noticeable in CHARD_P, the pale green trace, but dominating all the arm ASC DOFs). Also of note is that this signal shows up at twice double the frequency in the OMC DCPD SUM channel (second-from-top row, leftmost plot).

Images attached to this comment
anamaria.effler@LIGO.ORG - 13:36, Saturday 23 March 2019 (47798)

This noise is very interesting, I wonder if we can chop between state 1 and 3 in low noise. It looks very similar to the L1 "sunday noise" situation, where noise would come up in this frequency band in random locks. This noise has not appeared again since one of the ITM coil drivers was switched out.

With the higher microseism it seems L2 gets too much length drive and saturates the DAC; the addition of the angular cancellation in the "spot position" through A2L filters on top of that makes the DAC saturate easier but I don't think we can afford very different spot positions. This is why we have to be in state 1 right now. But we should rethink the DARM filter so L2 offloaded properly at low frequencies.

Furthermore, it also seems that the 4.2Hz is worse when ETMX is in state 1 versus state 3, which might be related to how accurate the analog compensation filters are in the digital path. Regardless, Craig thinks it might be coming from the spring change in the DARM plant once we added SR3 heater so maybe it's in line with Sheila's previous fix and some retuning of that filter would help.

sheila.dwyer@LIGO.ORG - 16:51, Wednesday 10 April 2019 (48402)

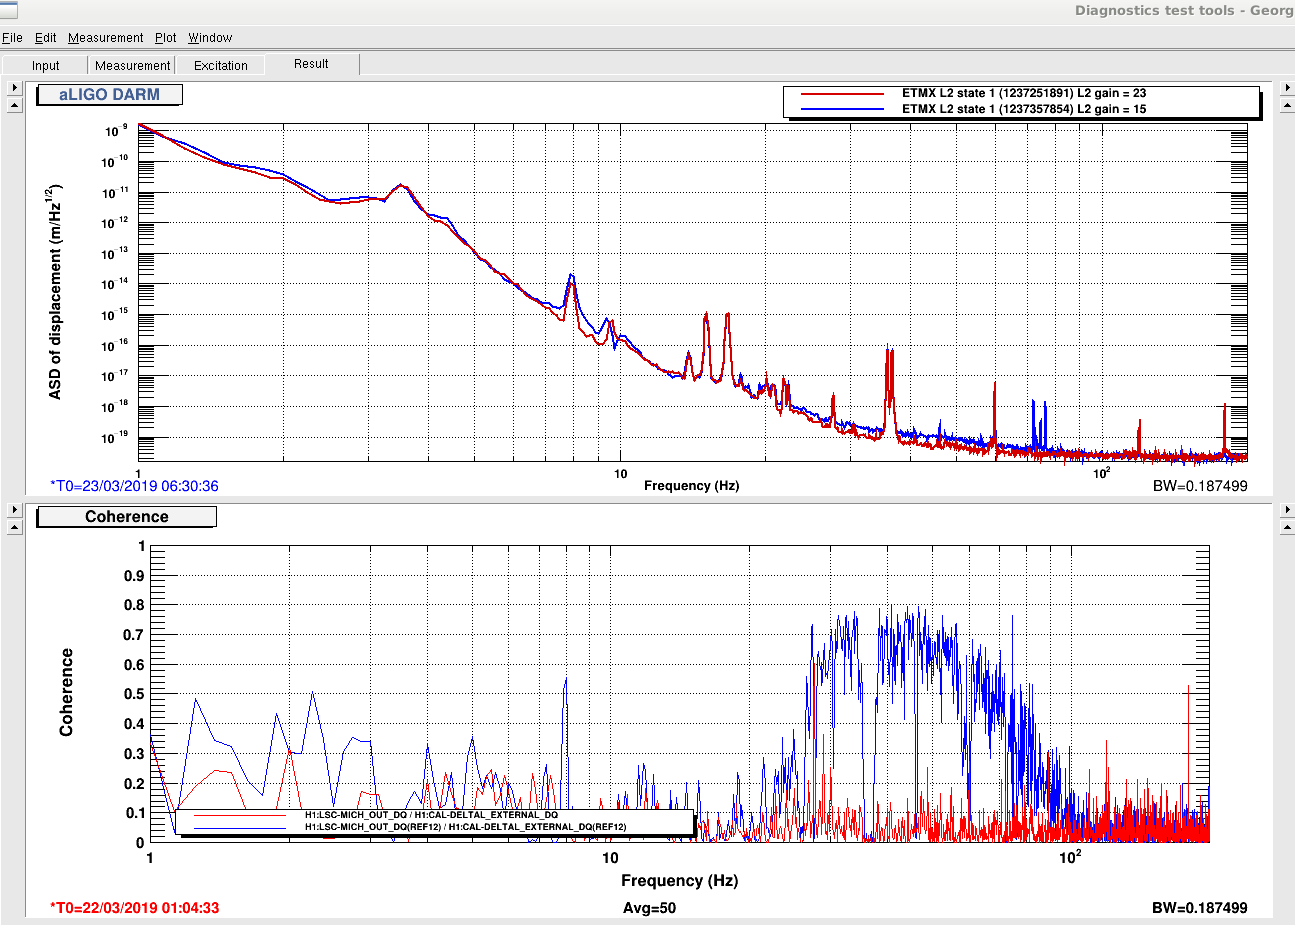
I had a closer look at the two times Georgia listed where the L2 LOCK gain was changed for the same coil driver state.  The difference in the noise is just because the MICH feedforward became mis-tuned when the L2 gain was changed.  The attachment shows that the MICH coherence was high in the frequency band where we saw excess noise when the gain was lowered. 

Images attached to this comment
Displaying reports 41781-41800 of 88750.Go to page Start 2086 2087 2088 2089 2090 2091 2092 2093 2094 End