Evan and I spent most of the day trying to investigate the sudden locklosses we've had over the last 3 days.
1) We can stay locked for ~20 minutes with ALS and DRMI if we don't turn on the REFL WFS loops. If we turn these loops on we loose lock within a minute or so. Even with these loops off we are still not stable though, and saw last night that we can't make it through the lock acquisition sequence.
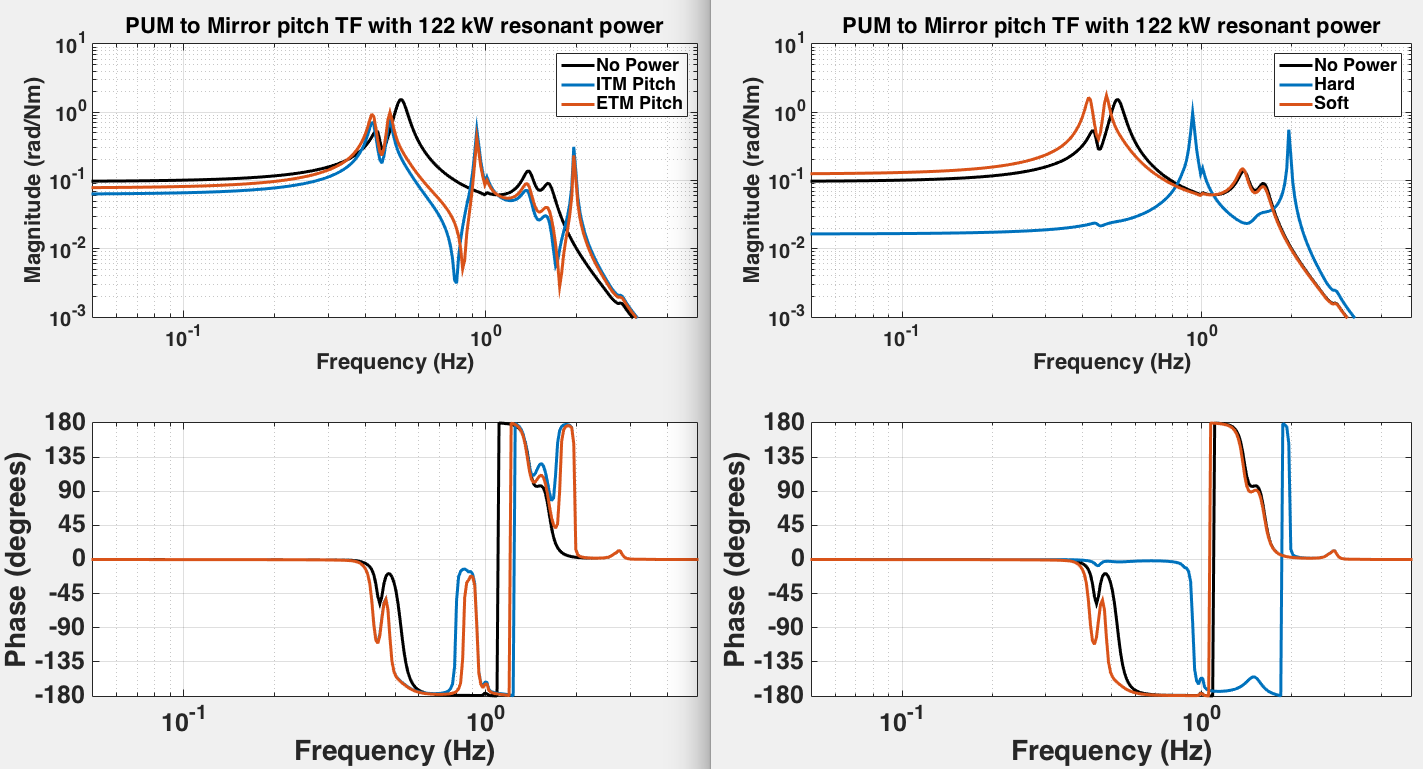
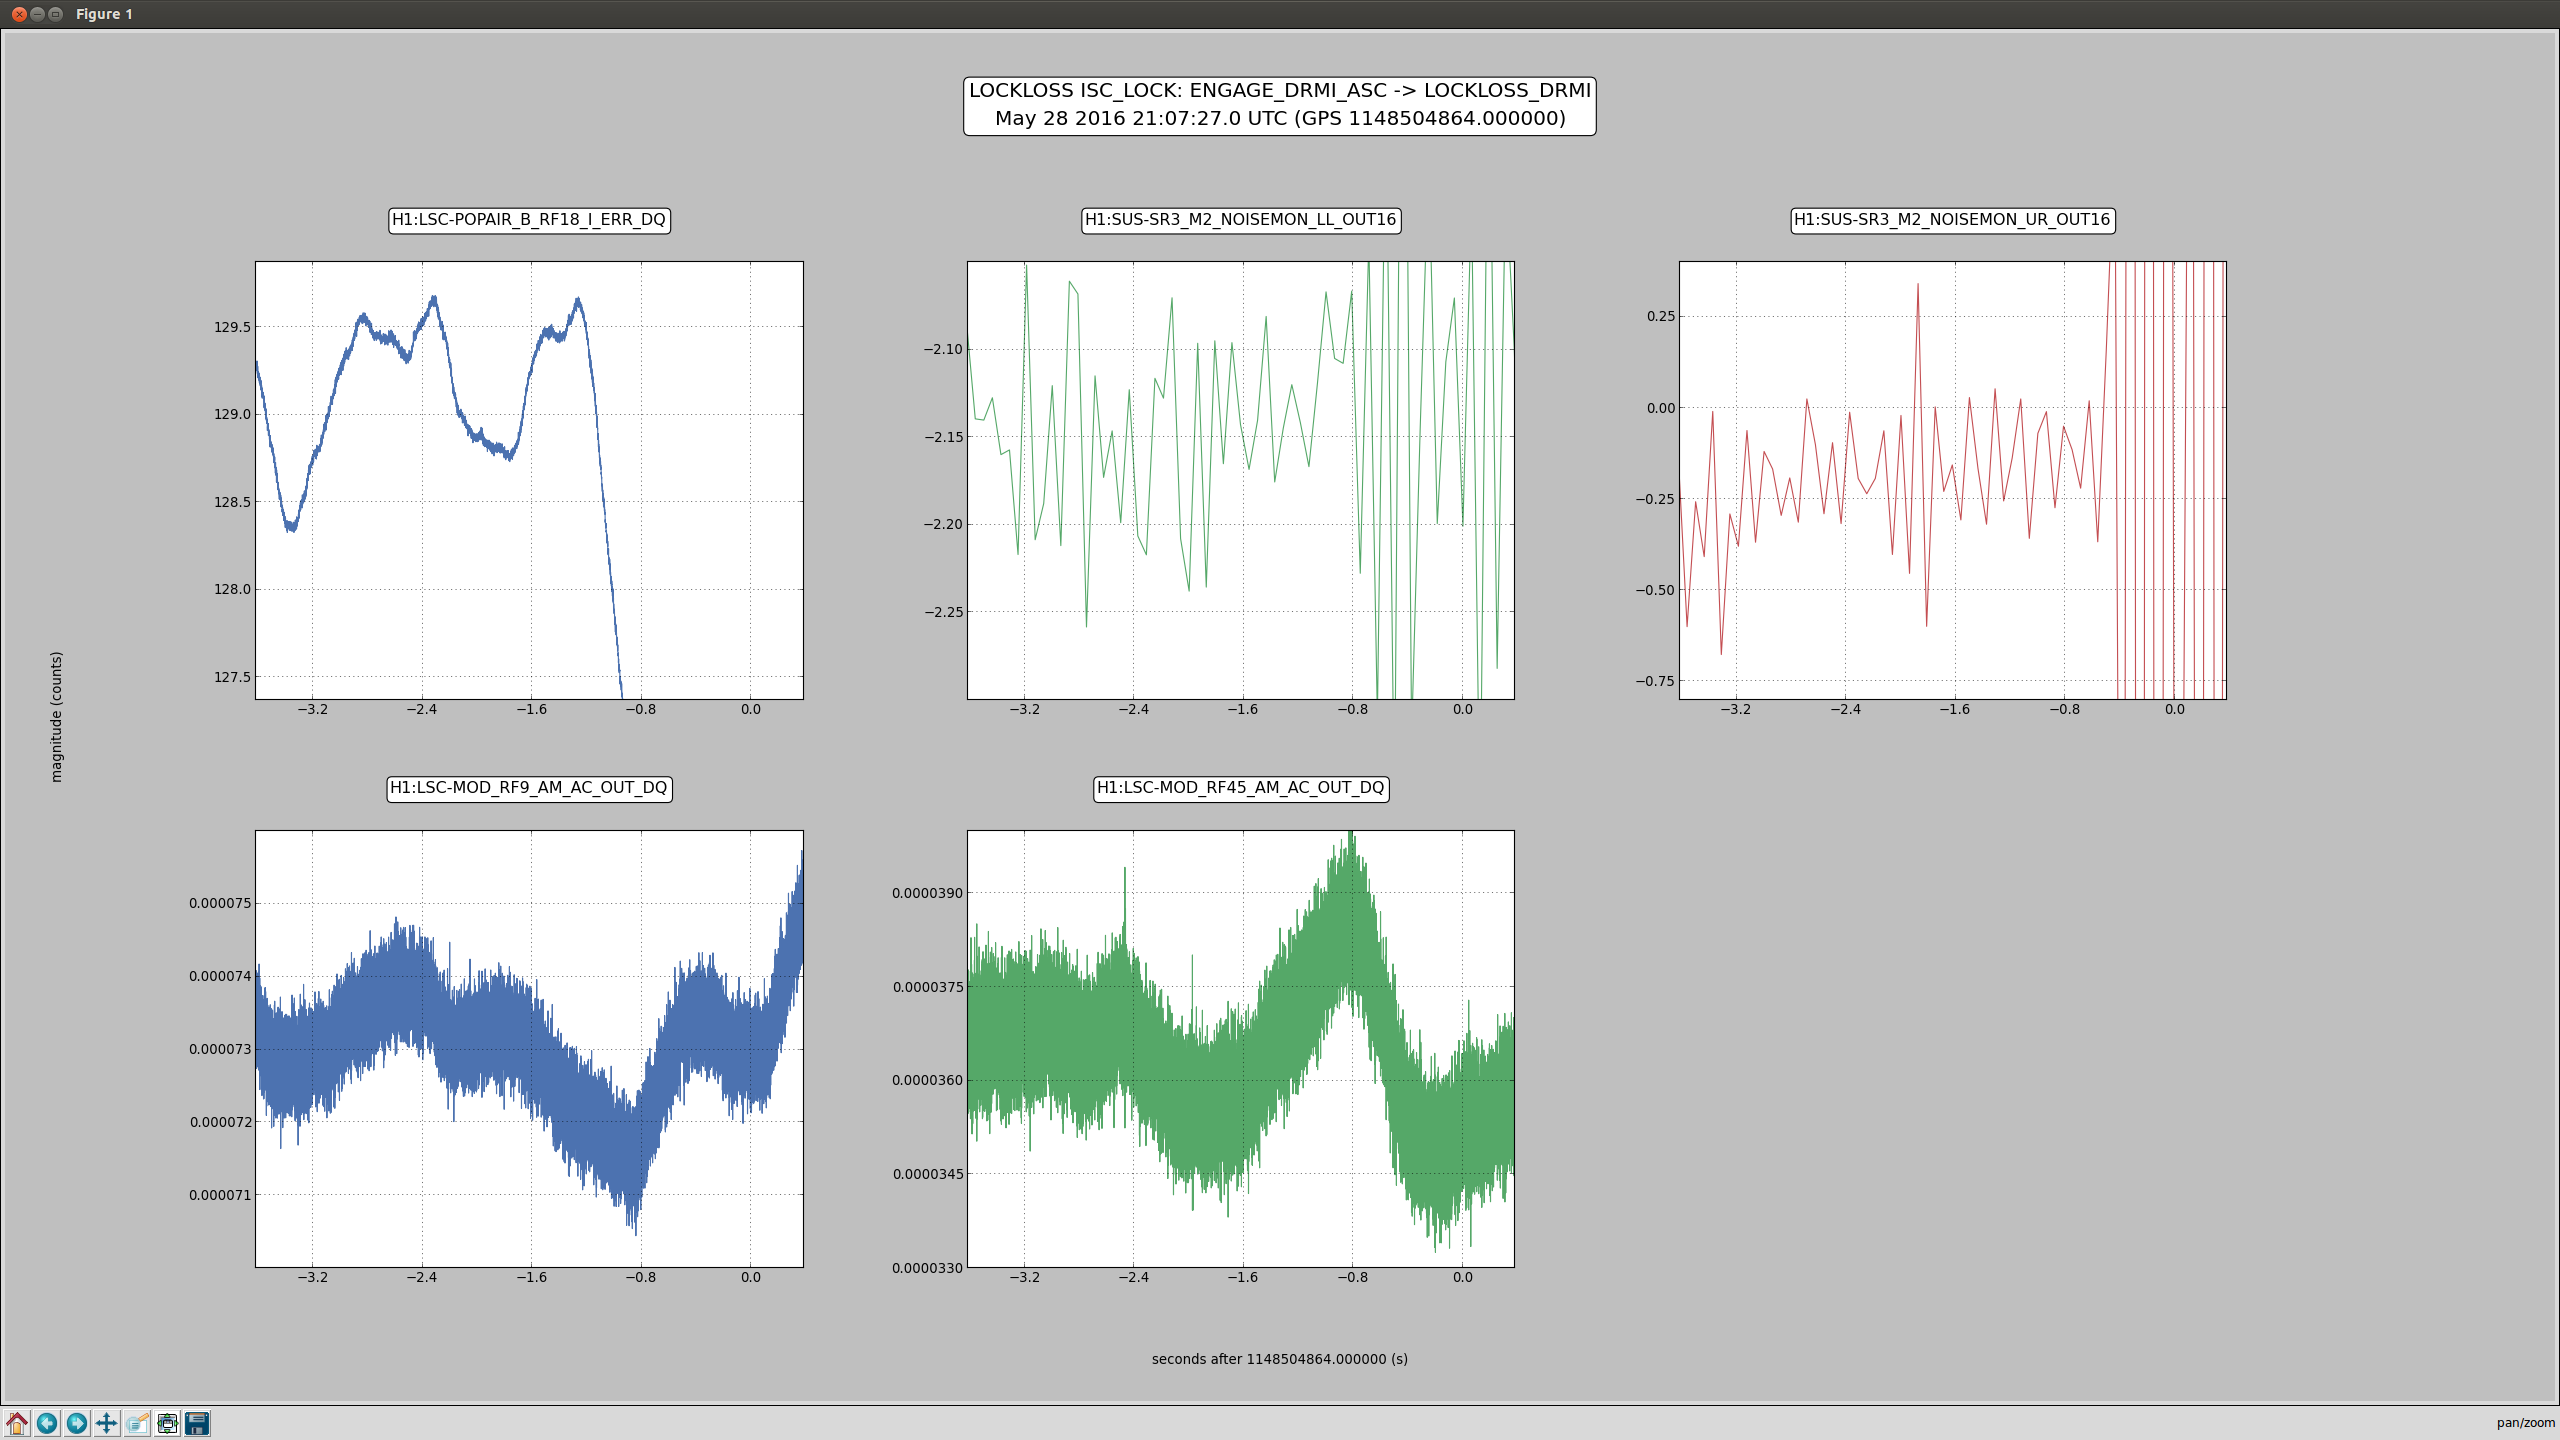
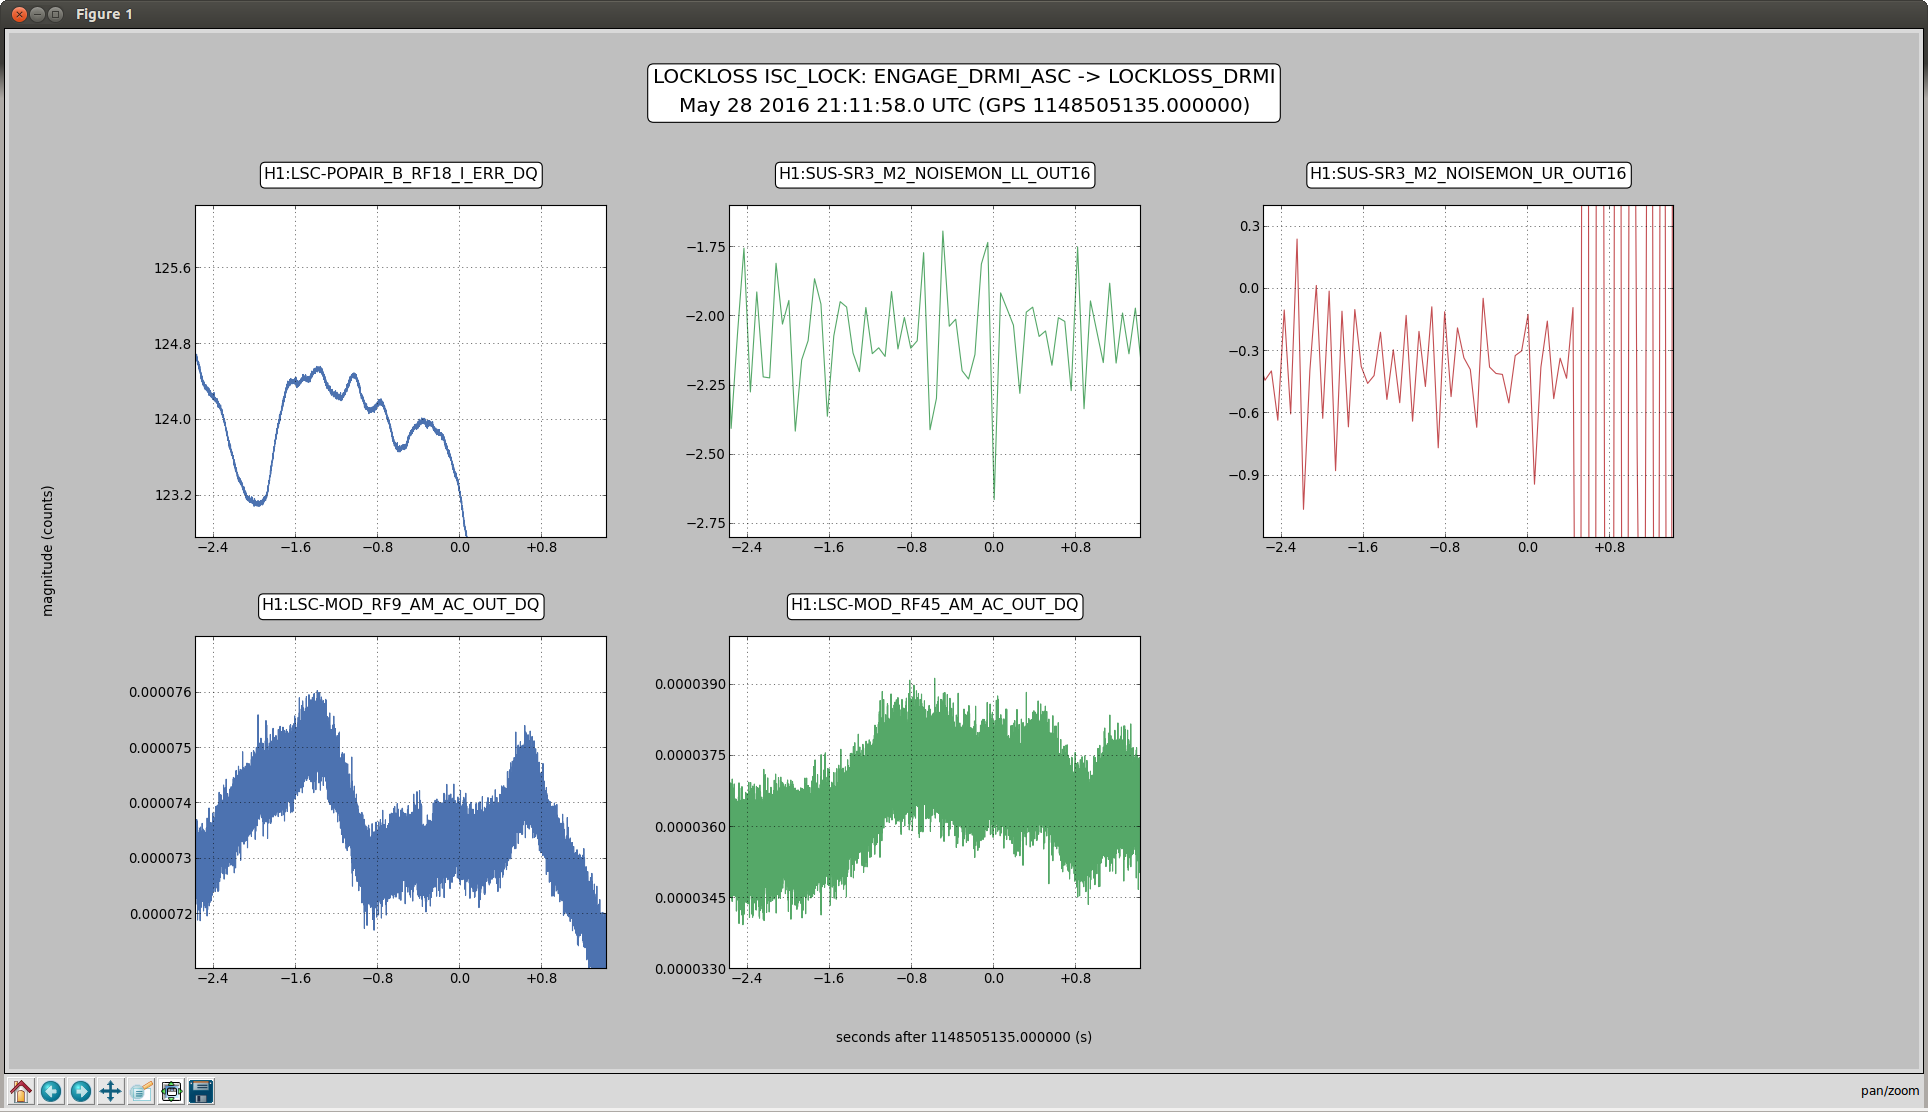
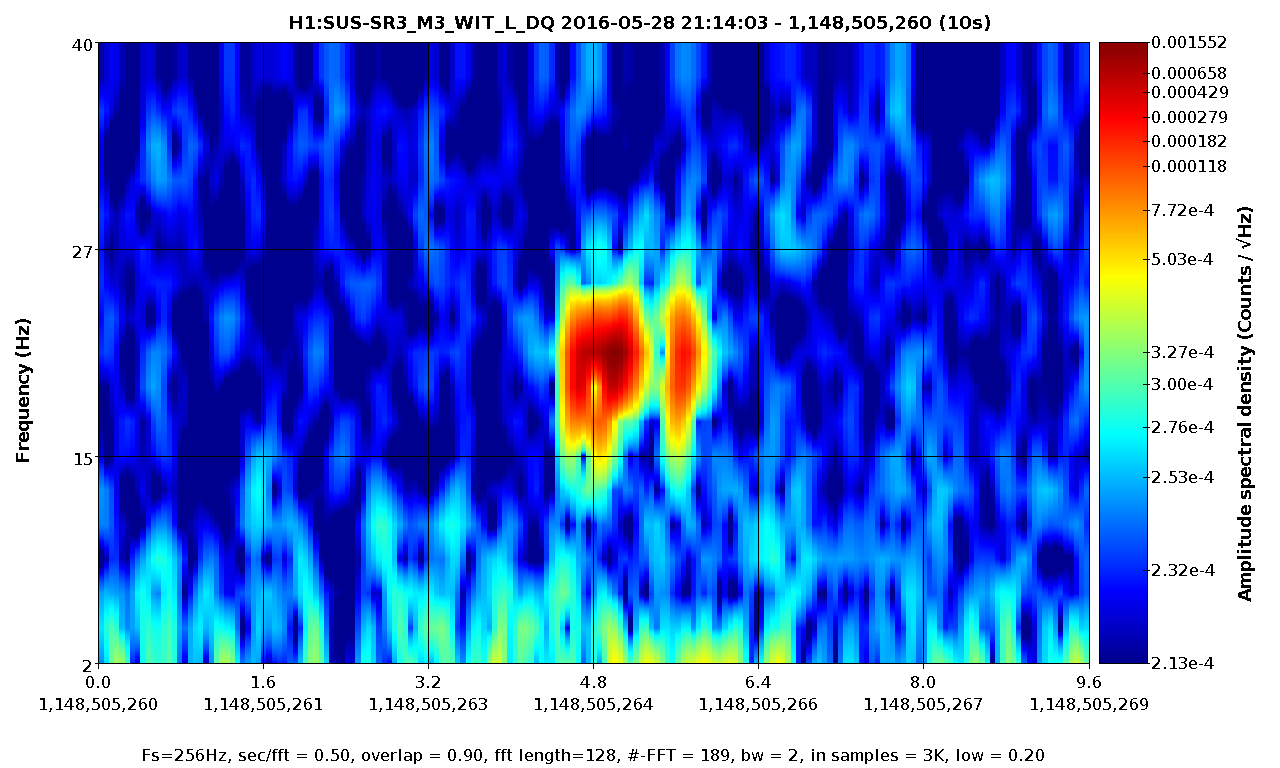
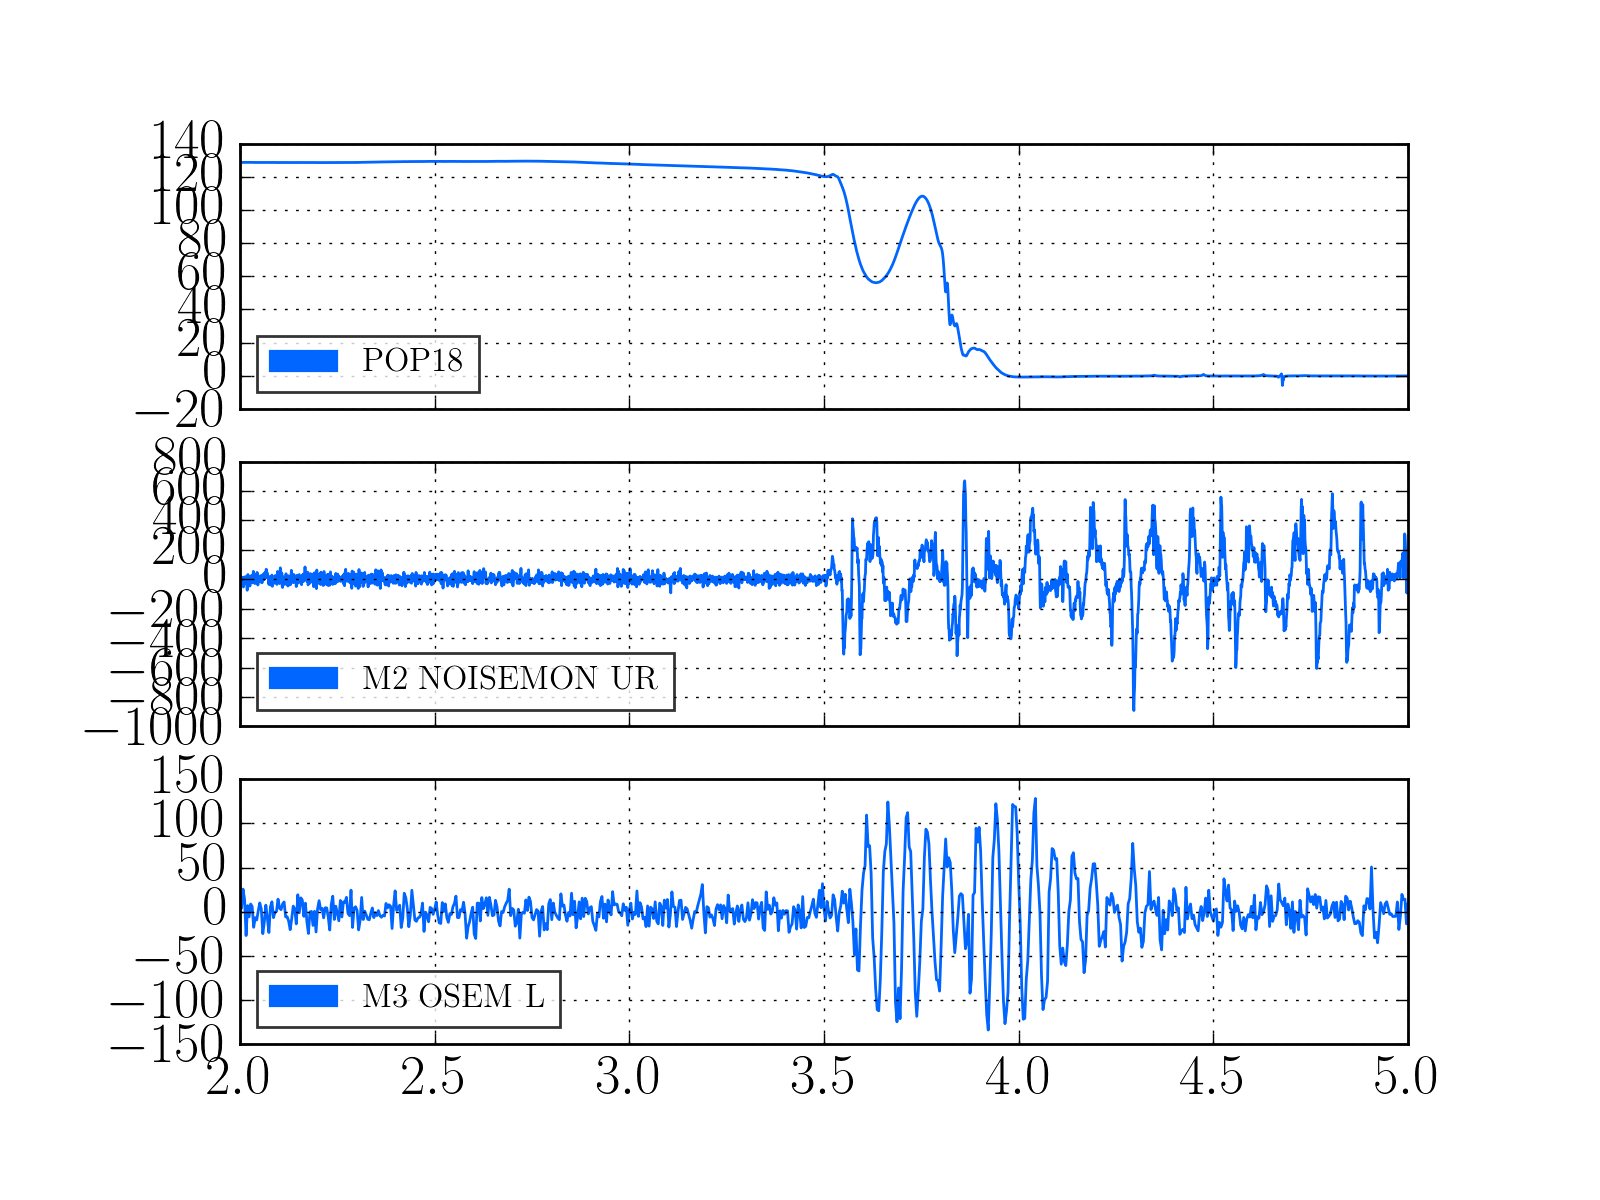
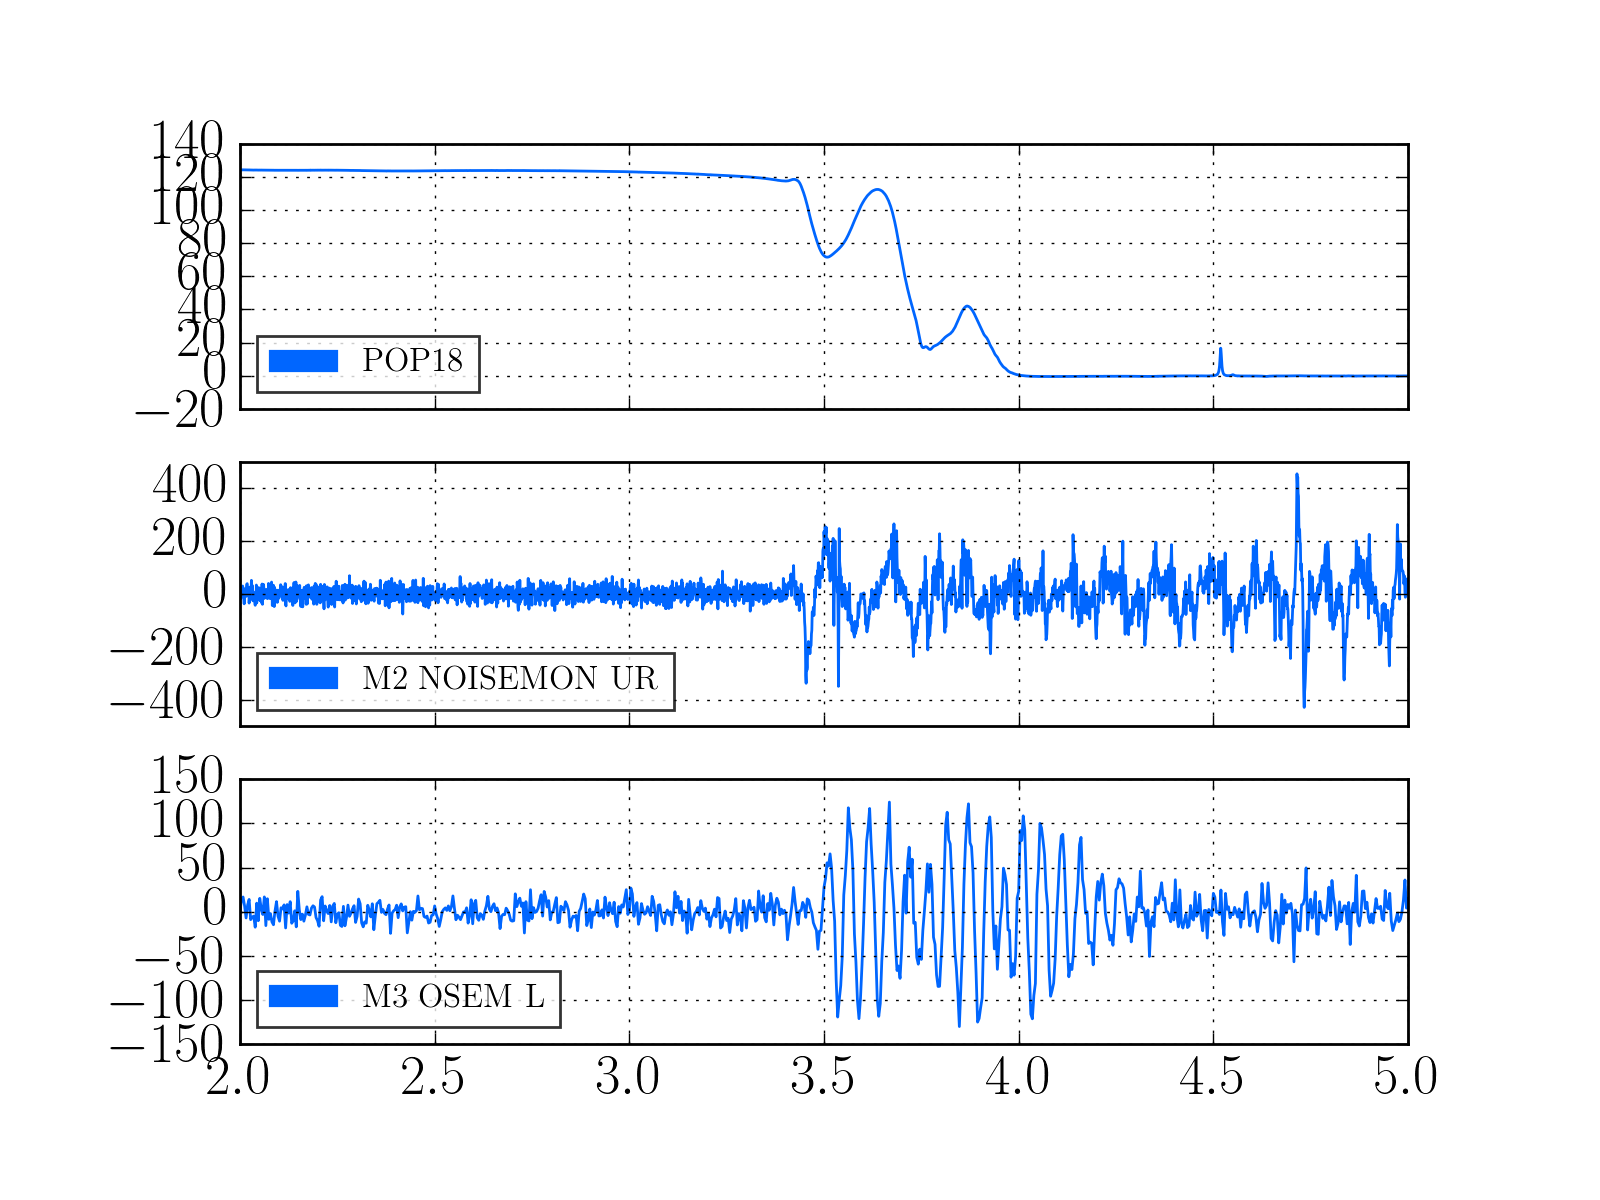
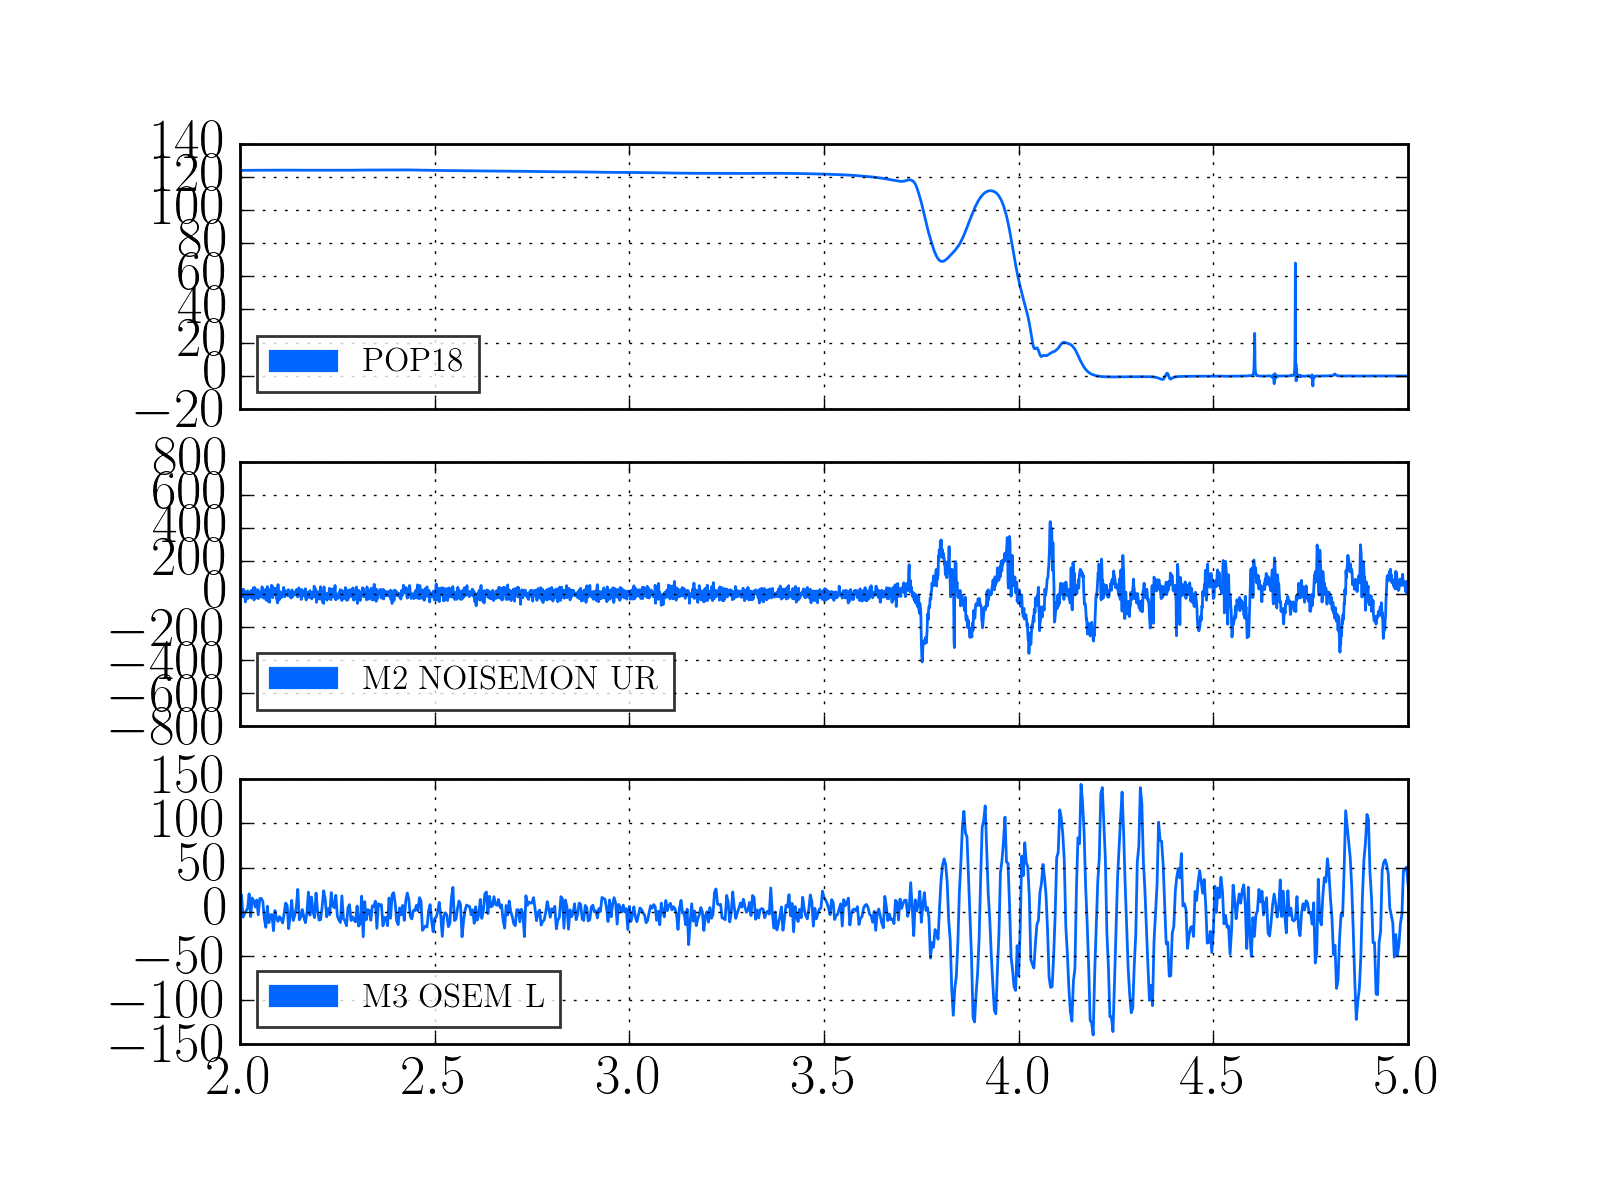
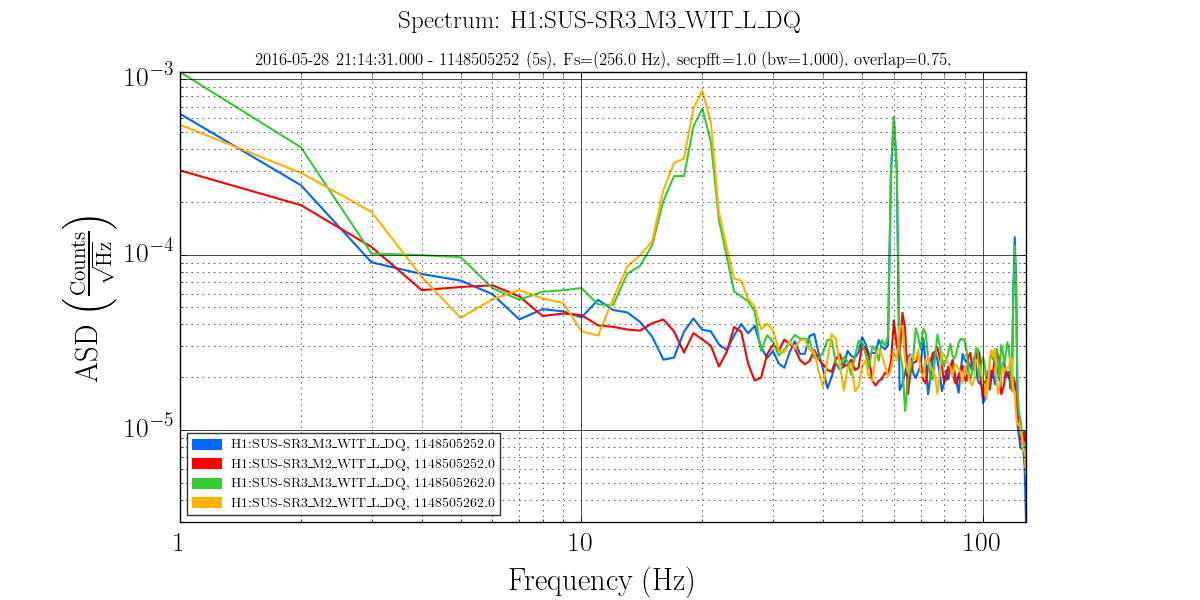
2)In almost every lockloss, you can see a glitch in SR3 M2 UR and LL noisemons just before the lockloss, which lines up well in time with glitches in POP18. Since the UR noisemon has a lot of 60 Hz noise, the glitches can only be seen there in the OUT16 channel, but the UR glitches are much larger. (We do not actuate on this stage at all). However, there are two reasons to be skeptical that this is the real problem:
-
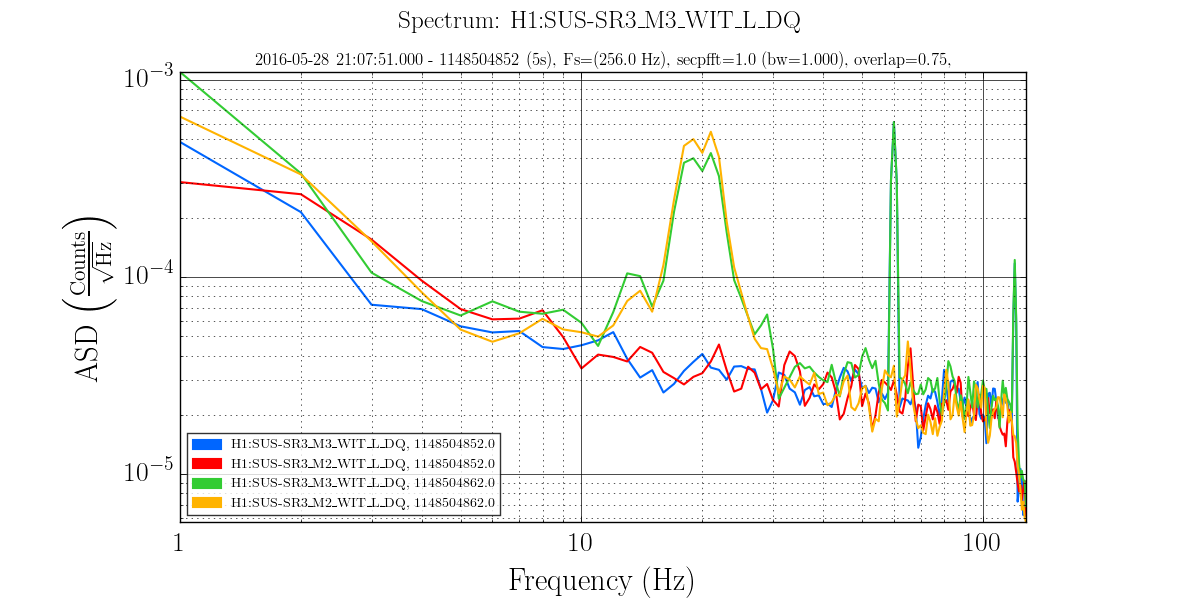
There is nothing in the witness sensor or OpLev to indicate that the optic is really moving. These just might not be sensitive enough, but last time we had sus electronics problems with SR3 there was a clear disturbance on the OpLev and witness sensor (21095 and 21081)
-
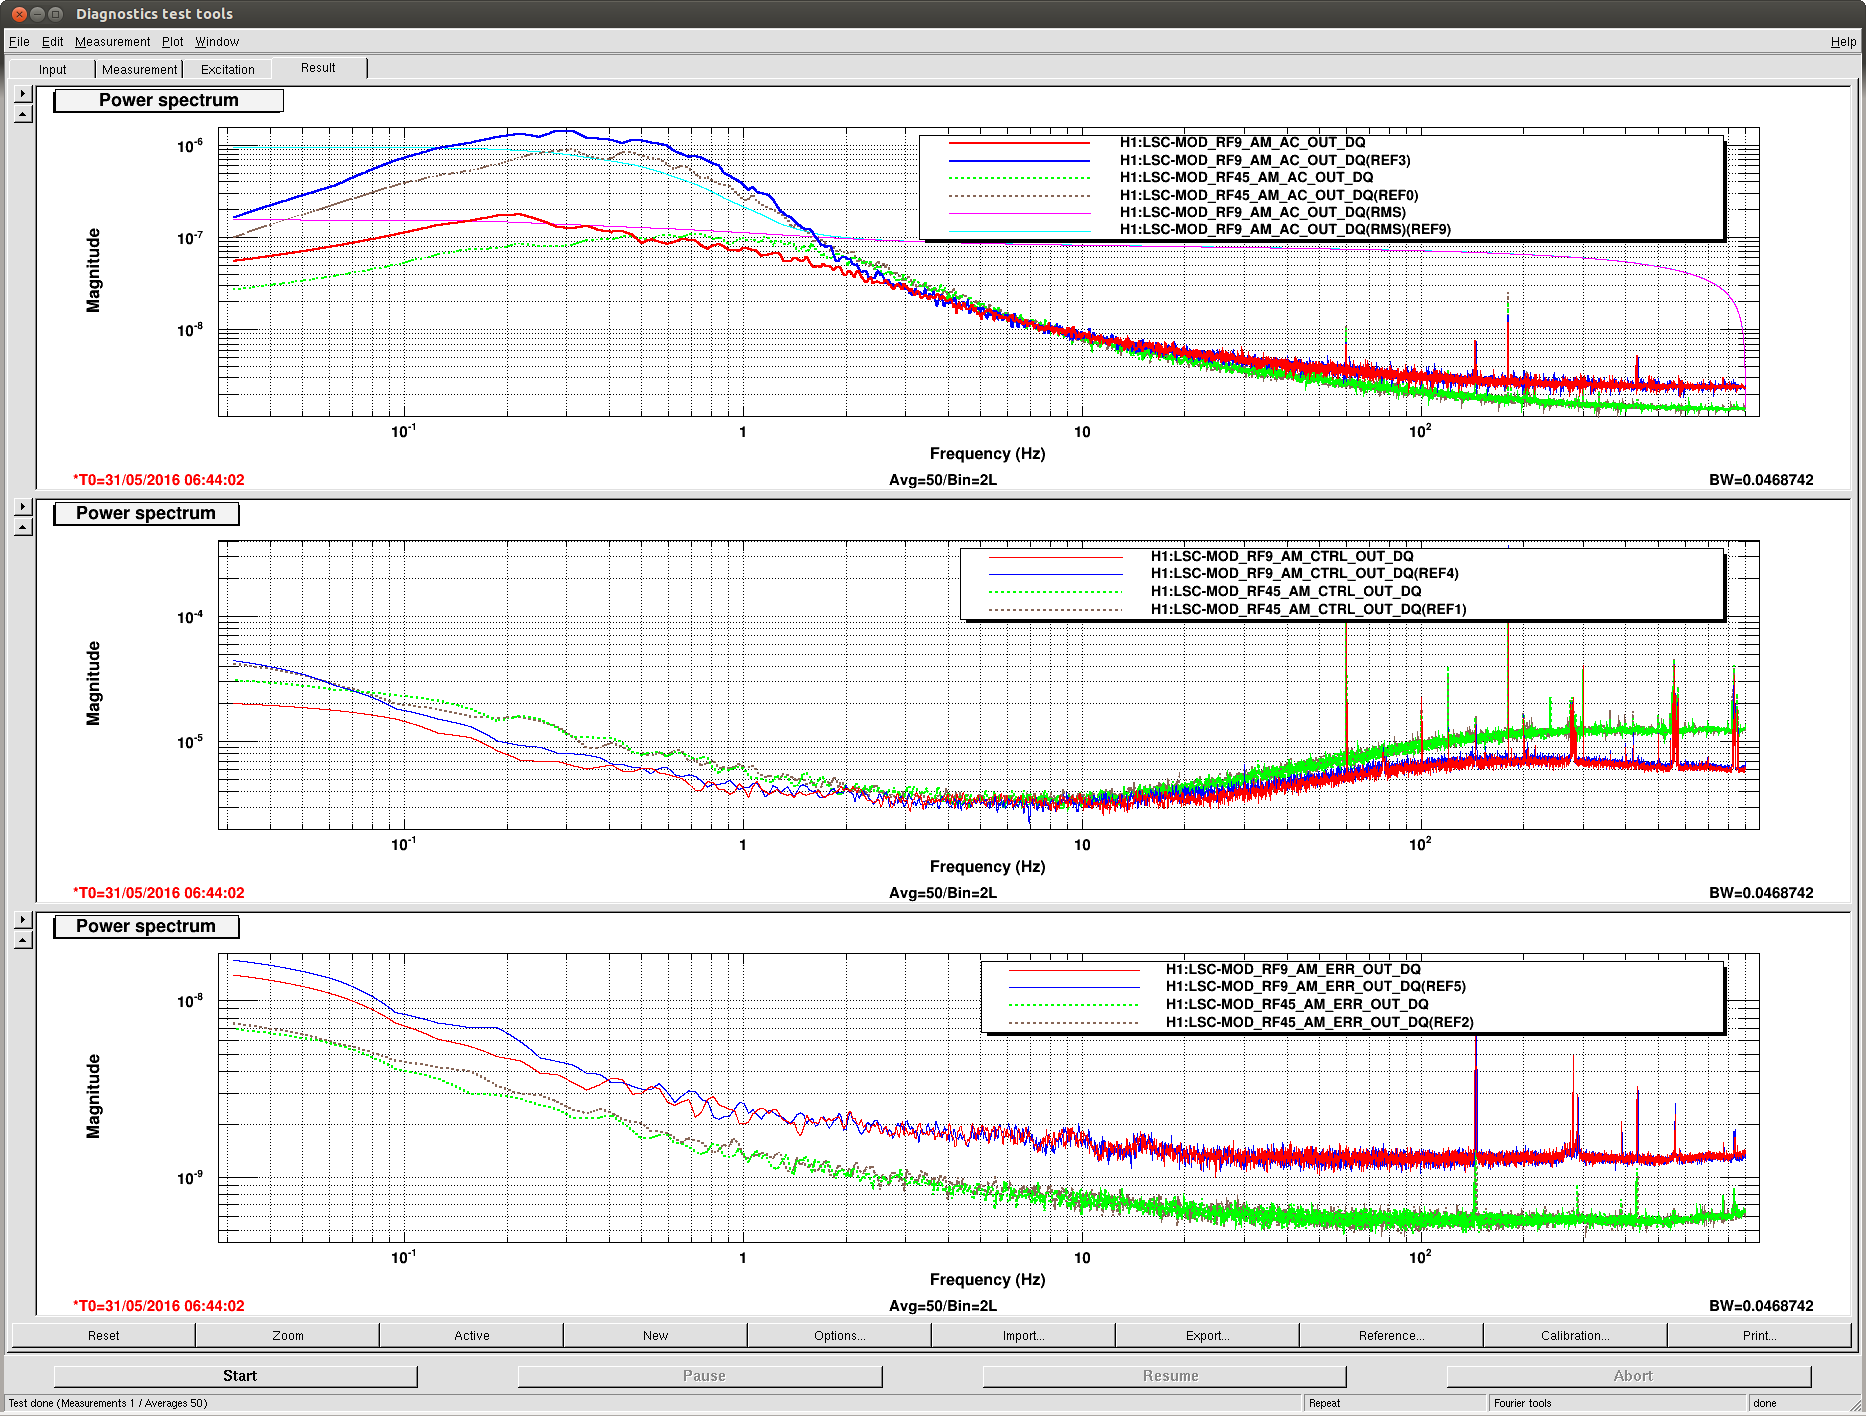
These large glitches have been happening since May10th or so, and we have only started having locking problems in the last 3 days. The RF problem of the last few days seems to corespond better to our locking difficulties, although there aren't signs of problems in the RF readbacks at the exact lockloss times.
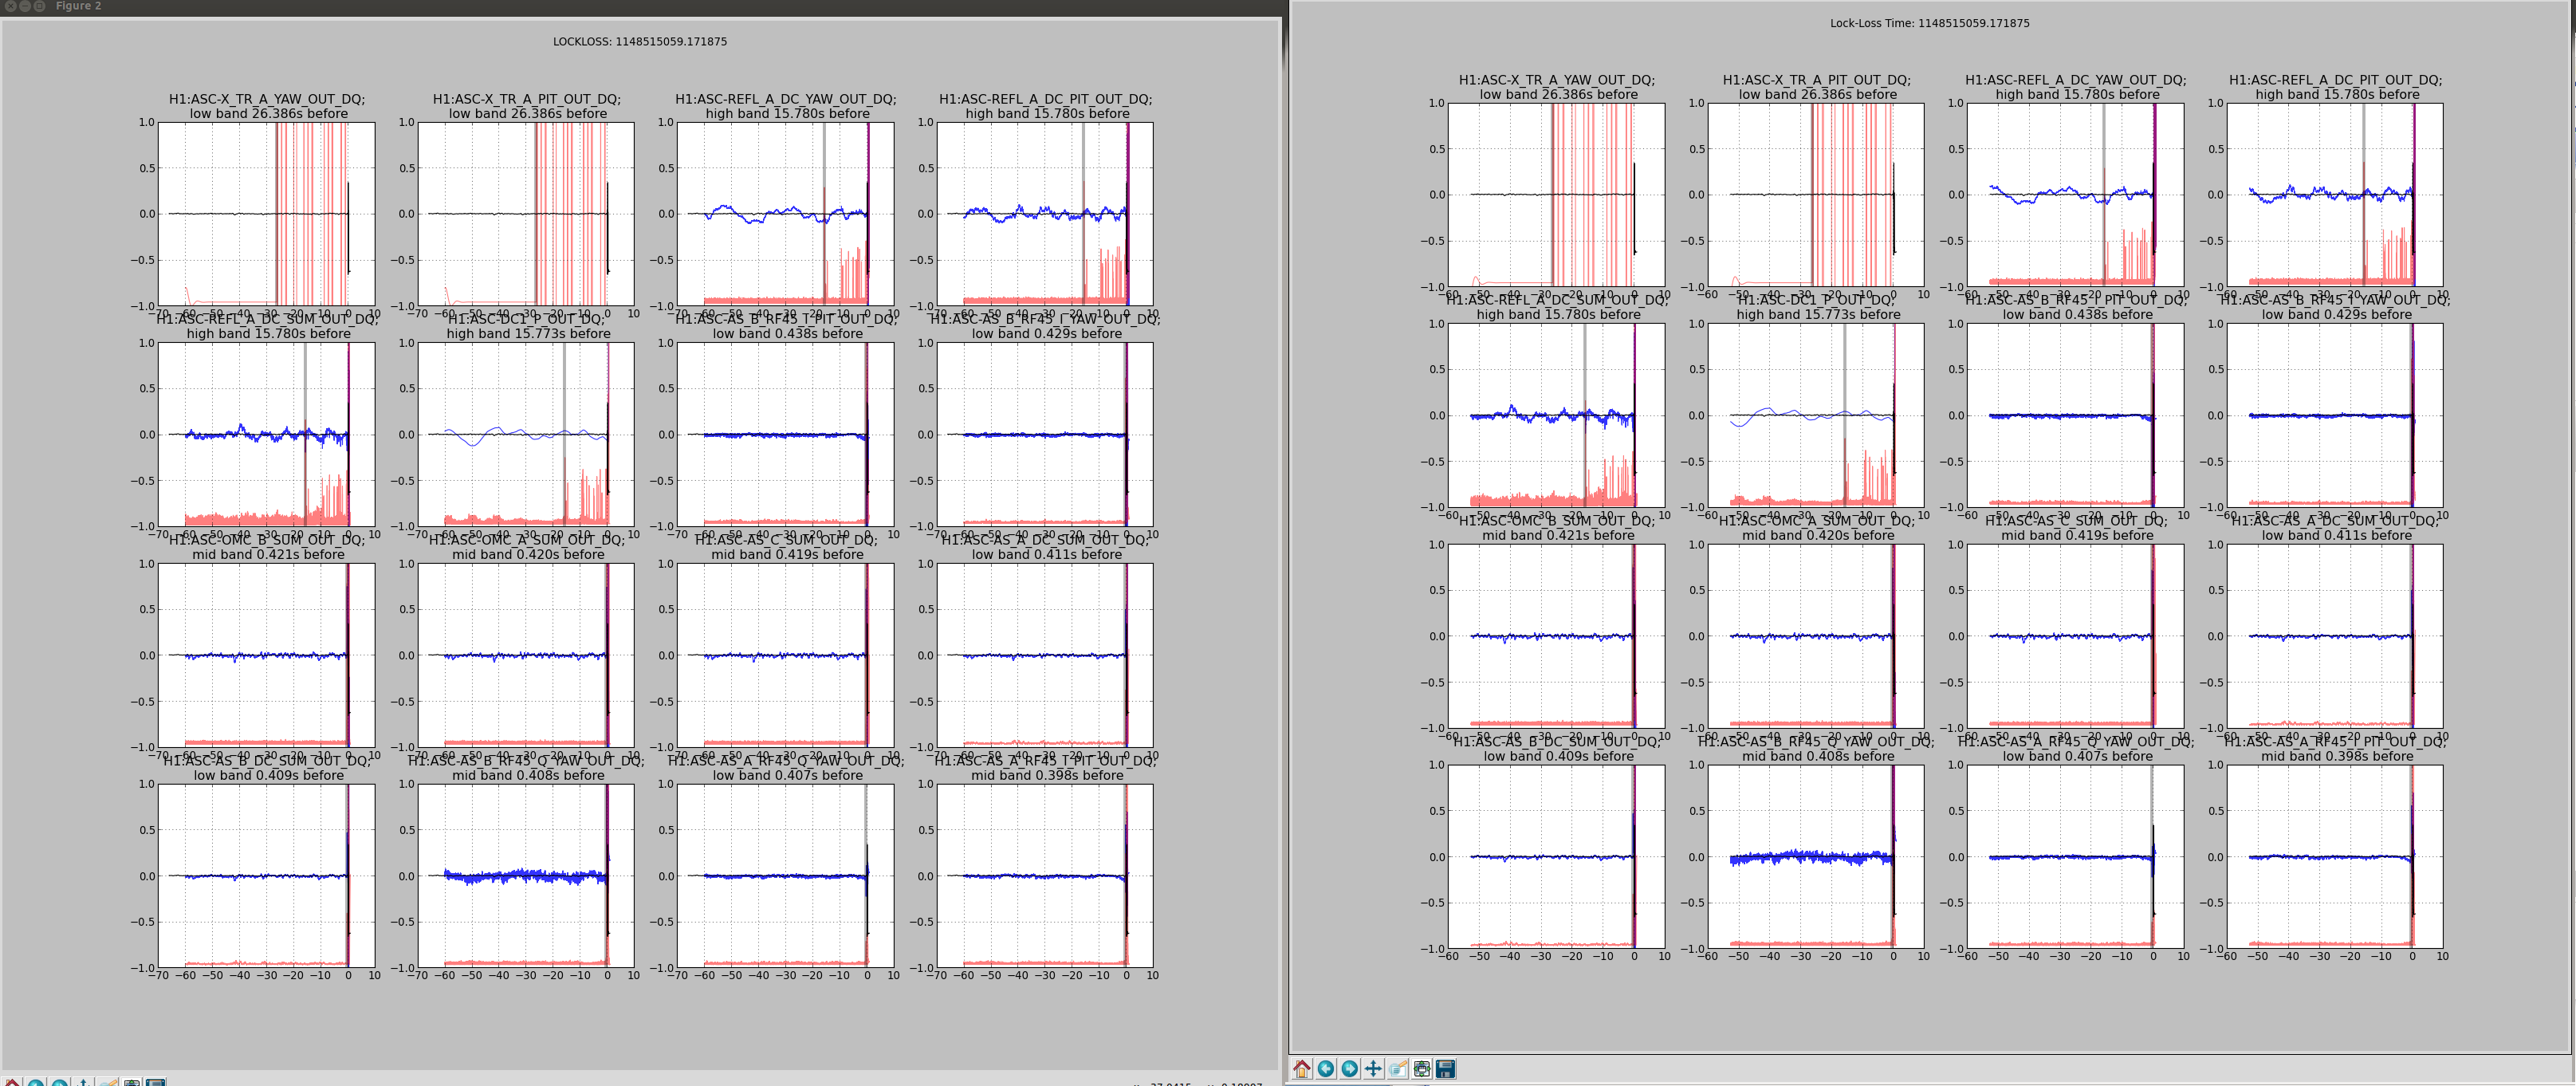
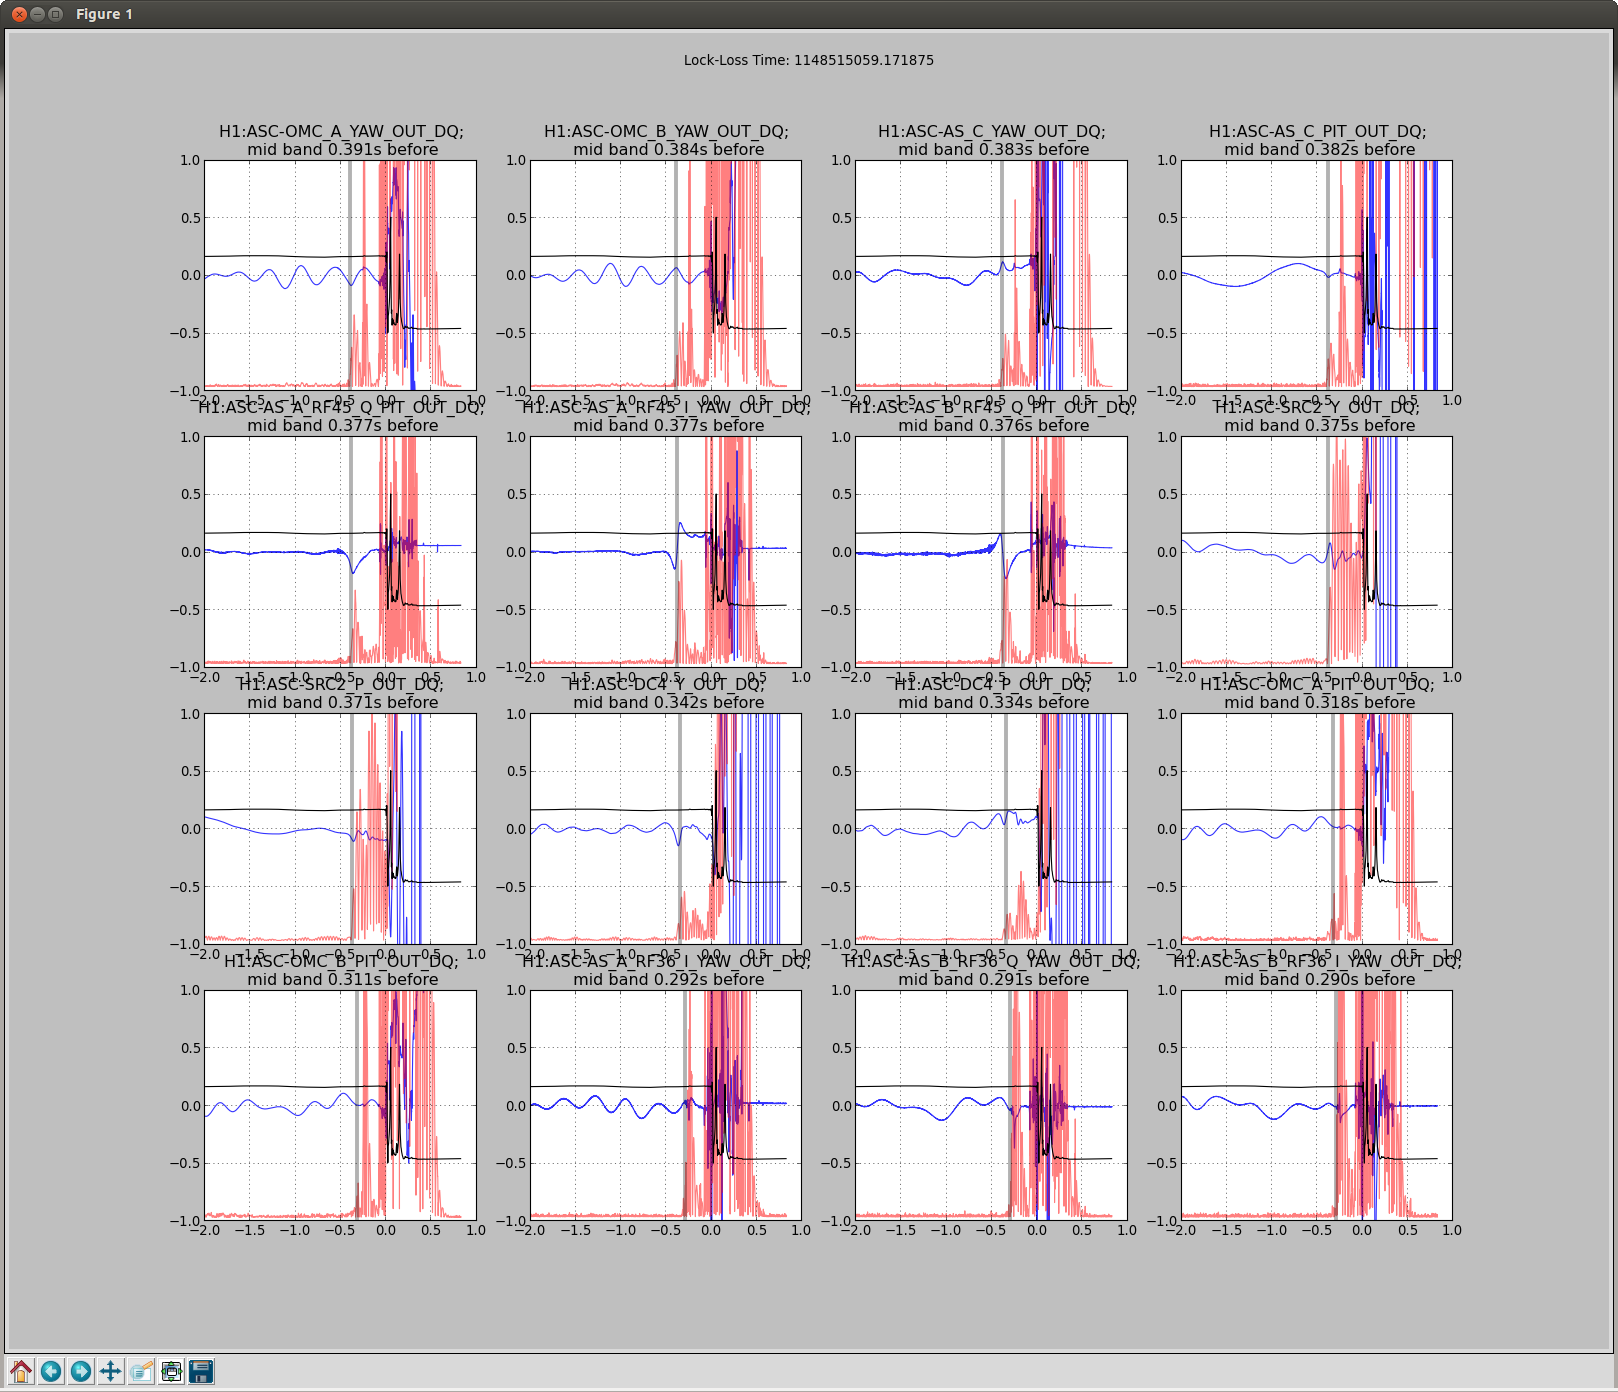
It could be that the RF problem that started in the last few days somehow makes us more senstive to loosing lock because of tiny SR3 glitches, or that the noisemons are just showing some spurious signal which is related to the lockloss/ RF problems. Some lockloss plots are attached.
It seems like the thing to do would be trying to fix the RF problem, but we don't have many ideas for what to do.