TITLE: 02/19 Day Shift: 16:00-00:00 UTC (08:00-16:00 PST), all times posted in UTC
STATE of H1: Commissioning
INCOMING OPERATOR: None
SHIFT SUMMARY:
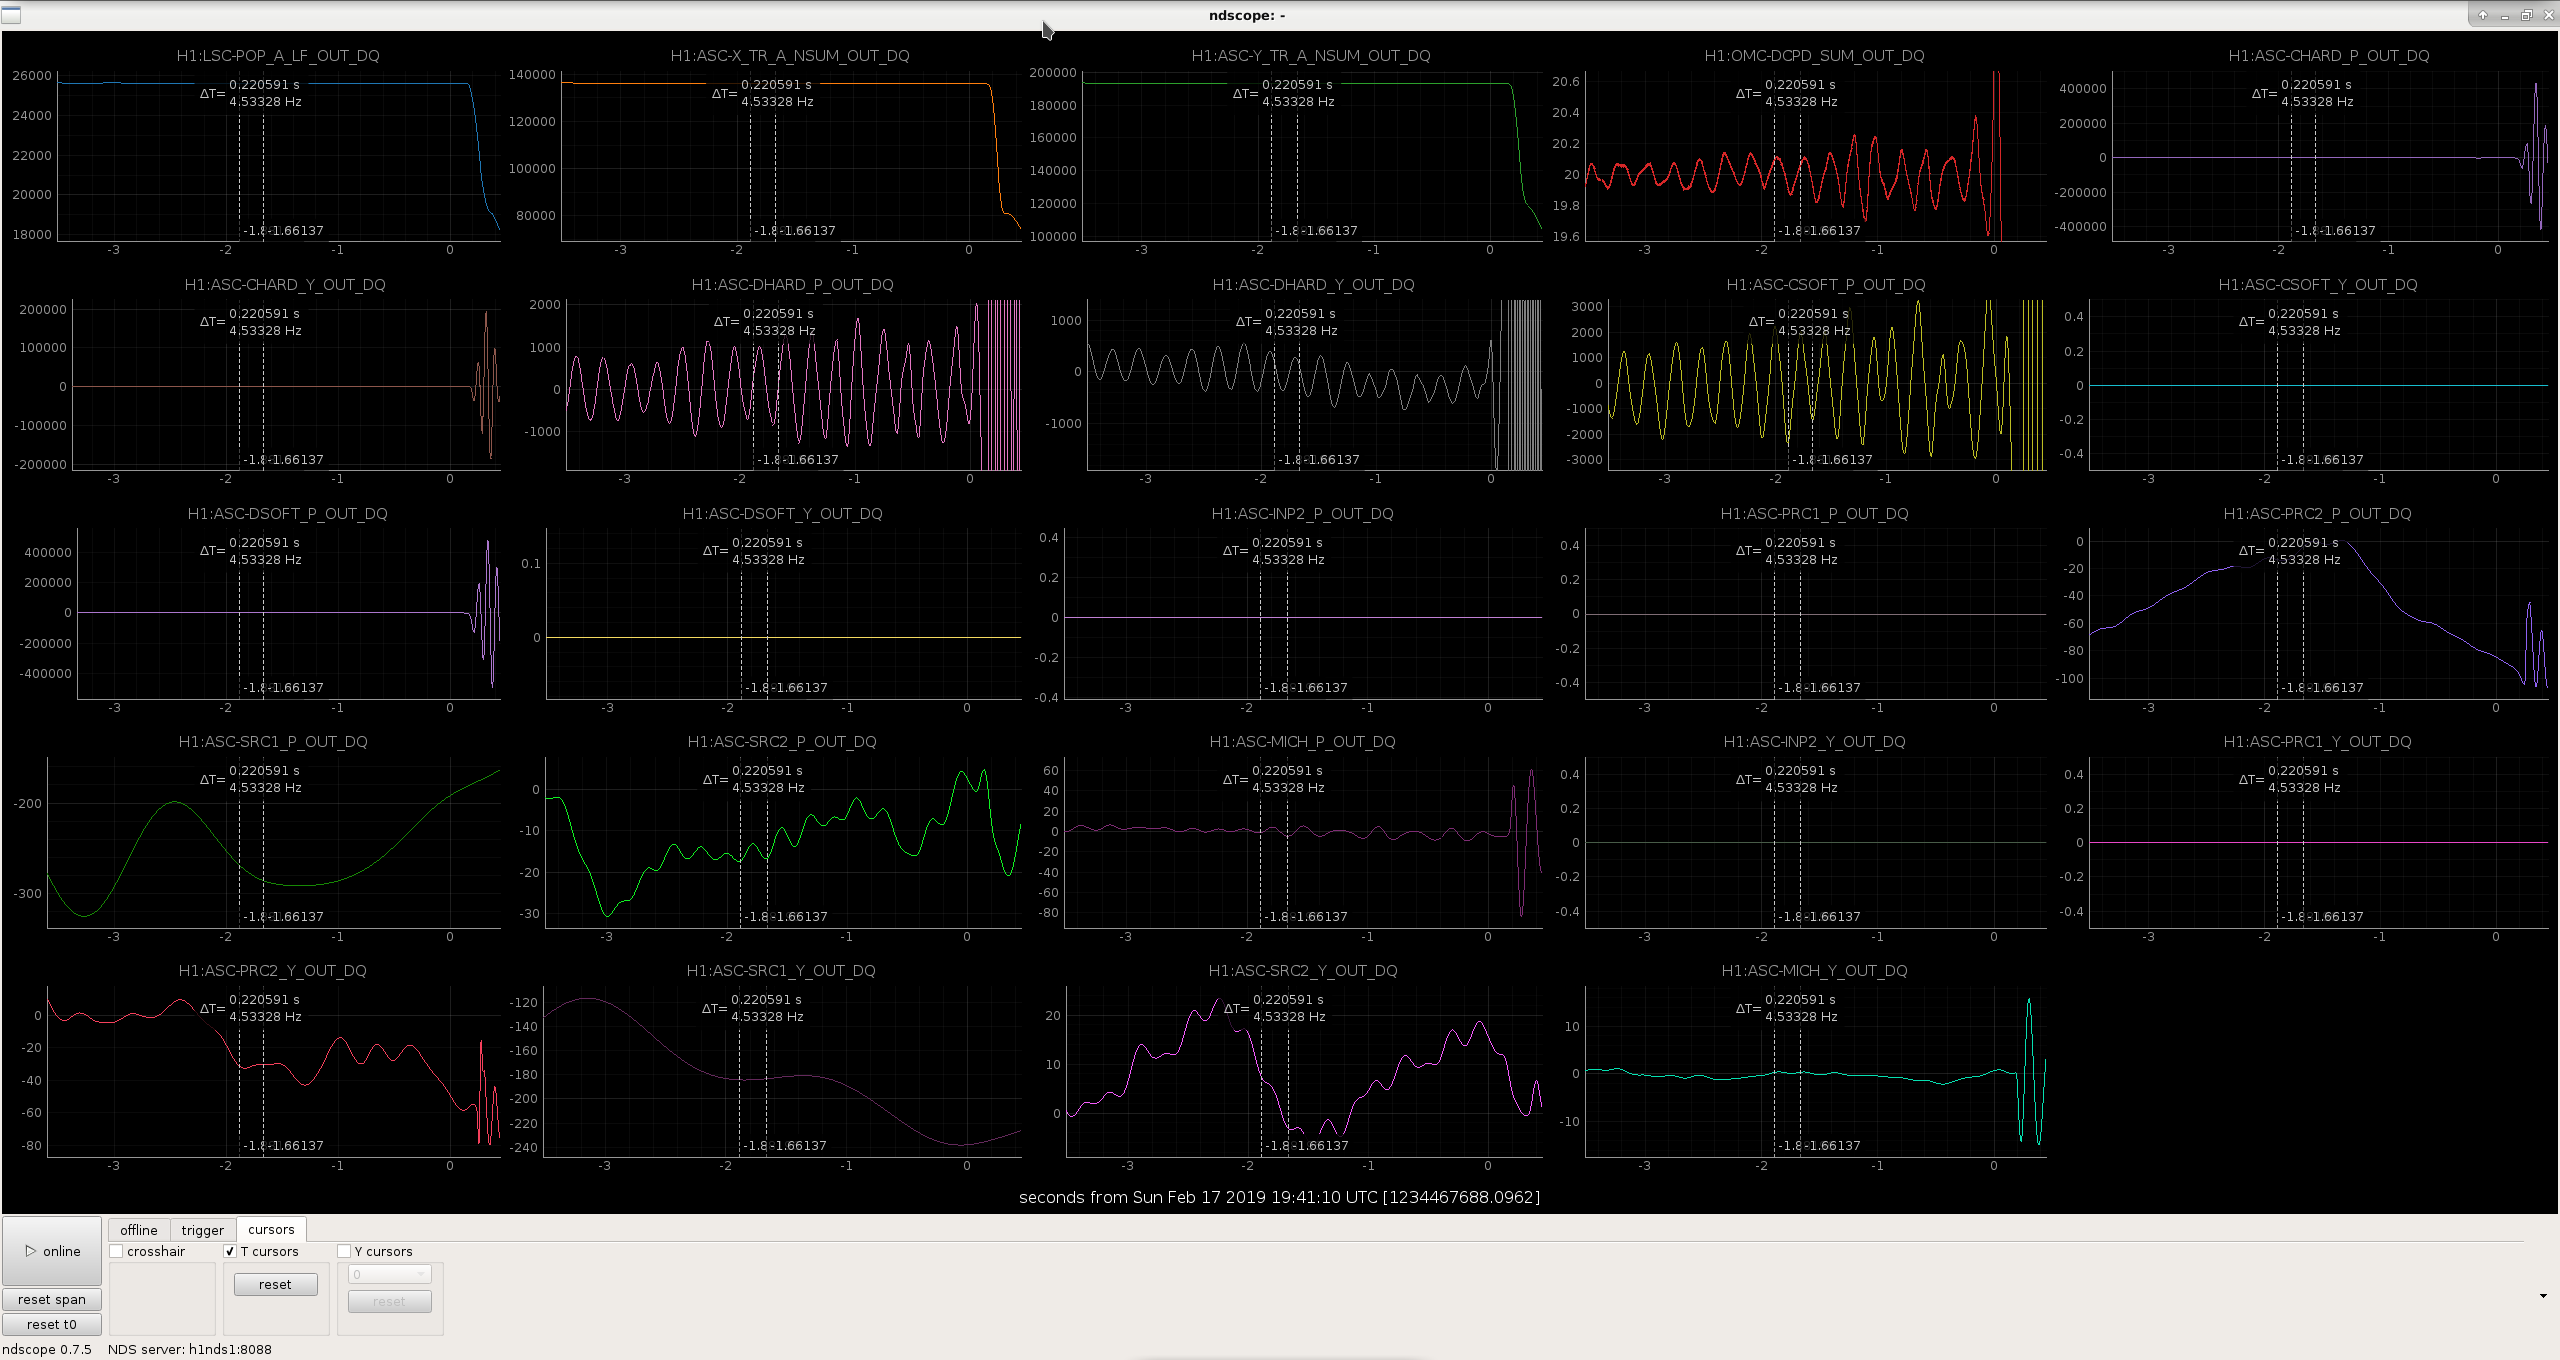
Shorter Maintenance Day to allow for more Commissioning time. After Maintenance, performed an Initial Alignment + looked over Jenne/Nutsinee's shoulders as a Squeezer alignment was also performed. Made it to NLN, with the help of Kara M., but it dropped out shortly after--Sheila noted a ~4Hz oscillation on an ETM---believe she mentioned this being related to dither align. Regardless, she had me hover at LOWNOISE_ESD_ETMX on the order of 15min to let our locking signals stabilize before moving to NLN.
LOG:
TJ, Danny
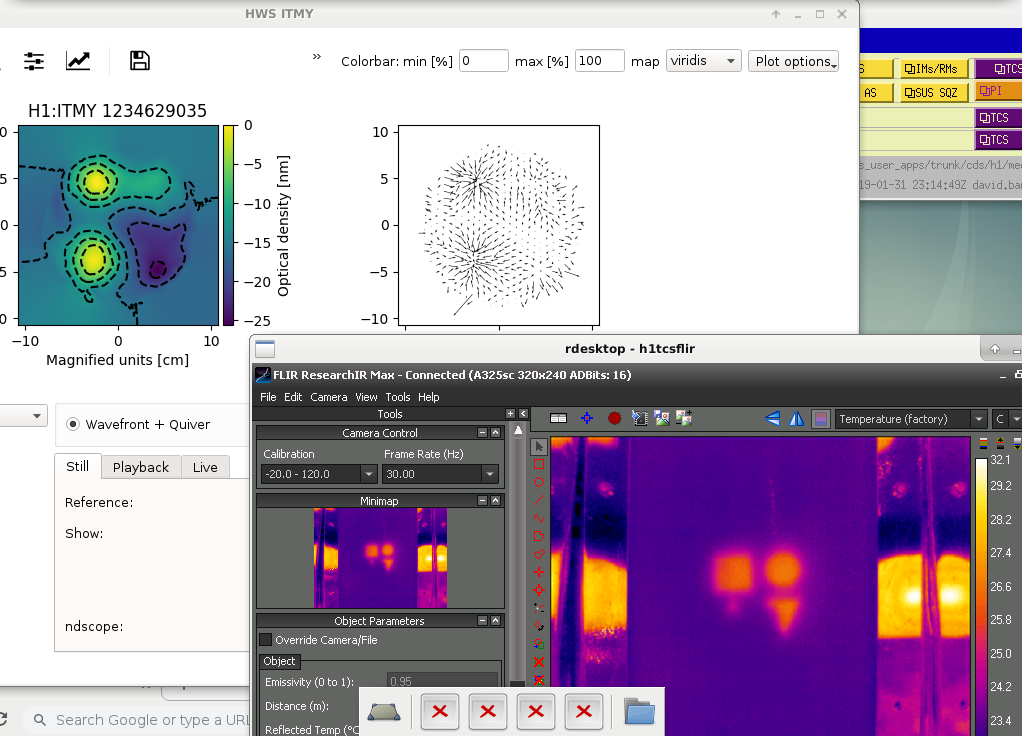
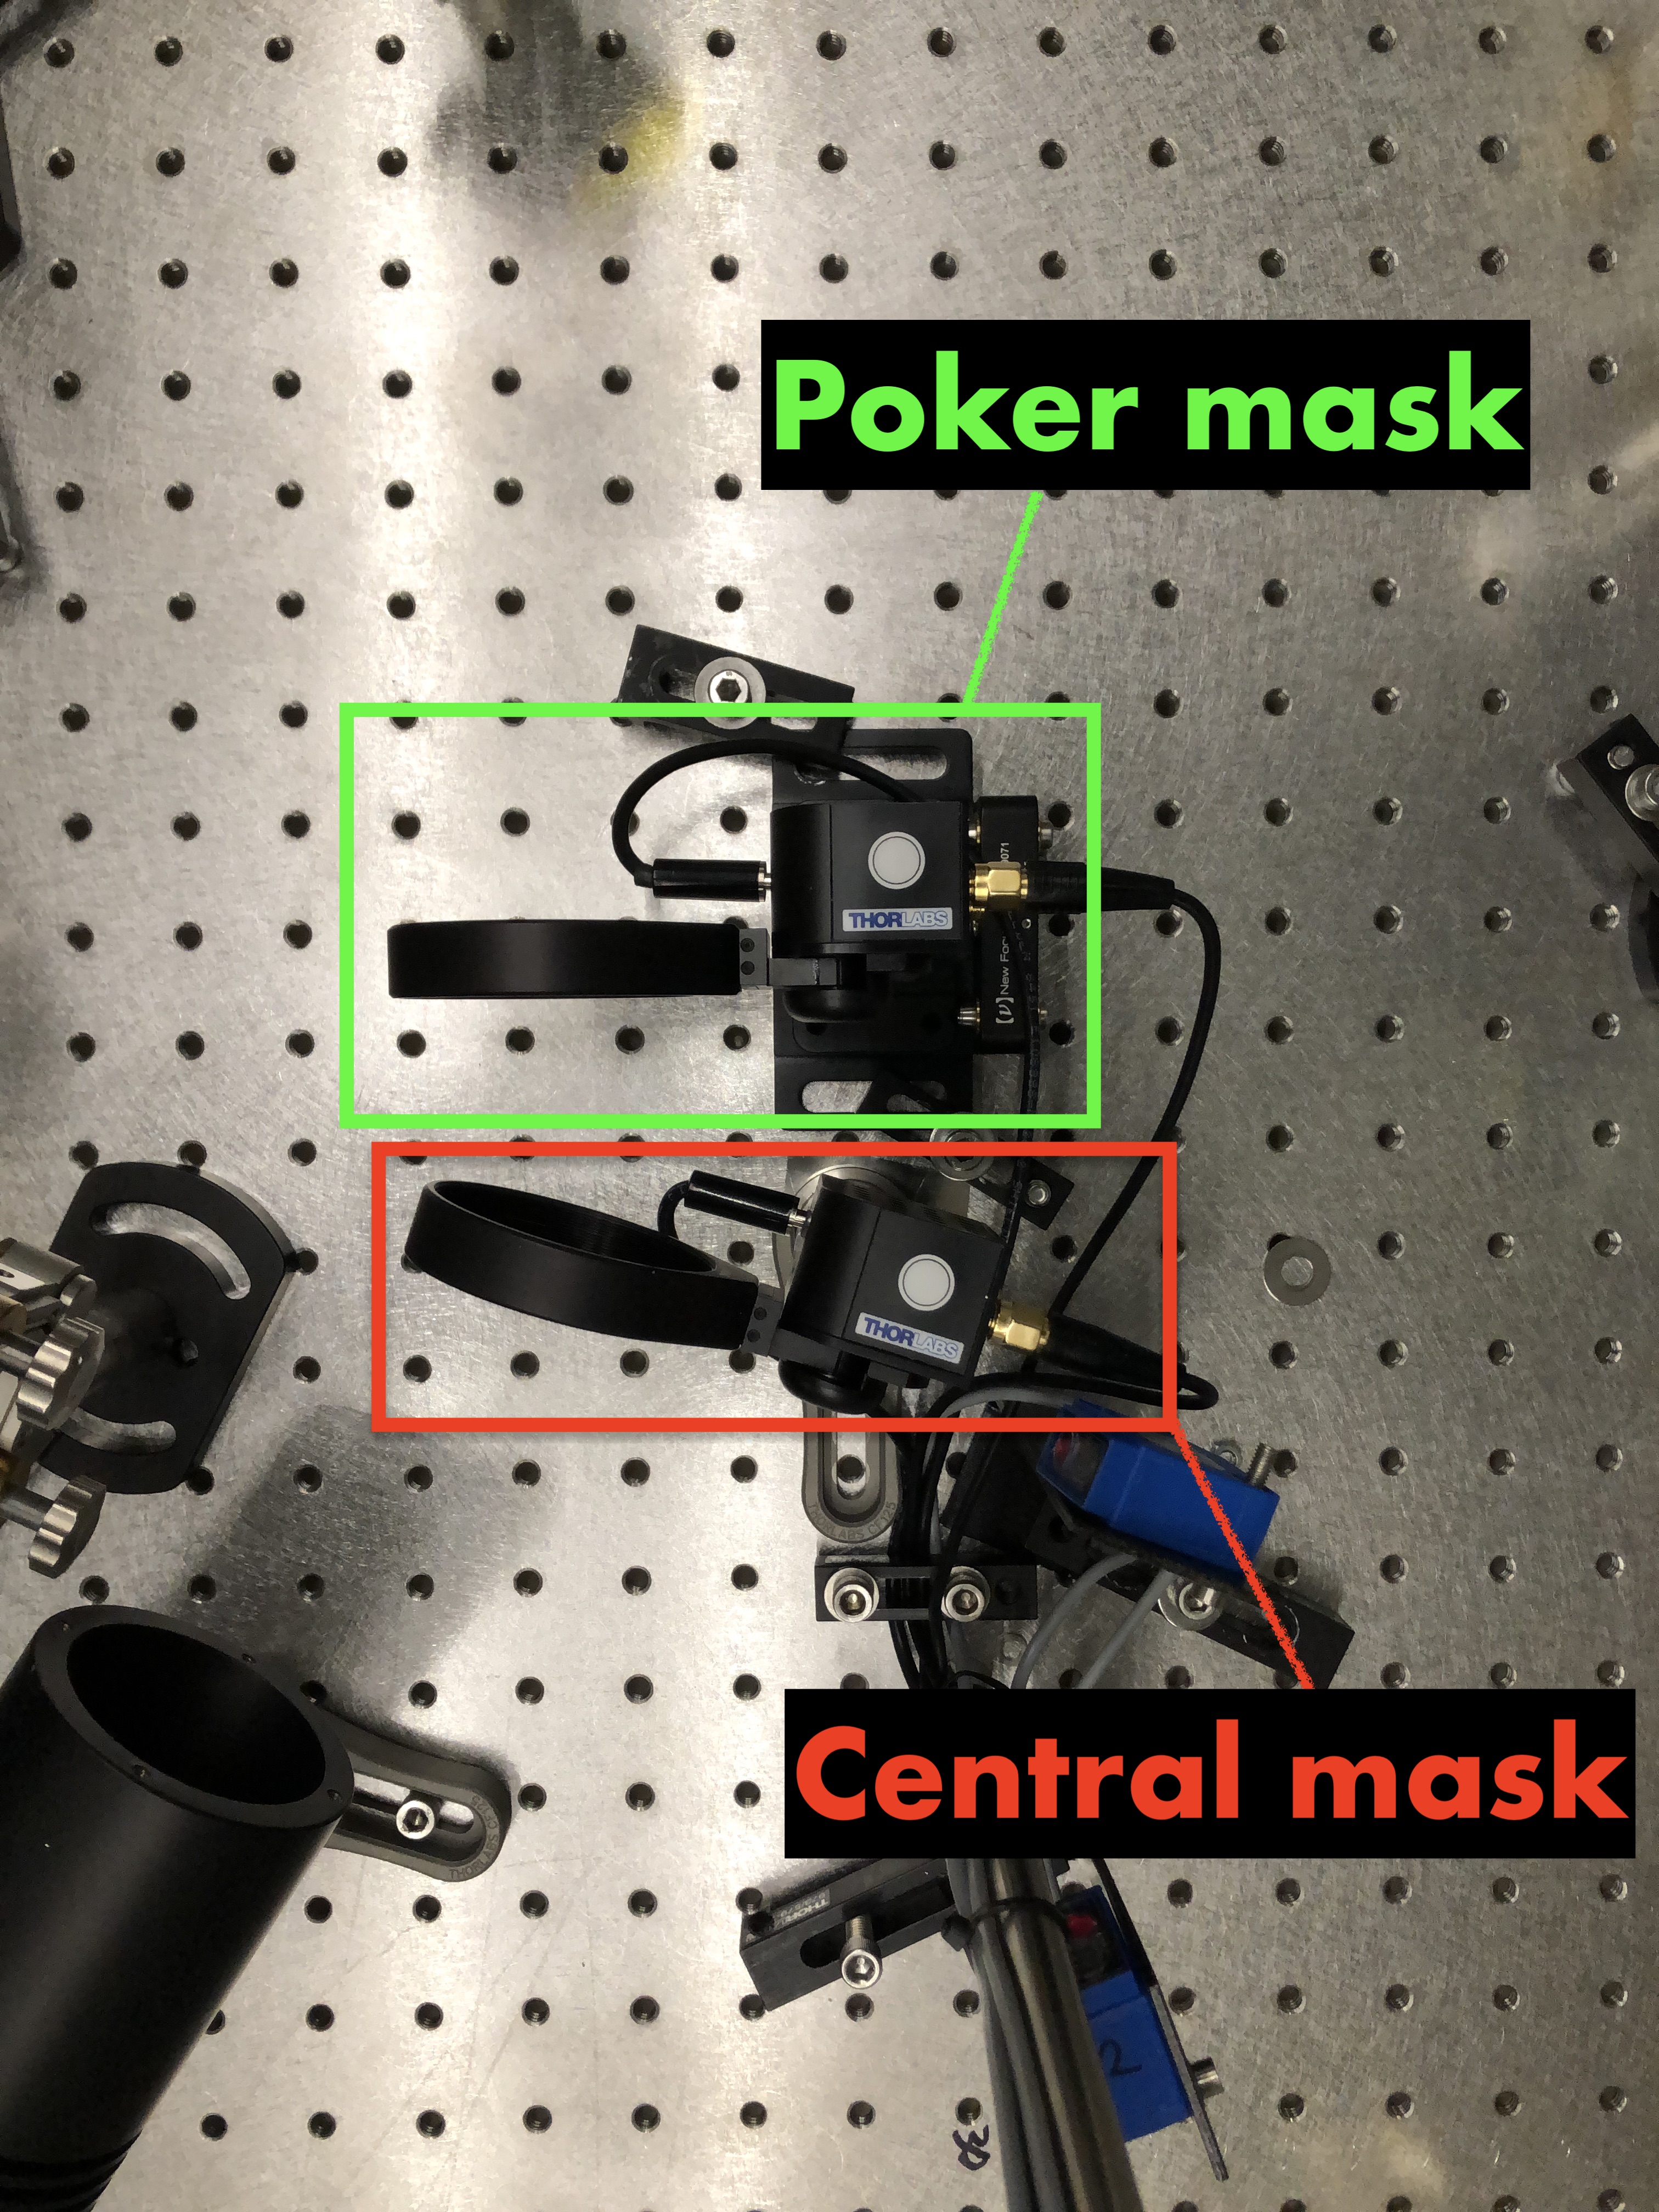
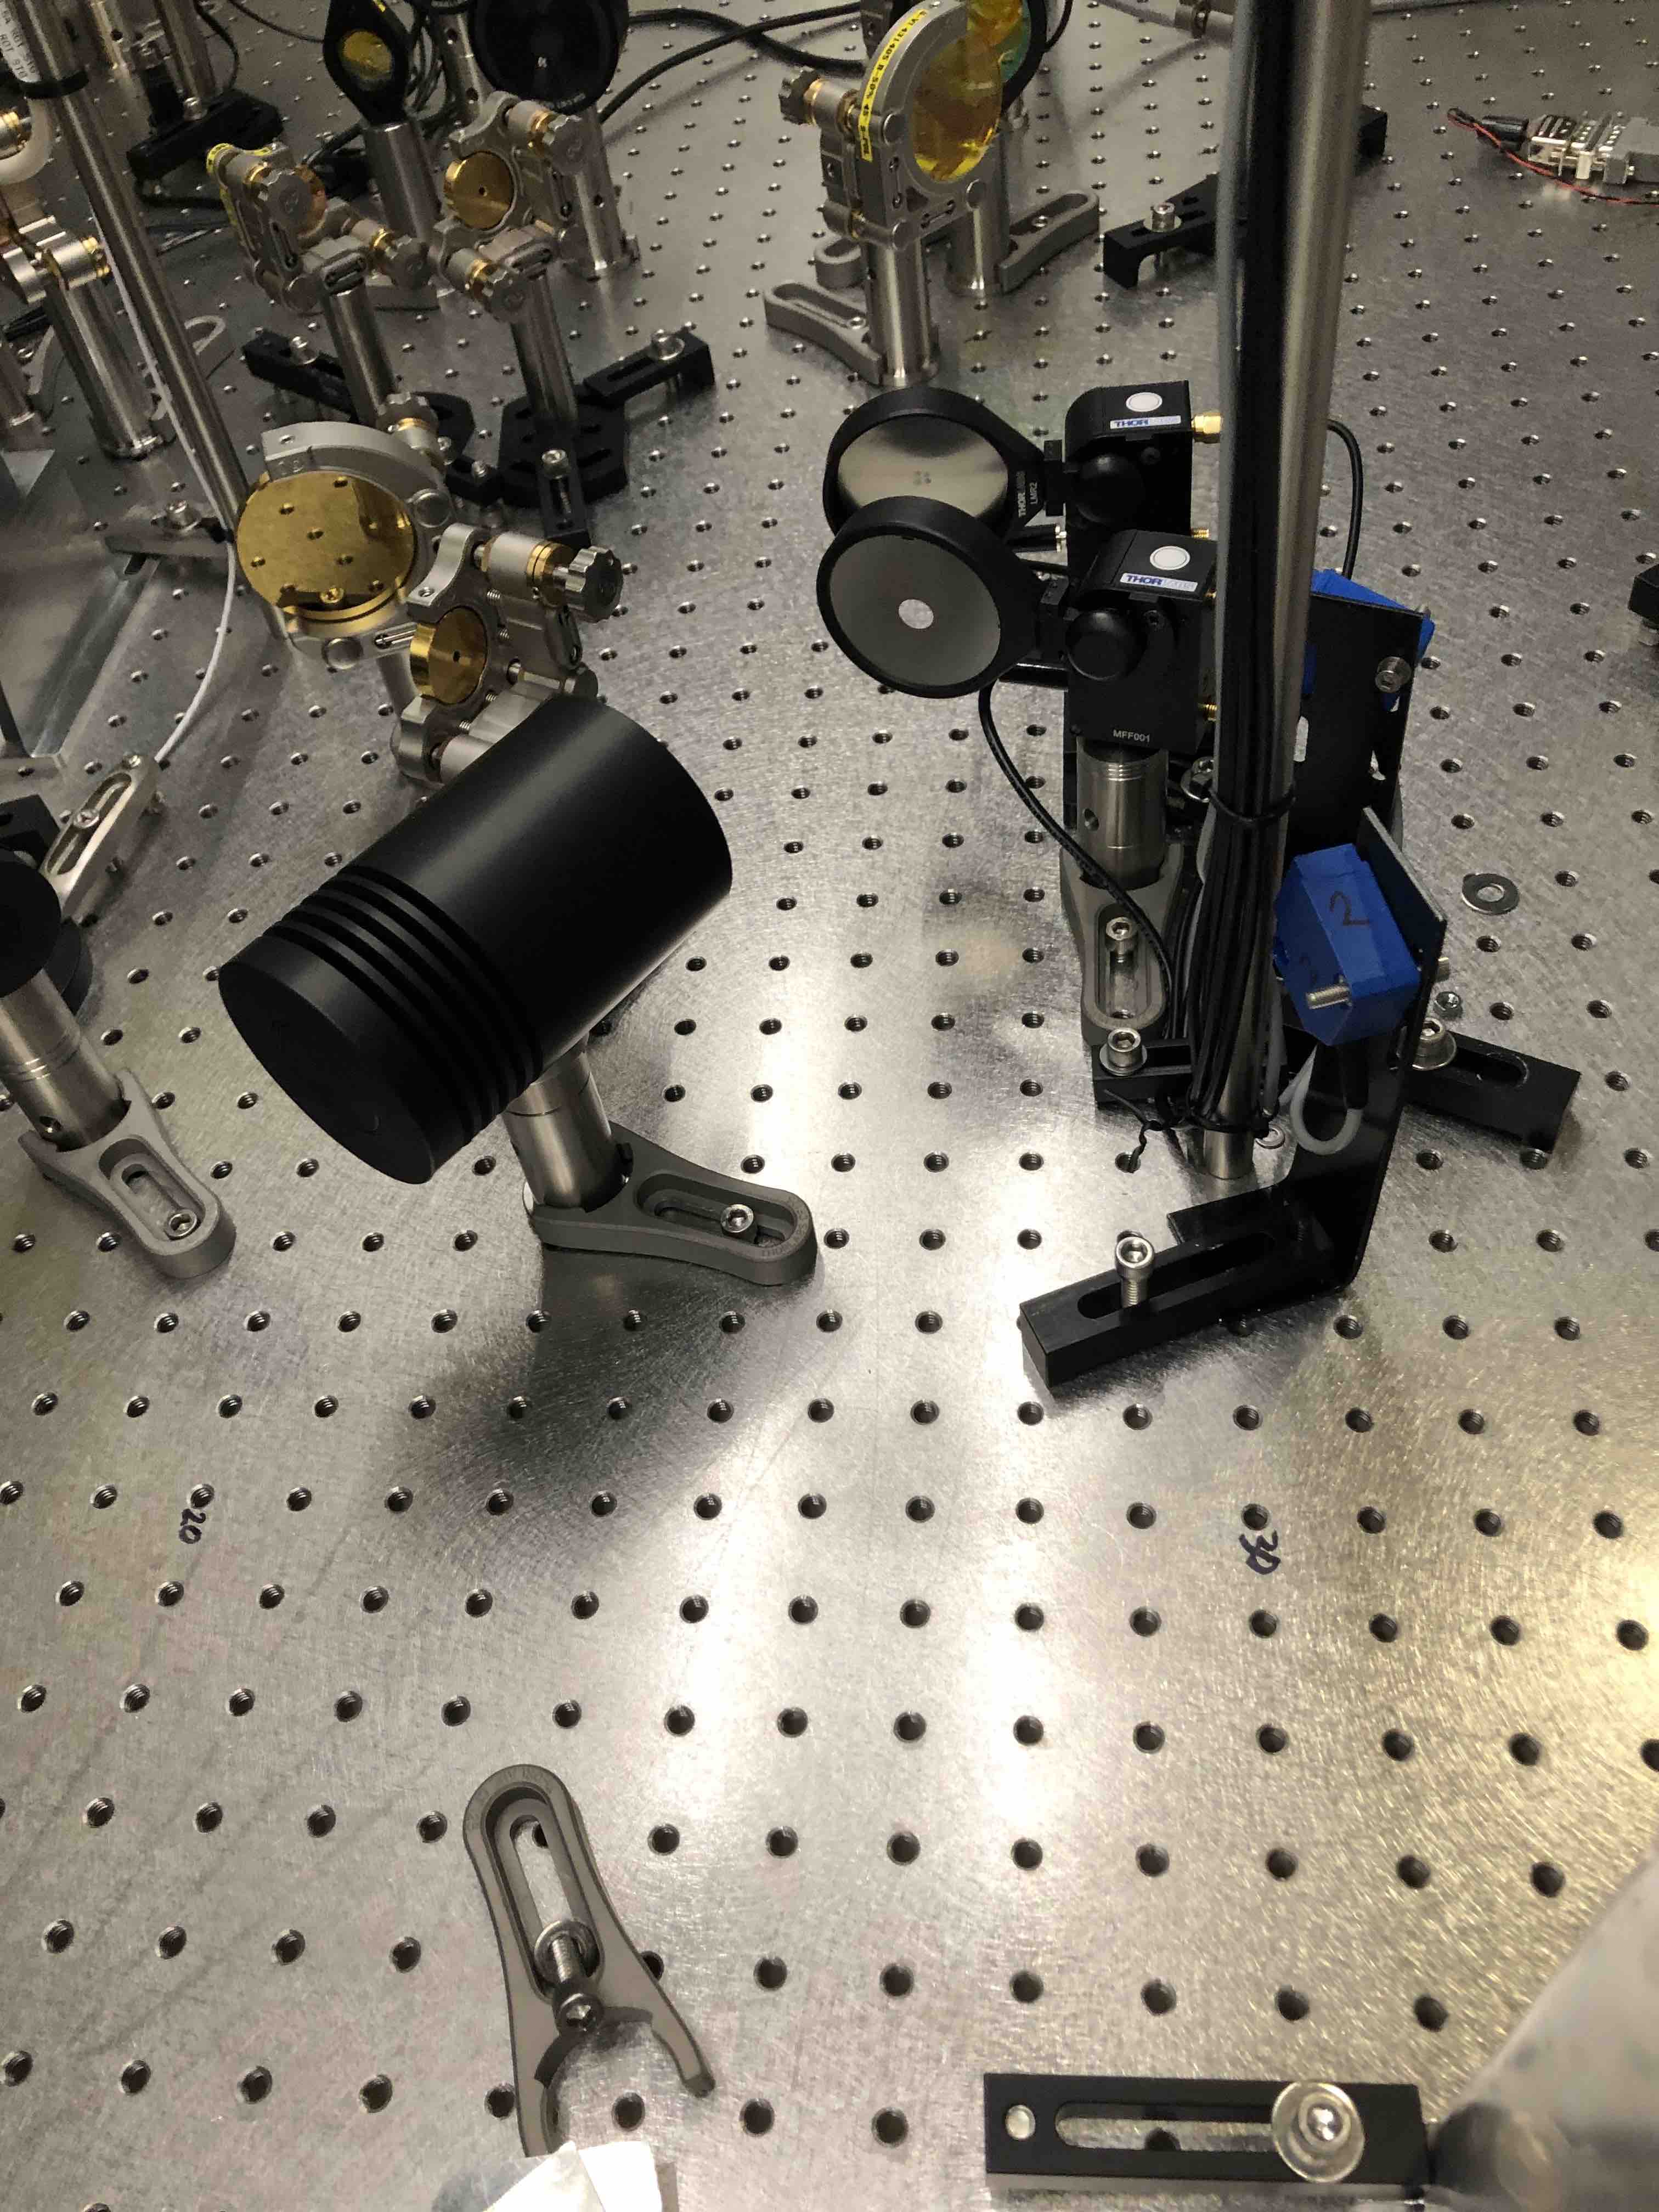
Before installing the point absober mask:
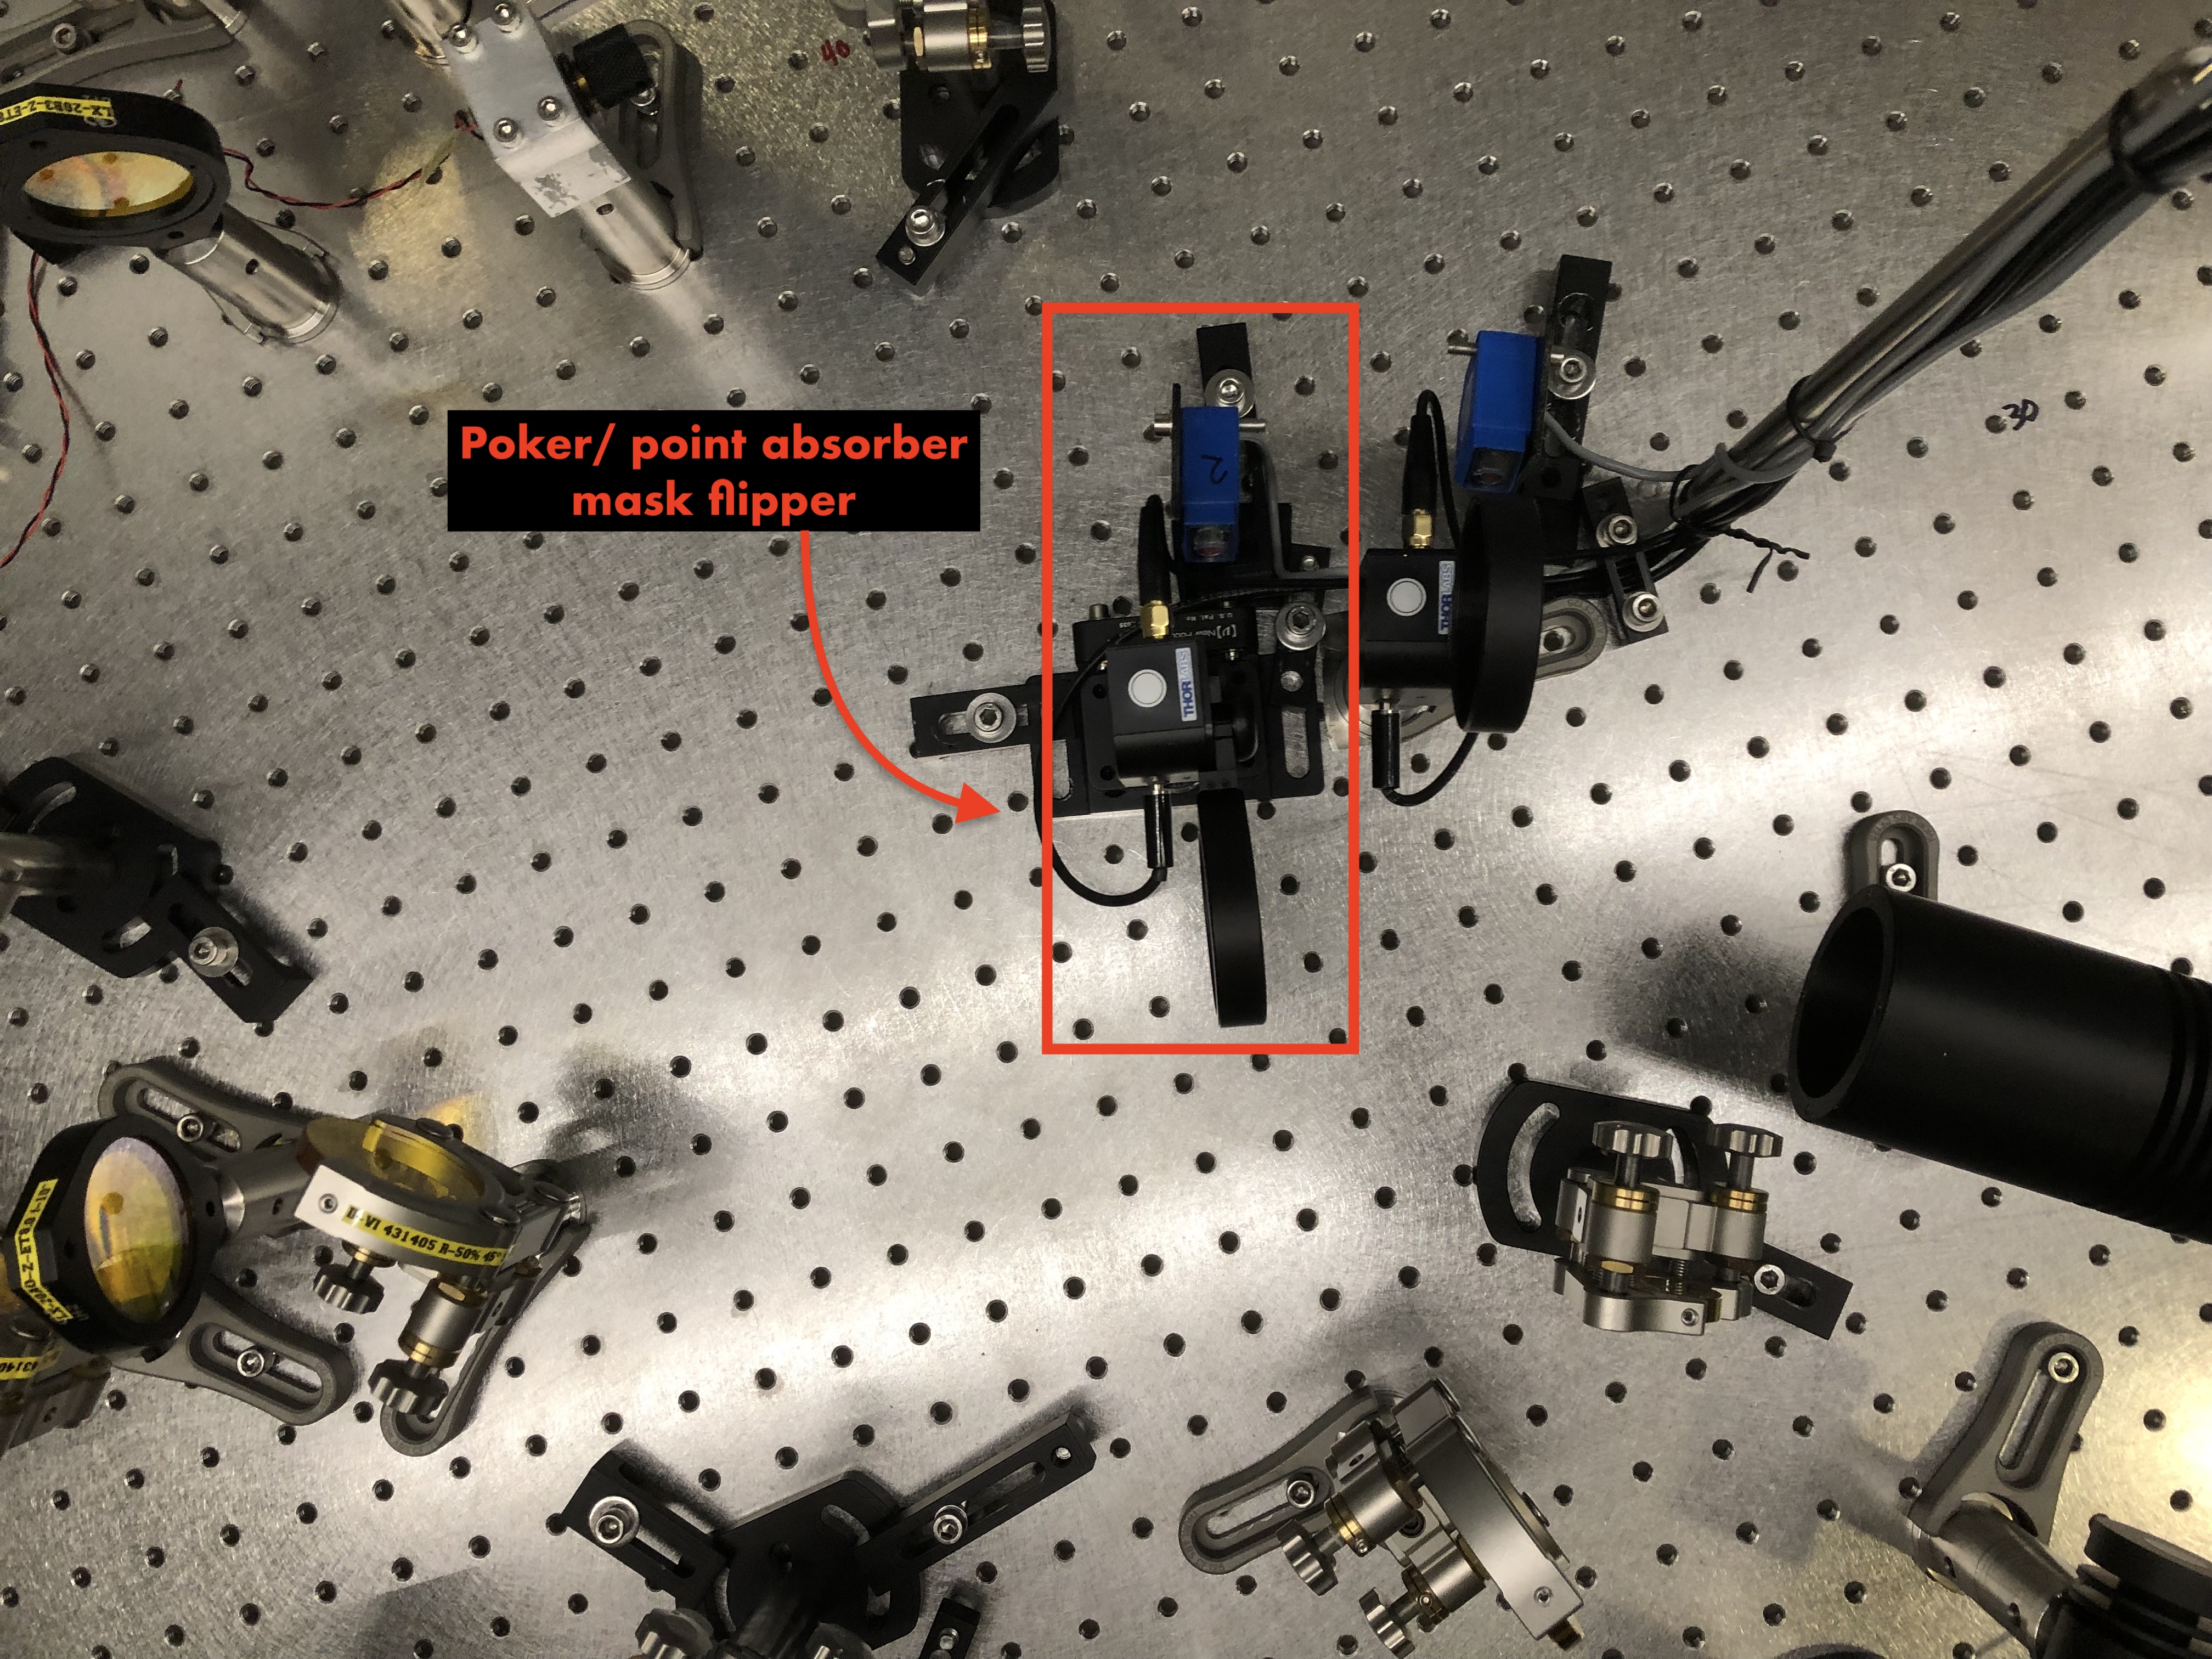
Installing the point absorber mask:
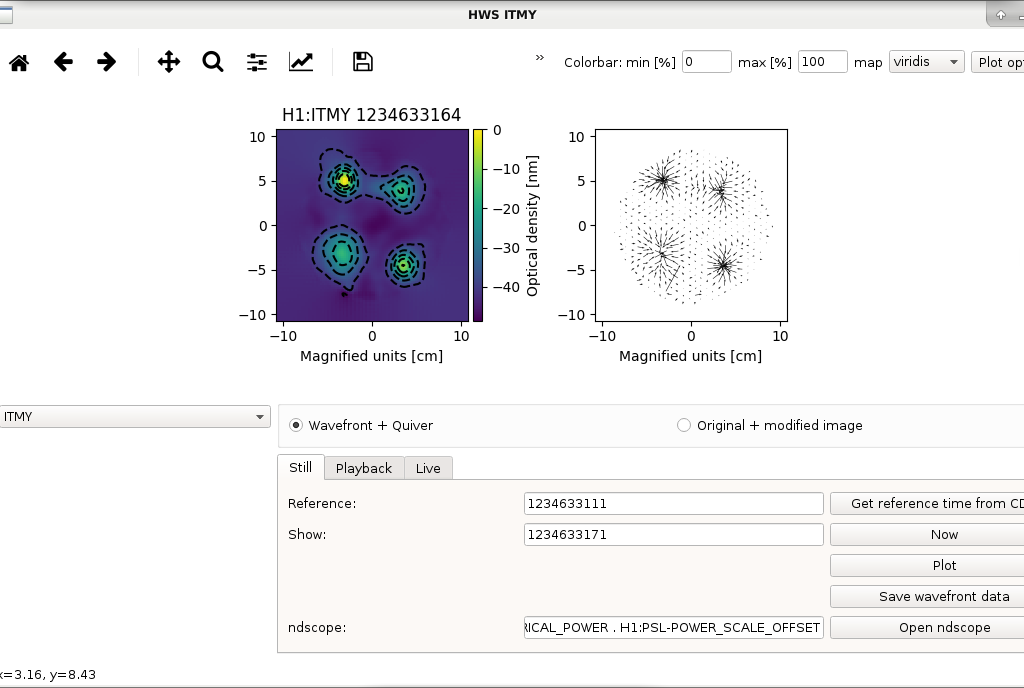
Next step:
Dan, Richard, Jonathan, Carlos, Dave:
h1fw0 is back online writing frames. Dan configured E18-0 POD-1 to rebuild its raid while it is being used by the frame writer.
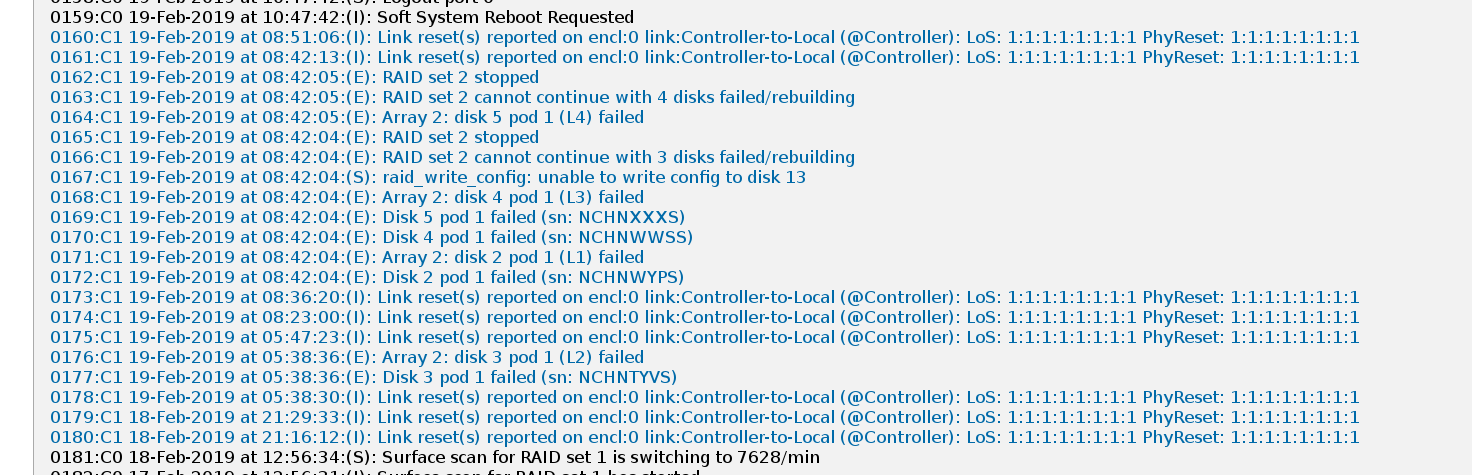
Attached E18 log shows that the problem started at 21:16 PST Mon night, with a repeat at 21:29 and then a disk failure at 05:47 today, at which point I suspect the audible alarm sounded. Problem then became critical at 08:42 with a pod failure, and the frame writer stopped running at 08:44 (all times PST).
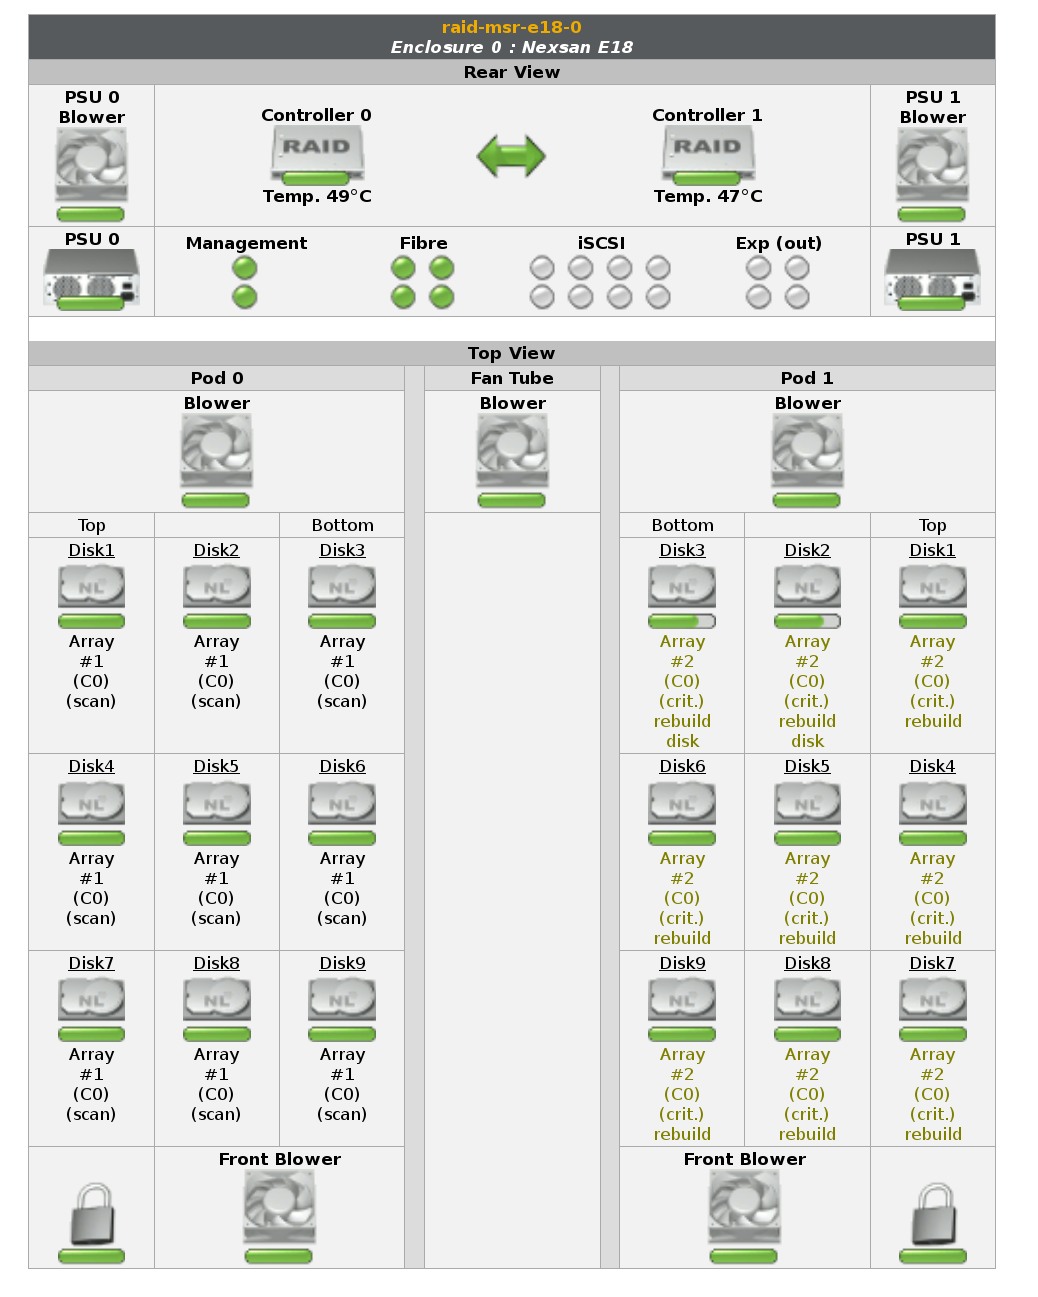
Attached E18 status screen shows POD-1 disk3 and disk2 are actively being rebuilt (green bar is animated growing left-to right), the other disks of POD1 are flashing green-yellow showing they belong to a degraded raid.
Frames gap on hfw0:
-rw-r--r-- 1 controls controls 1.6G Feb 19 08:46 /frames-0/frames/full/12346/H-H1_R-1234629632-64.gwf
-rw-r--r-- 1 controls controls 1.6G Feb 19 11:16 /frames-0/frames/full/12346/H-H1_R-1234629952-64.gwf
FRS12353 was reopened following new developments.
Dan sent our E18-0 logs to the manufacturer (Nexsan) who responded with a recommendation that we 1) upgrade the firmware in the controllers and 2) reseat the controllers.
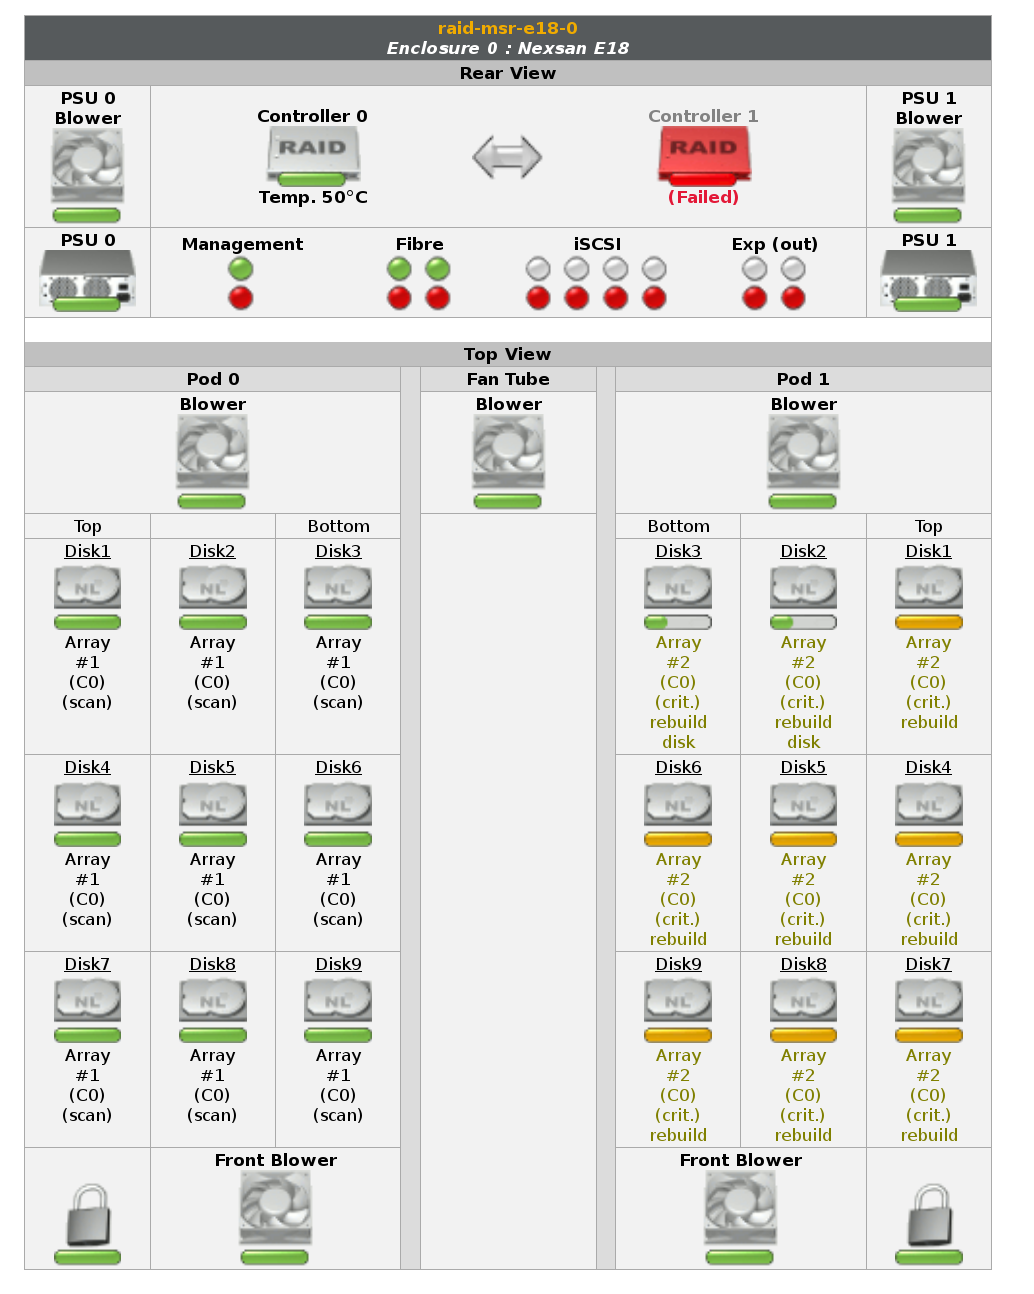
WP8093 was opened to cover these operations. In staggered sequence, Dan upgraded the firmware and rebooted both controllers. He then removed and reseated the controllers. Controller-0 had no issues, but when controller-1 was reseated it failed. We are hoping the original problem was due to a flakey controller-1, which only came to a head when the card was hard rebooted.
Dan is in contact with Nexsan for a replacement controller card to be shipped to LHO, in the mean time we will operate h1fw0's raid with no redundant controller.
Throughout these operations h1fw0 continues to write frames with no interruption.
I'll extend WP8093 to cover the controller replacement.
Image of E18-0 status showing failed controller-1
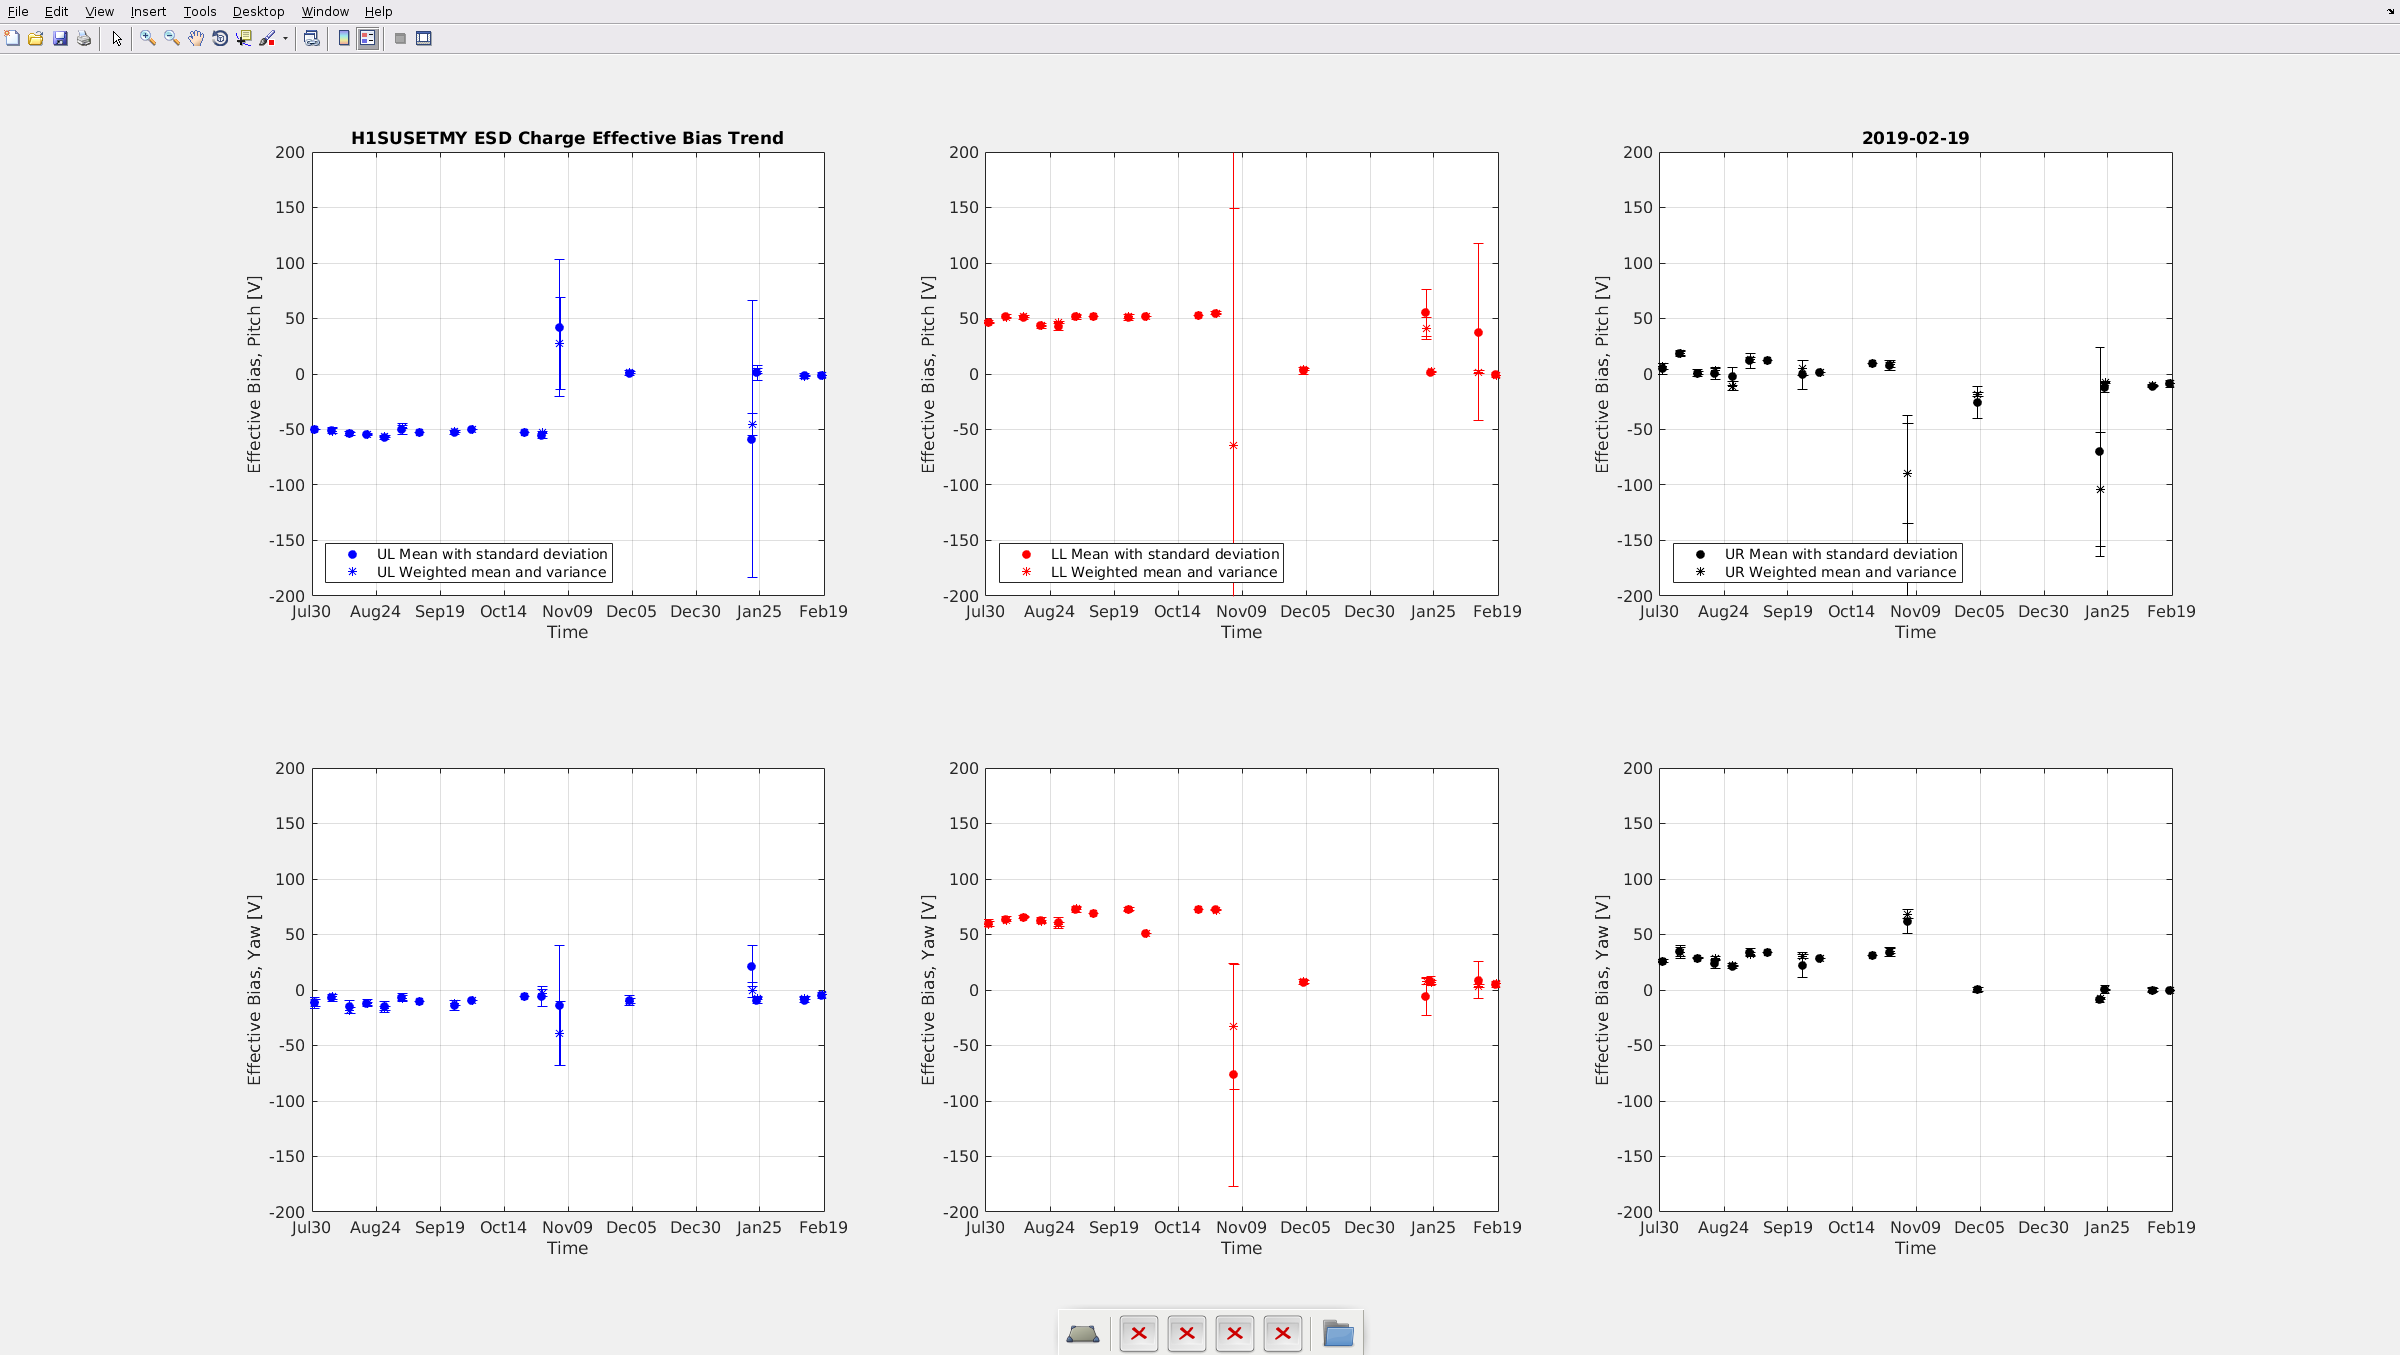
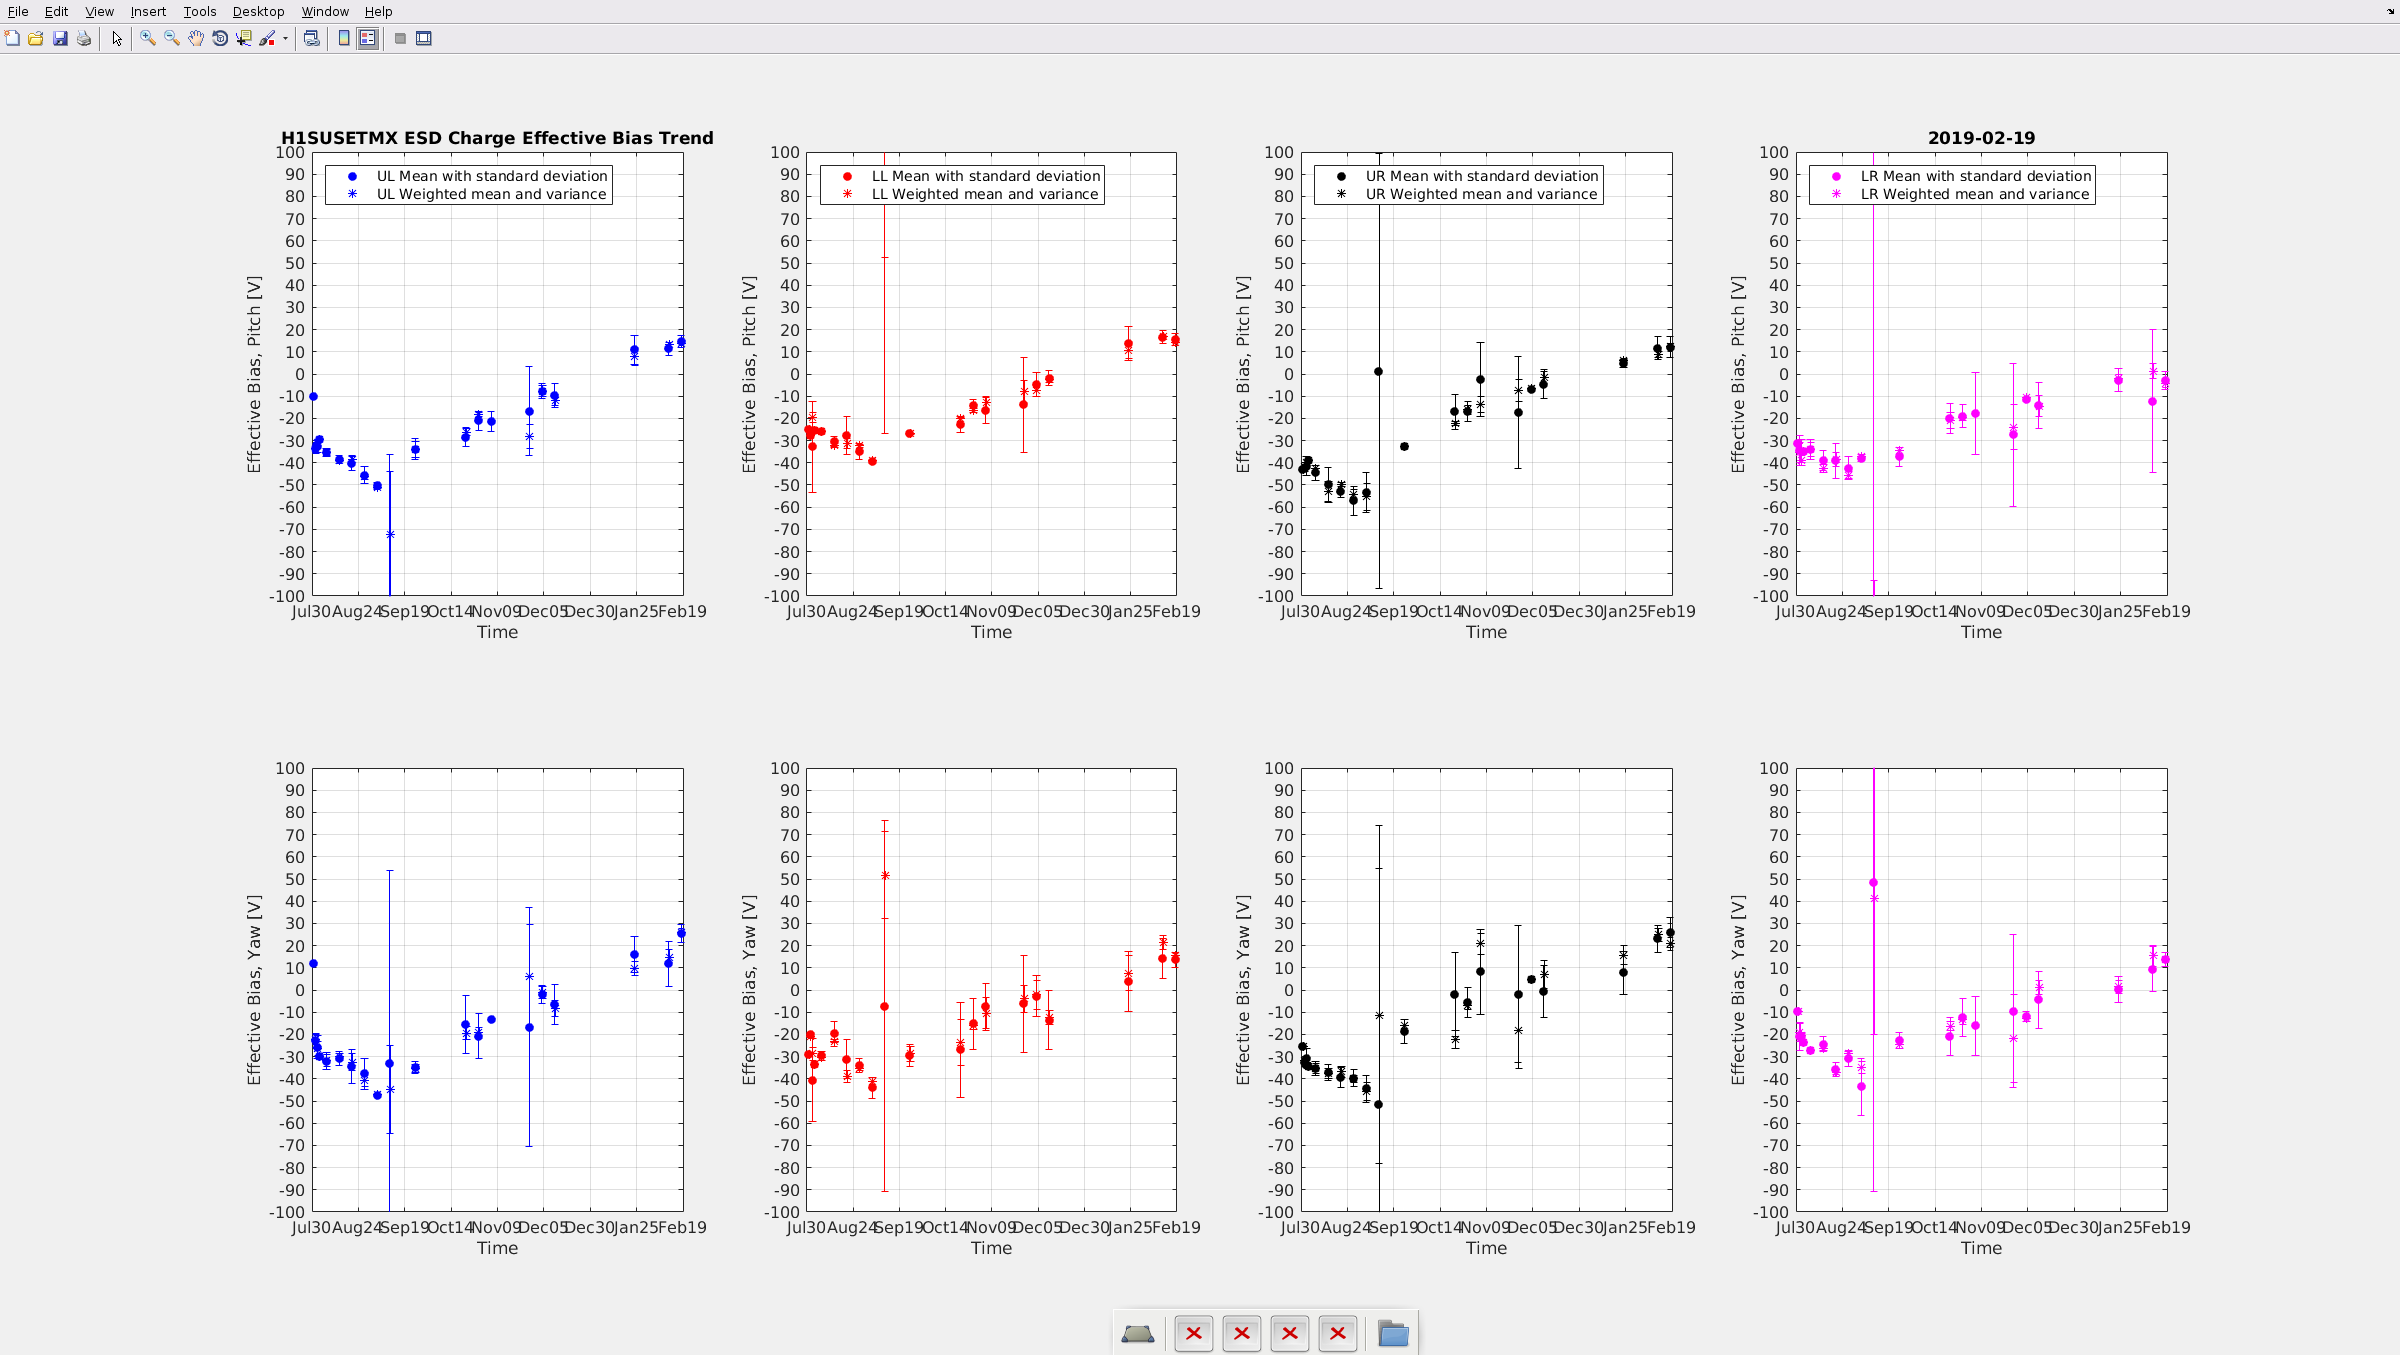
Betsy and Rahul Betsy ran the charge measurements this morning for the ETMY and ETMX and later we performed the analysis on matlab. After finishing the measurements, we restored the alignment slider values (SDF) etc for lock acquisition. The plots of ETMY and ETMX are attached below. No considerable change is observed and it looks consistent with the previous measurements performed last week (or last few week). The long term trend also looks stable. P.S - Later we found that the bias voltage switch for the ETMX was switched OFF, not sure how this has happened. We checked the SDF while restoring the values, however it seems like we might have overlooked it. Jenne switched the bias voltage ON. We will keep this in mind during the next charge measurement.
WP 8092
Unit was placed on a temporary HV power supply. This is part of the 180 Hz noise seen in DARM, alog 46839.
After last nights testing showed this did not help. I have removed the temporary supply.
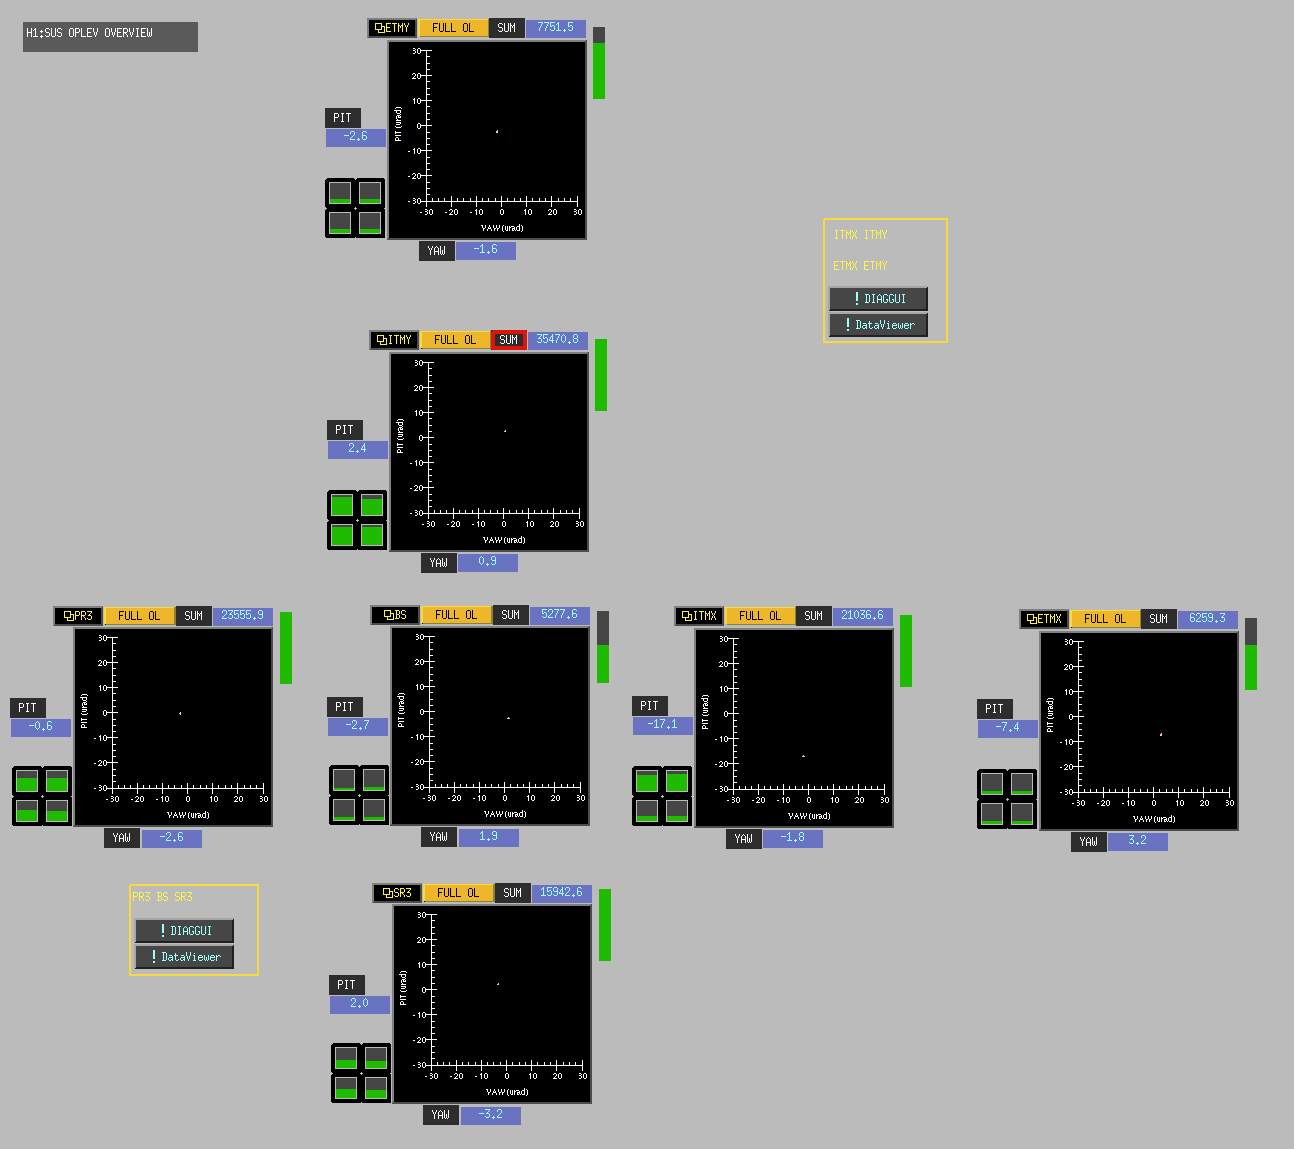
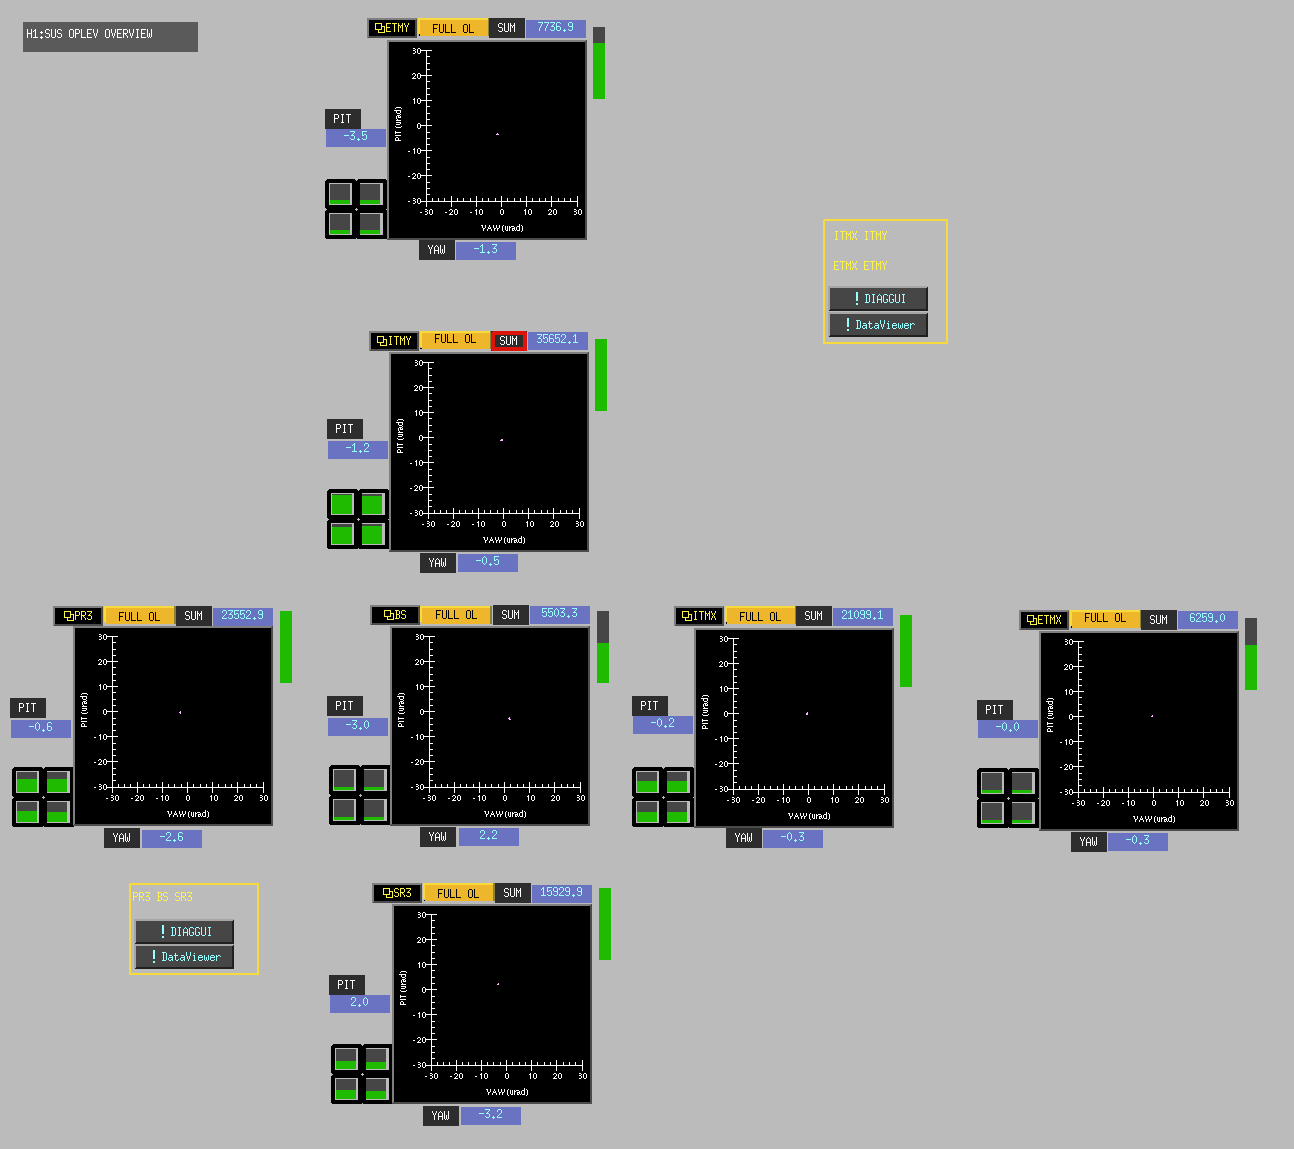
I re-centered ITMX and ITMY OpLevs not enough time for BS and end stations are currently unaccessible.
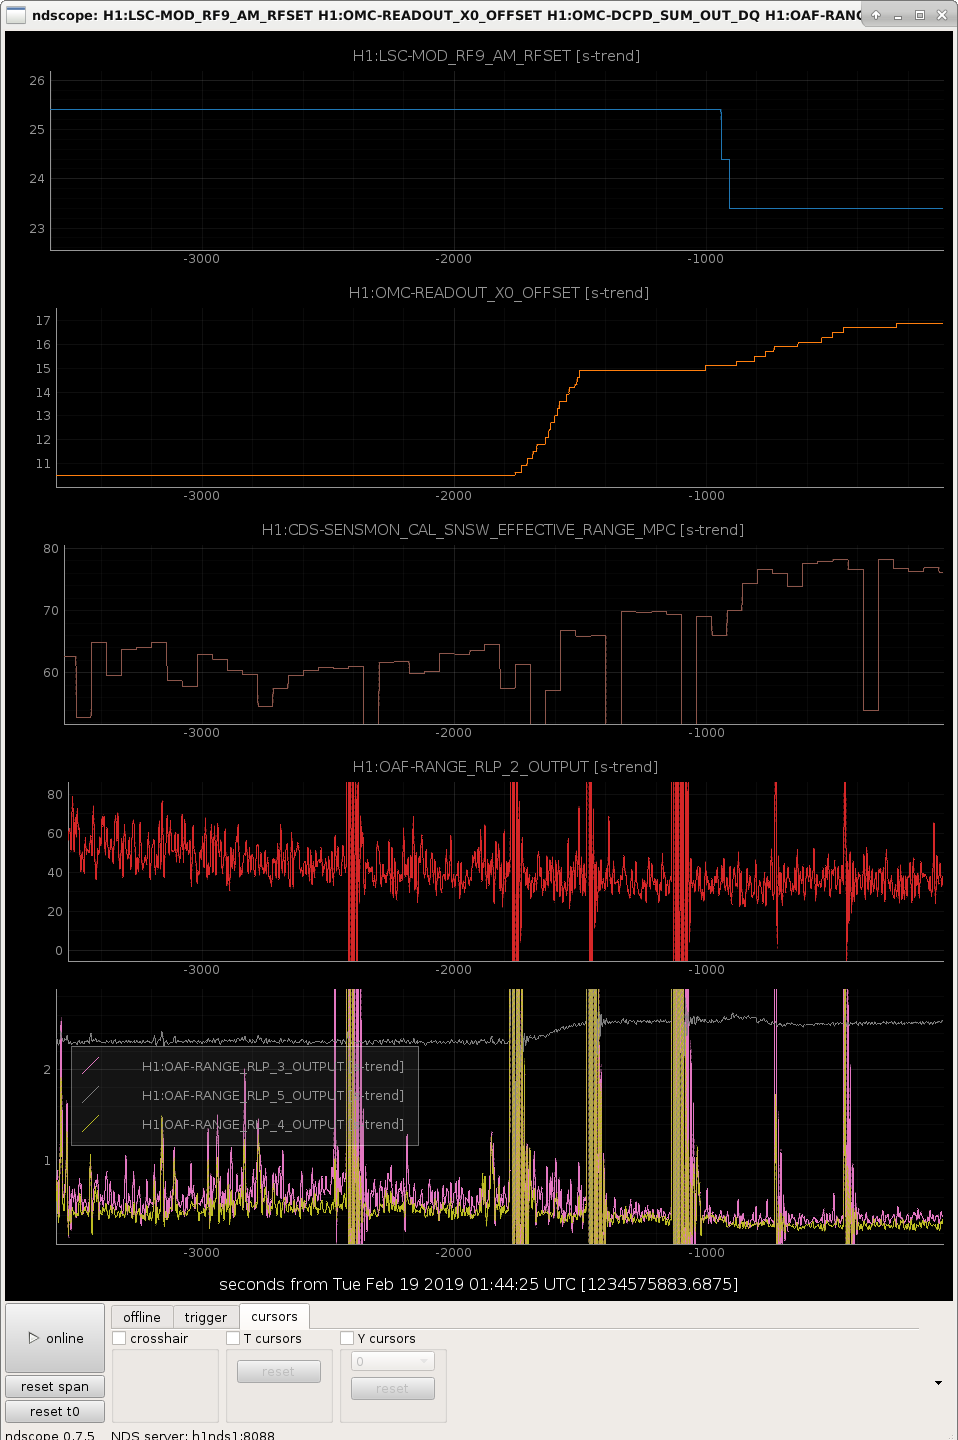
I restarted the primary and redundant calibration pipelines around GPS time 1234632718. This restart picked up the new filters and configurations described in LHO aLOG 46984. The pipelines are running normally, and so are the DMTDQ processes. As expected, the latency decreased by a couple seconds. The testing pipeline was restarted on h1dmt3 as well.
TITLE: 02/19 Day Shift: 16:00-00:00 UTC (08:00-16:00 PST), all times posted in UTC
STATE of H1: Commissioning
OUTGOING OPERATOR: None
CURRENT ENVIRONMENT:
Wind: 3mph Gusts, 2mph 5min avg
Primary useism: 0.01 μm/s
Secondary useism: 0.24 μm/s
QUICK SUMMARY:
Maintenance Day from 8-10am!
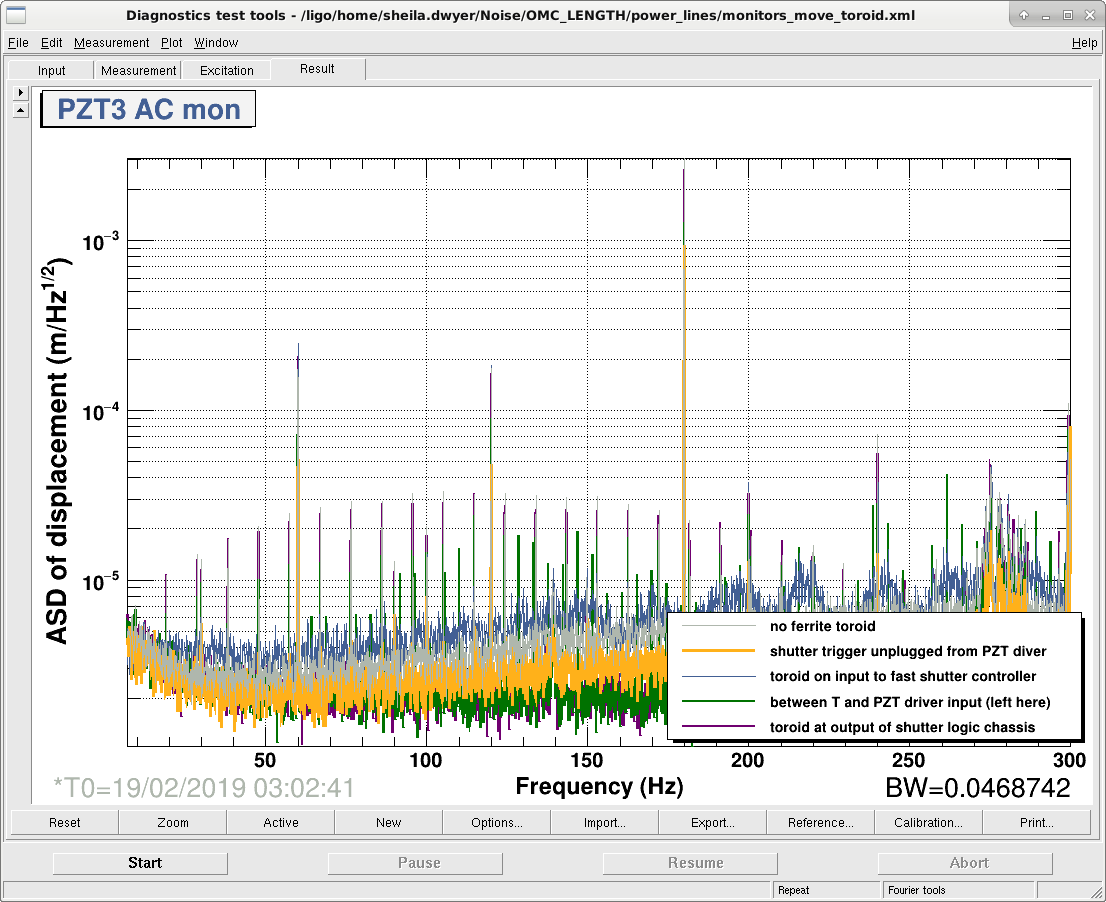
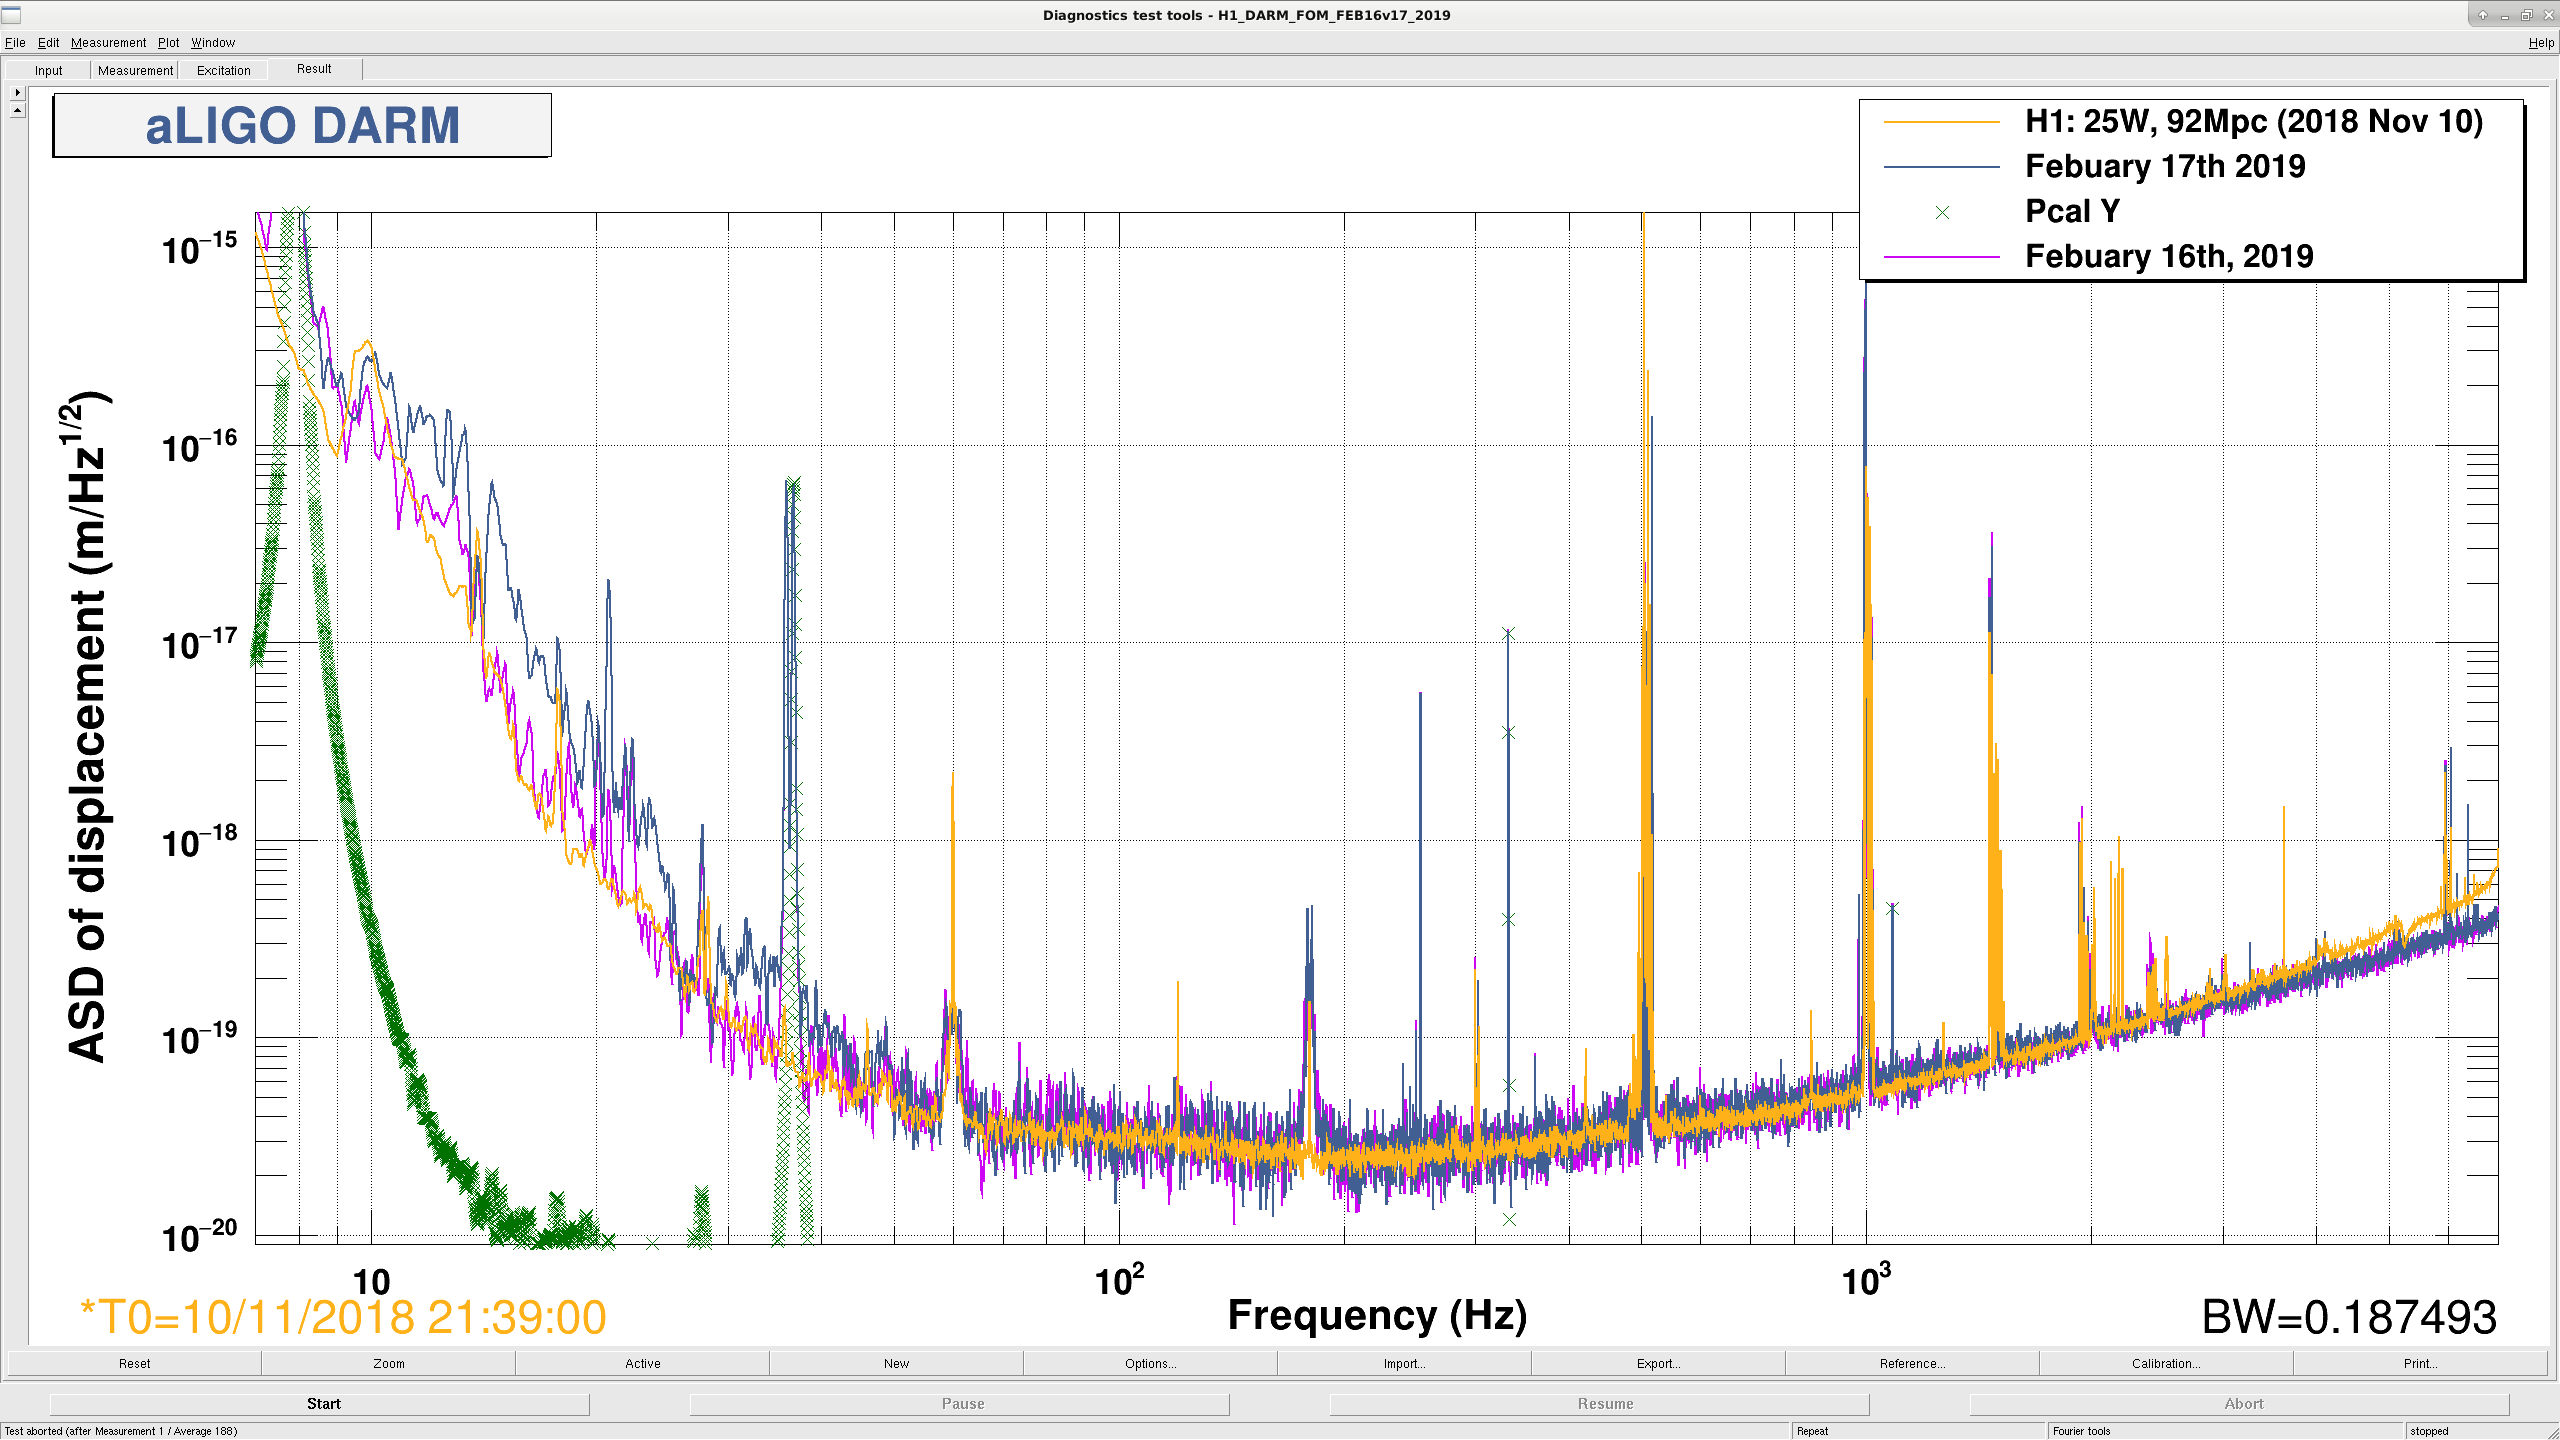
Power line noise in DARM:
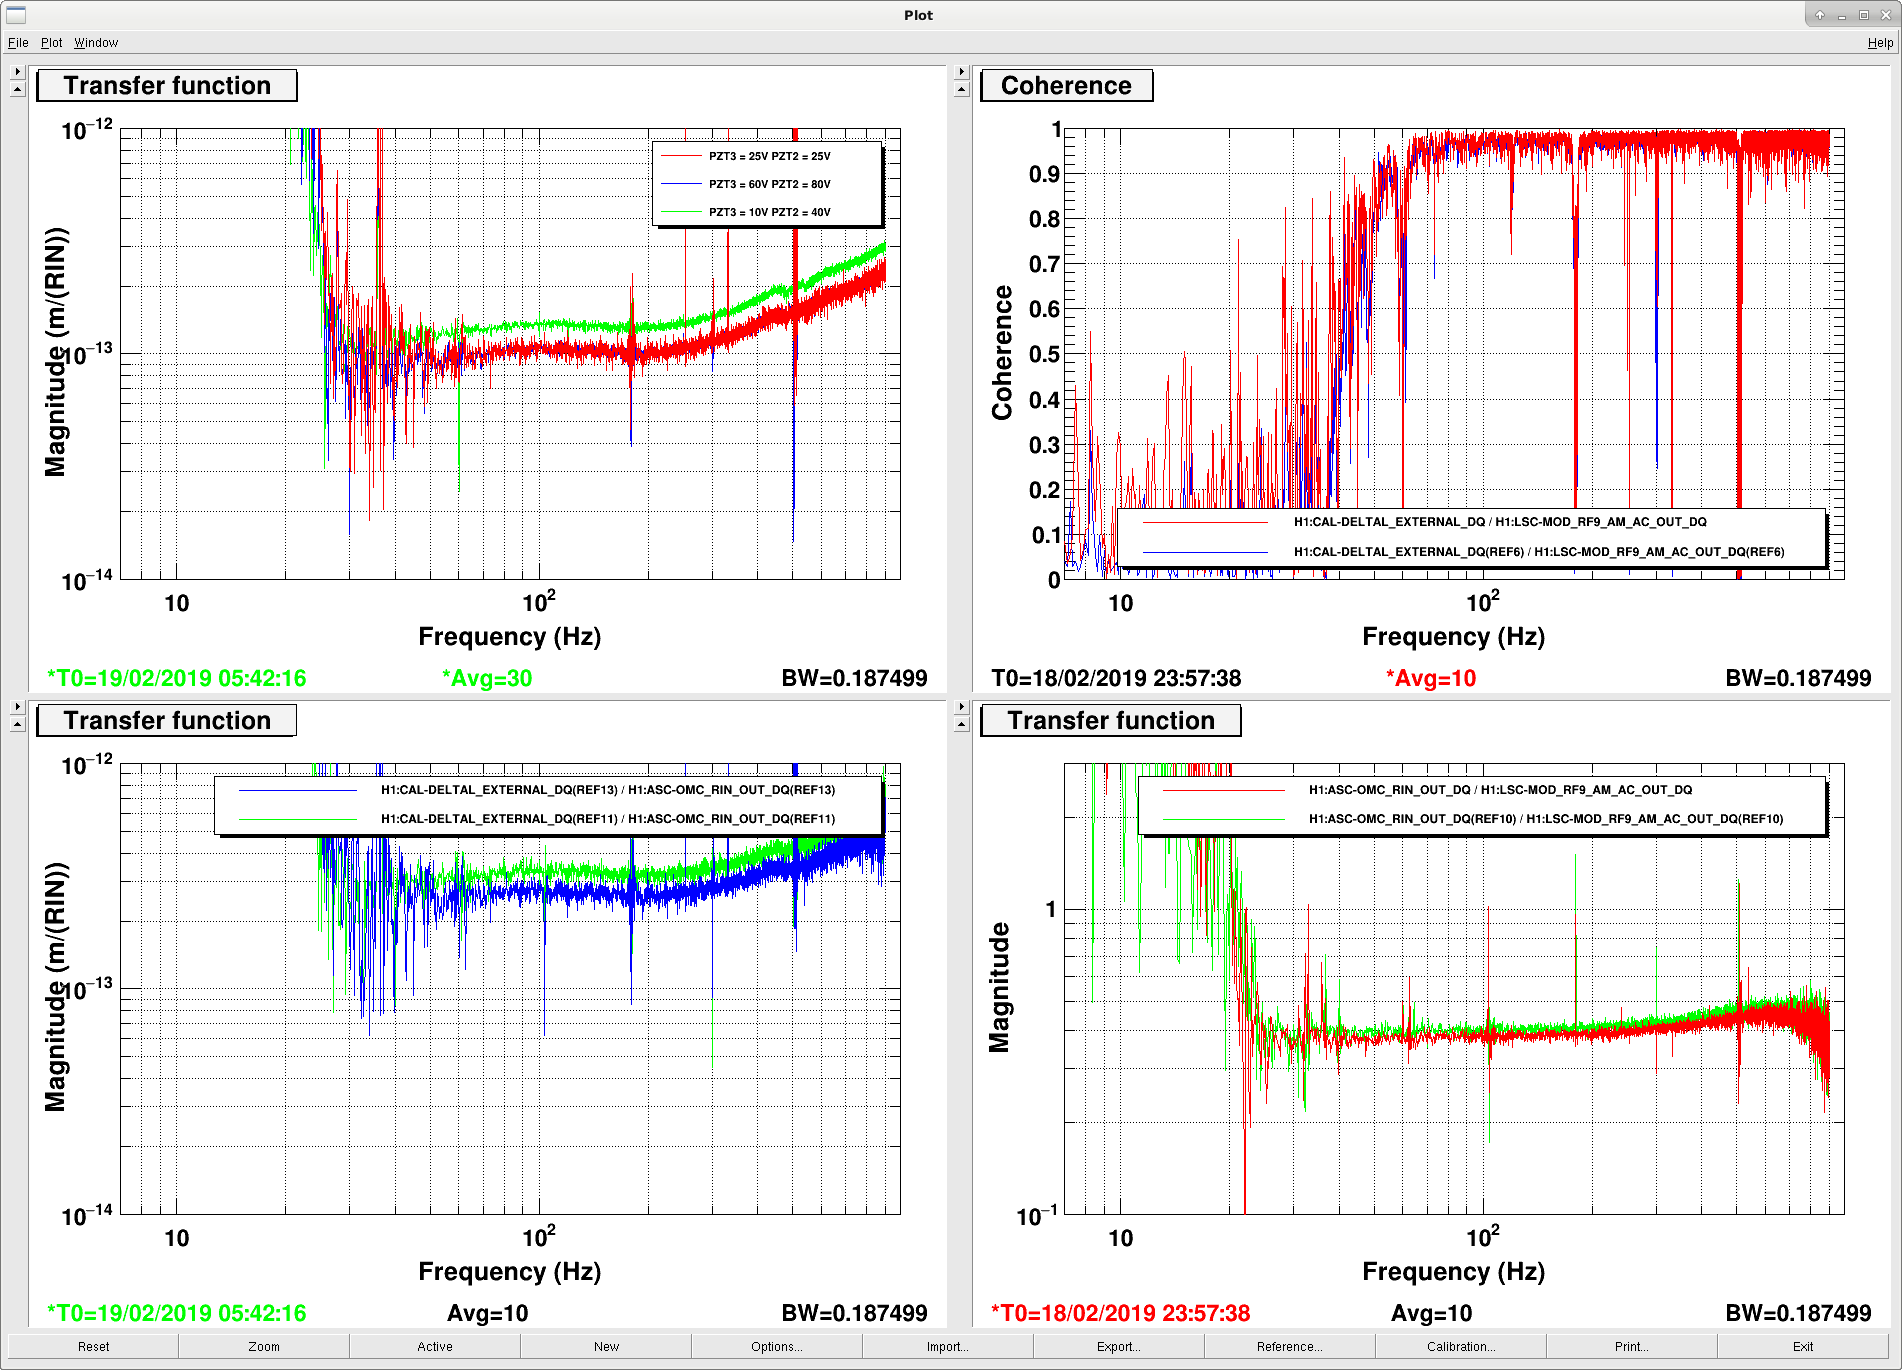
Offset on PZT3 (PZT1):
OMC ASC on dithers:
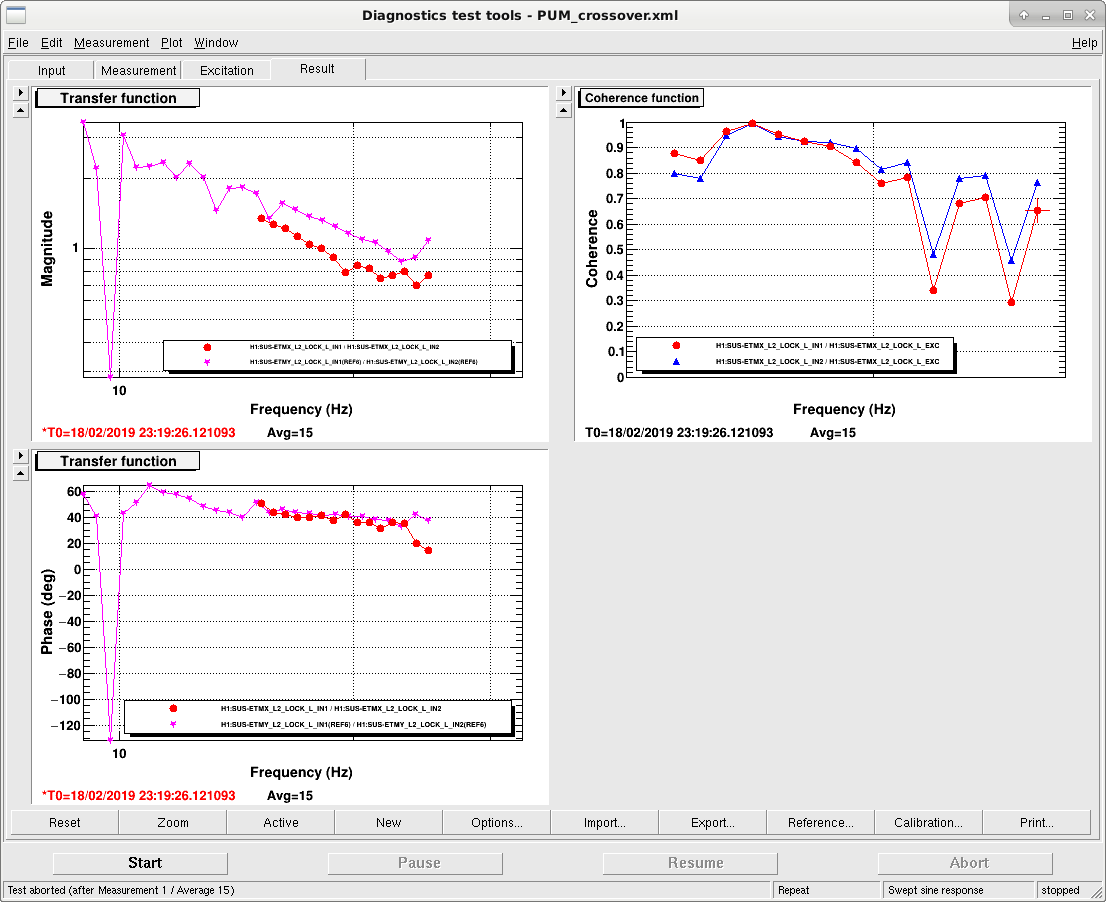
4.5 Hz instability in DARM loop:
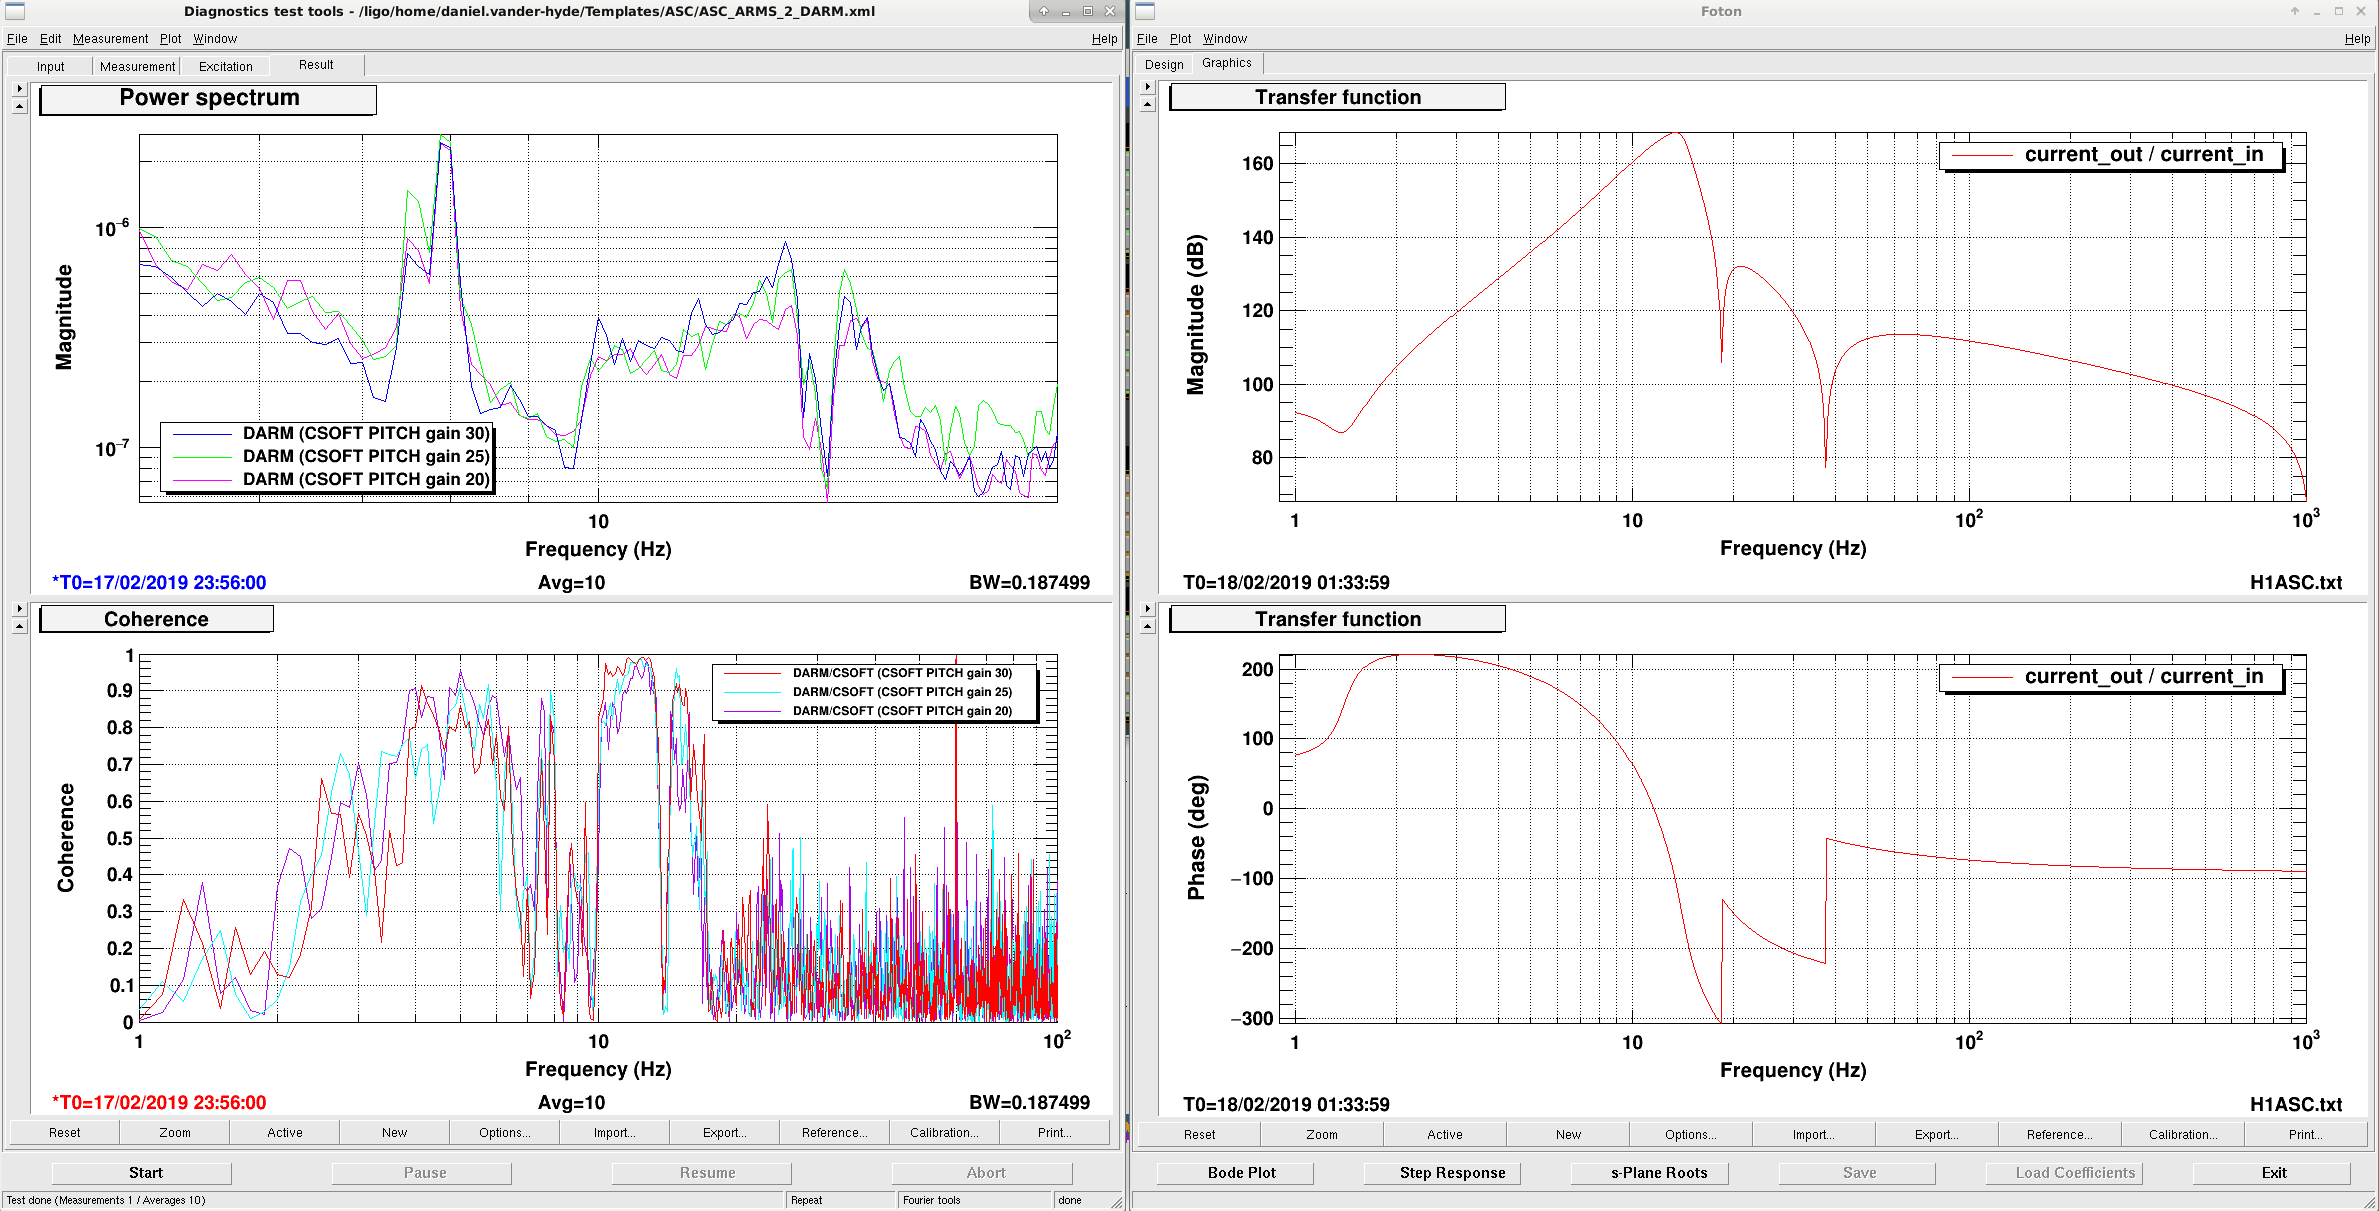
I went through some of the ADS things in LOWNOISE ASC to try to make the ADS a little less confusing to me.
We aso reduced the CSOFT P gain in lownoise ASC from 30 to 20 as Danny was doing yesterday, this is in the guardian now.
We also set the DCPD NULL matrix elements to be the same as the sum matrix elements but with a sign flip. Stefan had set them according to this procedure: 45734 but that isn't compatible with the online DCPD cross corelation calculation, so for the moment we are setting them back to see if we can get some good data for the cross corelation measurement. We also found that there was a gain of 1.2 in the inverse sensing function, which we needed to copy for the null stream filter. Now we are getting more sensible results from the cross correlation.
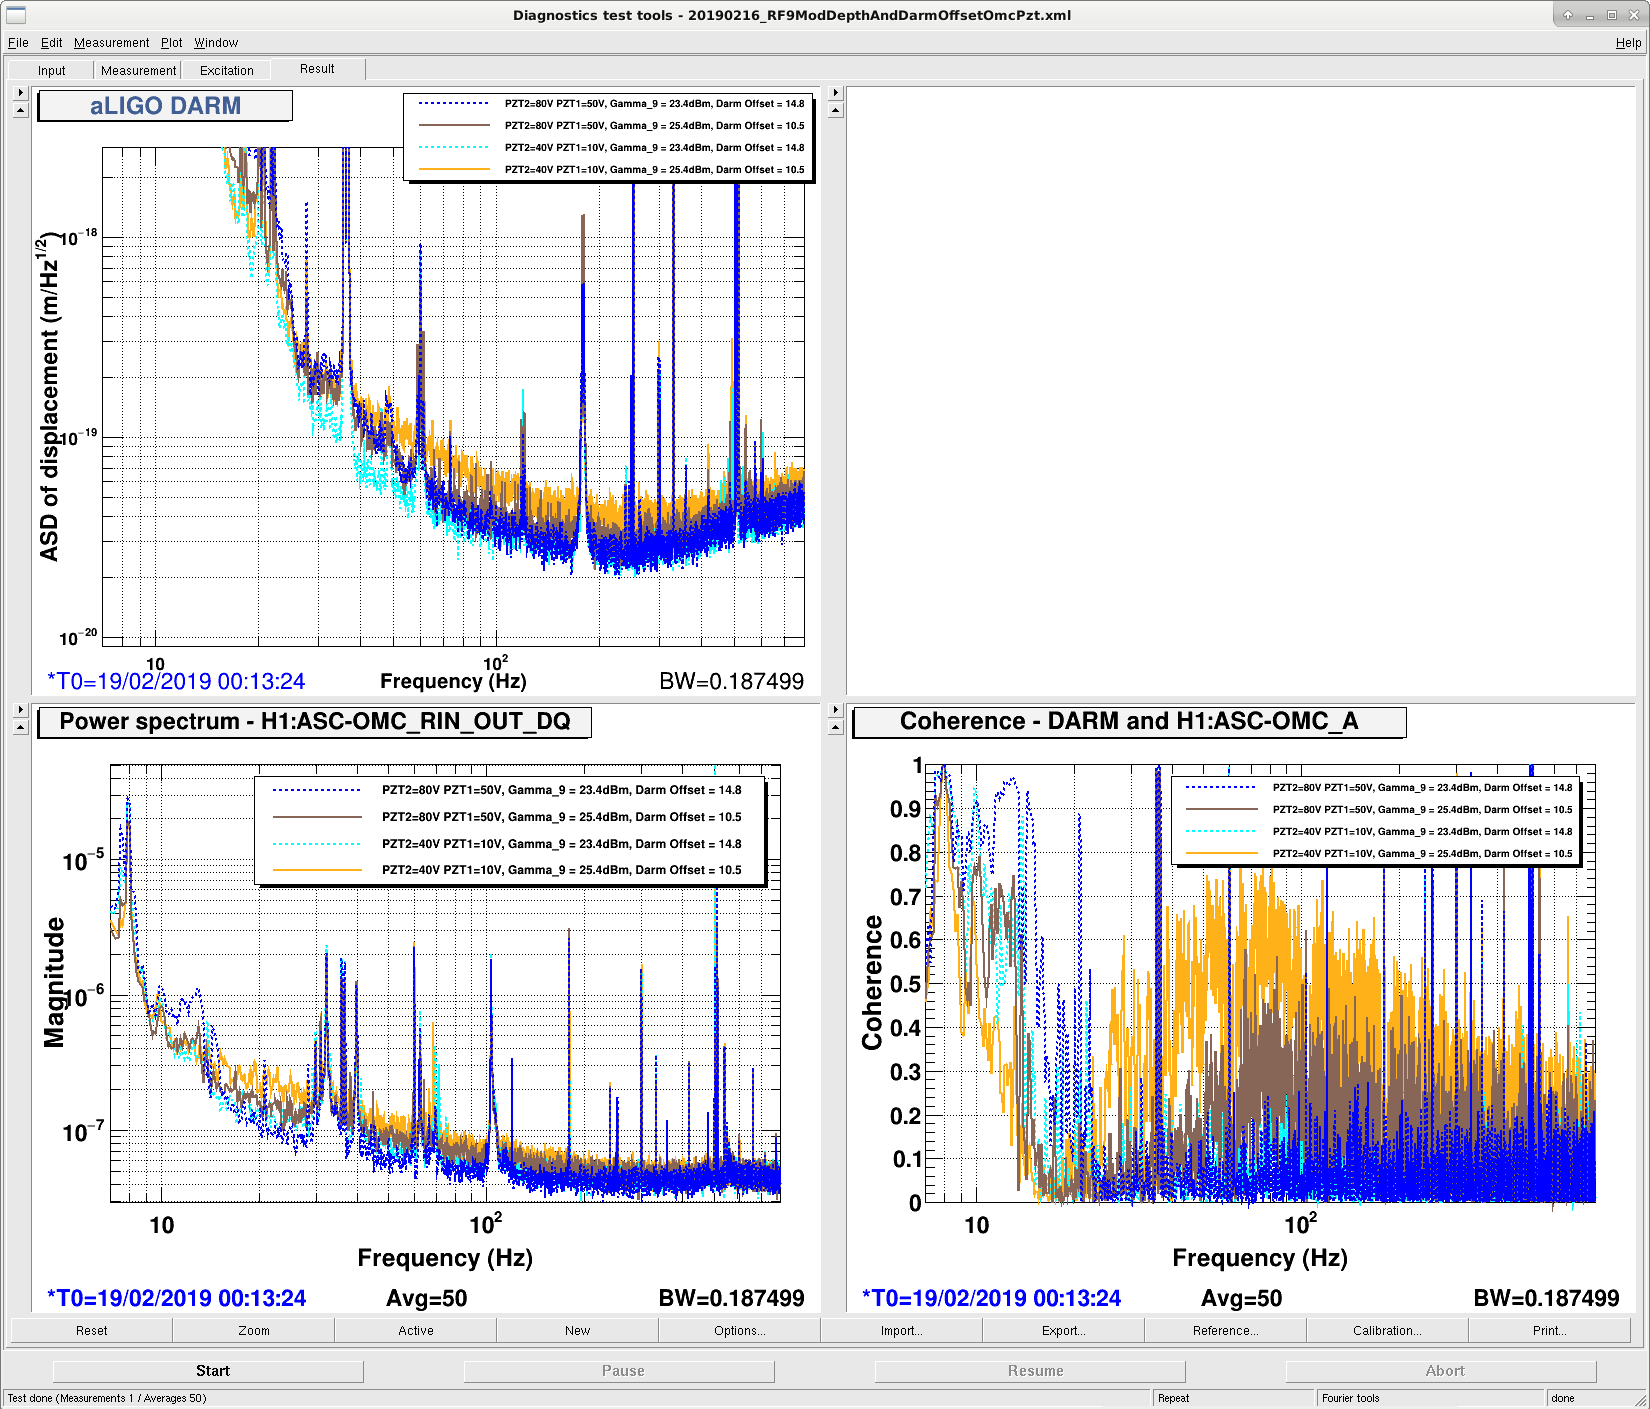
With regards to the OMC PZT offset:
We locked with 50V on PZT3, 78V on PZT2, this combination of PZT voltages should reduce RF9 9th order sideband that gets through the OMC. Looked at DARM, the OMC QPD RIN and coherence between DARM and OMC QPD RIN, as in alog 46831. Made these measurements for nominal DARM offset and RF9 modulation depth, and low DARM offset and high RF9 modulation depth.
It looks like the coherence better with the higher PZT voltages in the case of the driven measurement. Dashed lines in the first attachment are nominal rf9 modulation depth and darm offset. Full lines are with extra modulation depth and reduced DARM offset to increase RF9 coupling. Brown and blue are [50,80]V and cyan and yellow are [10,40]V for [PZT1, PZT2]. Another thing to note is the RIN on the QPDs is increased between these two measurements, we'd expect to be independent of the PZT voltages, so maybe the fluctuations in 9MHz RIN between locks is confusing us.
Other locking notes:
Well, it's back to the drawing board on this one. Thanks for doing the test, it helps eliminate the possibilities. When I get there next week, I will measure the common/differential mode attenuation of the torroid that was used to be sure it has some useful attenuation in the audio band as intended. Could still be that the LLO and LHO torroid materials are different and has high permeability at different frequency bands. Feels a bit like grasping at straws now though.
All EX I/O chassis fans appear in DARM, and I have been using them as injections, along with other injections to investigate the voltage noise coupling to DARM. I have left for a couple of weeks so I wanted to enumerate changes that have not yet been undone (or made permanent).
1) Temporary ESD power supplies, HV, 48 and 18, have been set up just beside the field rack and grounded to both the rack and the beam tube.
2) The temporary power supply ground connection was moved from the field rack ground at the rear bottom of the field rack to the field rack chassis ground that is attached to the ground bar on the cable tray. This reduced the resistance between the ESD chassis and the power supply ground.
3) All IO chassis were grounded to the racks. This reduced the resistance between the IO chassis and the rack from very high values to less than 1 ohm.
Moving the ESD power supplies out to the field rack and grounding them in various ways did not change the coupling to DARM of the SEI, ISC, and SUS fans as well as temporary injections that affect the grounds. Also, I have not yet been able to find voltage differences, such as between the beam tube and the ESD shield ground, that have consistent coupling ratios to DARM for each of the different peaks (see figure) and so I cant yet predict the contribution of the broad band V noise to DARM.
Tagging @DetChar -- Derek's been pointing fingers at the 2023-era 283.91 Hz PCALX calibration line (documented in LHO:66268) in trying to investigate some low-level constant glitches that have appeared in recent summary page plots, eg 2023-02-08 Omicron Triggers. However, we were questioning this given that the PCALX is a single mono-chromatic excitation. Following other rabbit holes today, I re-discovered this aLOG covering IO chassis at the end-station -- and in particular to the h1susex and h1susauzex IO chassis fans cause lines visible in DARM. I would would be much more easily convinced that these off-the-shelf fans are mixing with each other, varying their speed, and glitching. There's already an FRS ticket in about this, FRS Ticket 12399 (which is how I found it), but I think it might be worth escalating this FRS ticket to be an IIET ticket so that we actually spend some money to fix these fans -- or at the very least re-dedicate person power to performing this investigation again with our new sensitivity and tying the investigation closer to the CBC group's glitch metrics to get rid of it. Also, all these IO chassis were upgraded to a -v5 version of the IO chassis design in 2021 -- see LHO:60058. So -- maybe the character / impact of these fans is now different?
[M. Wade, A. Viets]
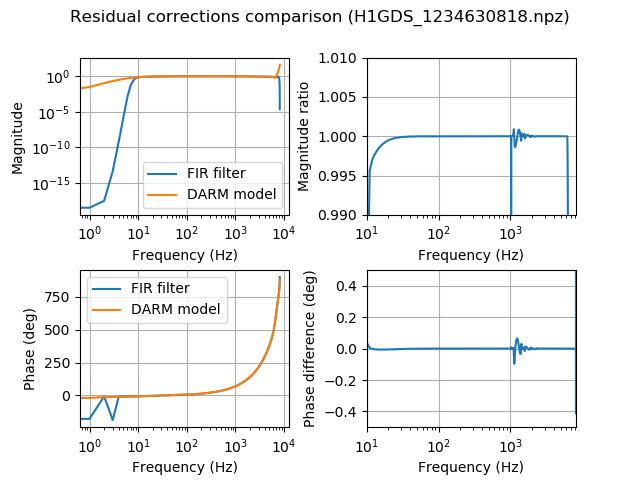
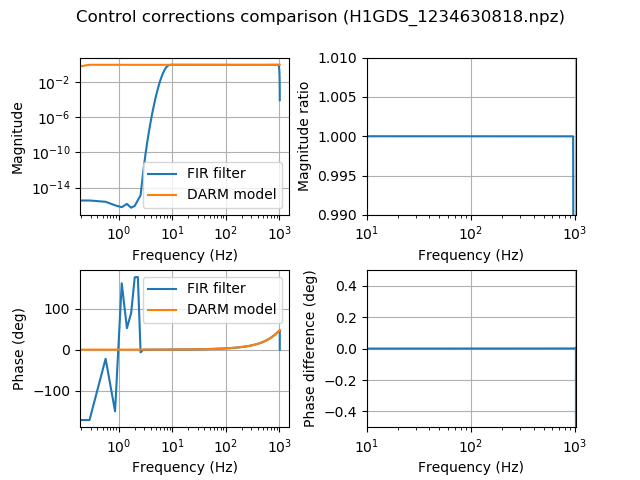
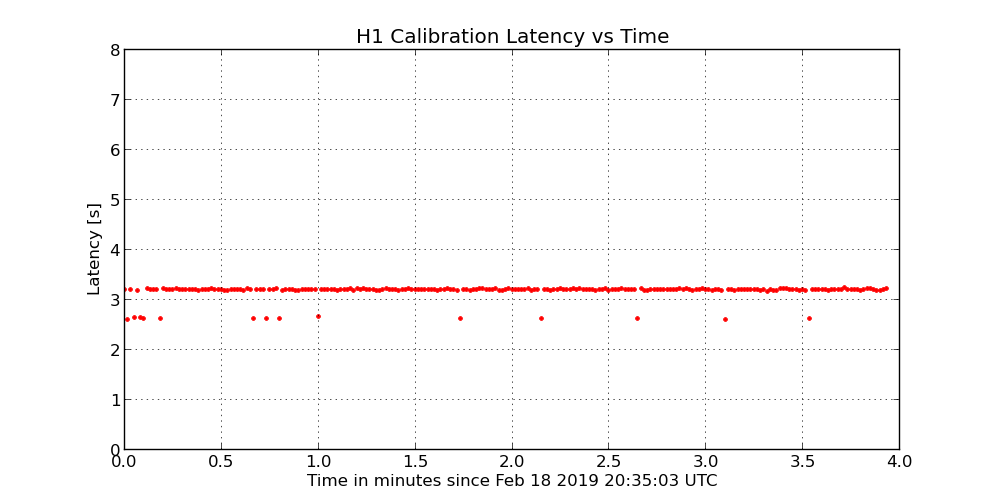
I made a new GDS filters file to be installed tomorrow during maintenance. The main change is an improvement in the high-pass filters and a reduction in latency. The actuation filters were reduced in length from 6.0s (between 2 separate filters) to 3.5s (all one filter), which in theory should reduce the latency by 2.0s. The following changes were made to the design of the high-pass filters:
The filters file is in calibration SVN revision 6577 at this location:
trunk/Runs/ER14/GDSFilters/H1GDS_1234630818.npz
It was made using the script
trunk/Runs/ER14/H1/Scripts/TDfilters/H1_run_td_filters_1234630818.sh
The parameters file used was from the 2019-01-18 model:
trunk/Runs/O3/H1/params/modelparams_H1_20190118.py
The suggested configuration files for running this on the production and testing DMTs are:
trunk/Runs/ER14/GDSFilters/H1GDS_1234630818.ini
trunk/Runs/ER14/GDSFilters/H1GDS_1234630818_TEST.ini
The attached plots are:
1-2) Bode plots of the filters
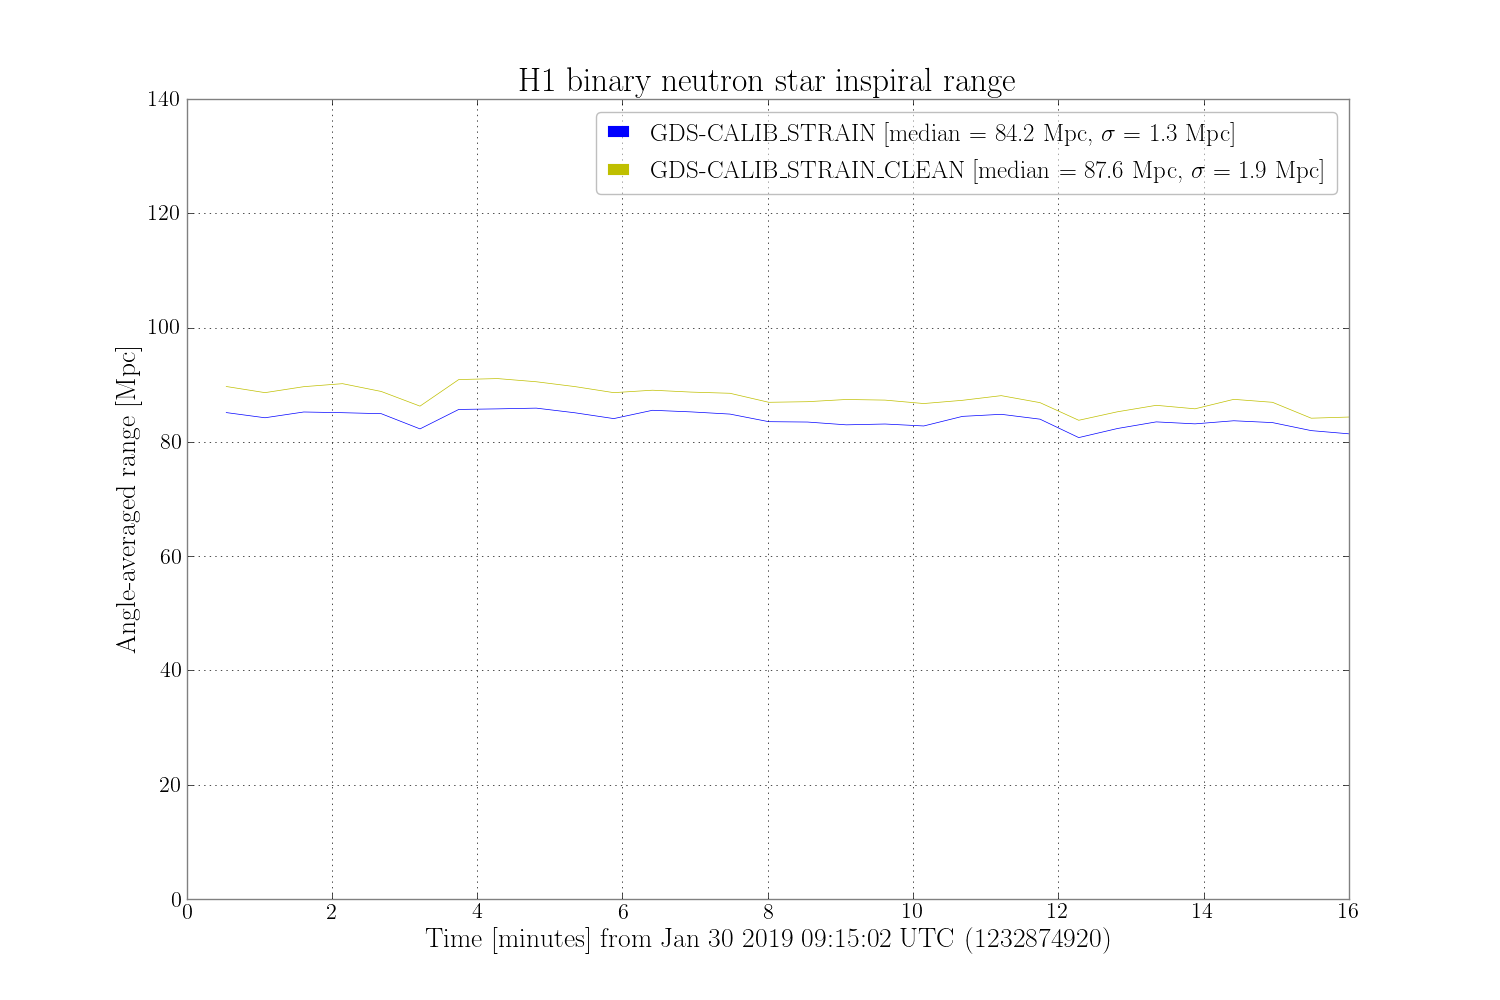
3) ASD spectrum comparisons showing GDS-CALIB_STRAIN and GDS-CALIB_STRAIN_CLEAN. Data was from 2019-01-30.
4-5) Comparisons of the frequency-domain model for the control corrections to the actual effect of the filters on the data. Data was from 2019-01-30.
6-7) Comparisons of the frequency-domain model for the residual corrections to the actual effect of the filters on the data. Data was from 2019-01-30.
8-9) Comparisons of the frequency-domain model for the response function and GDS-CALIB_STRAIN / DARM_ERR. Data was from 2019-01-30. Note the significant discrepancies. One possible contributor is the fact that the front-end may not have been using this reference model during the time this data was taken from. It is likely there are problems with the GDS correction filters as well.
10) A plot of the latency of the pipeline when reading from shared memory on ldas-pcdev1.ligo-wa.caltech.edu for ~4 minutes of data taken earlier today. This does not include the 1.0s length of the frames.
[Sheila, Jenne]
Xarm's green transmission was looking glitchy, similar to how it looked last week. So, I toggled its noise eater, and it seems to be okay for now.
This lock lasted more than 20 hours.
A bruco scan is available here. There is a lot of coherence with the ETMX L1 FASTIMON channels, which are just seeing DARM, which I've now added to the excluded channels list. Other than that we have a few things of interest:
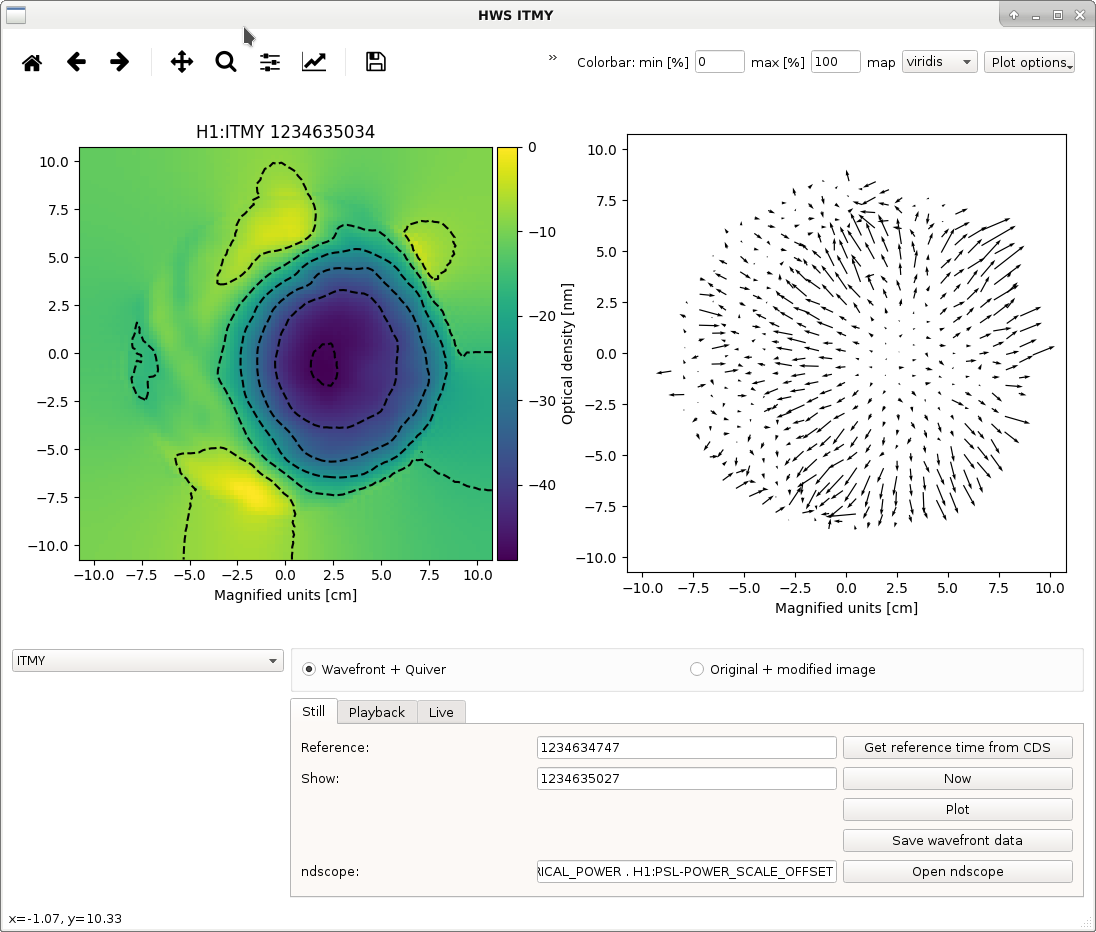
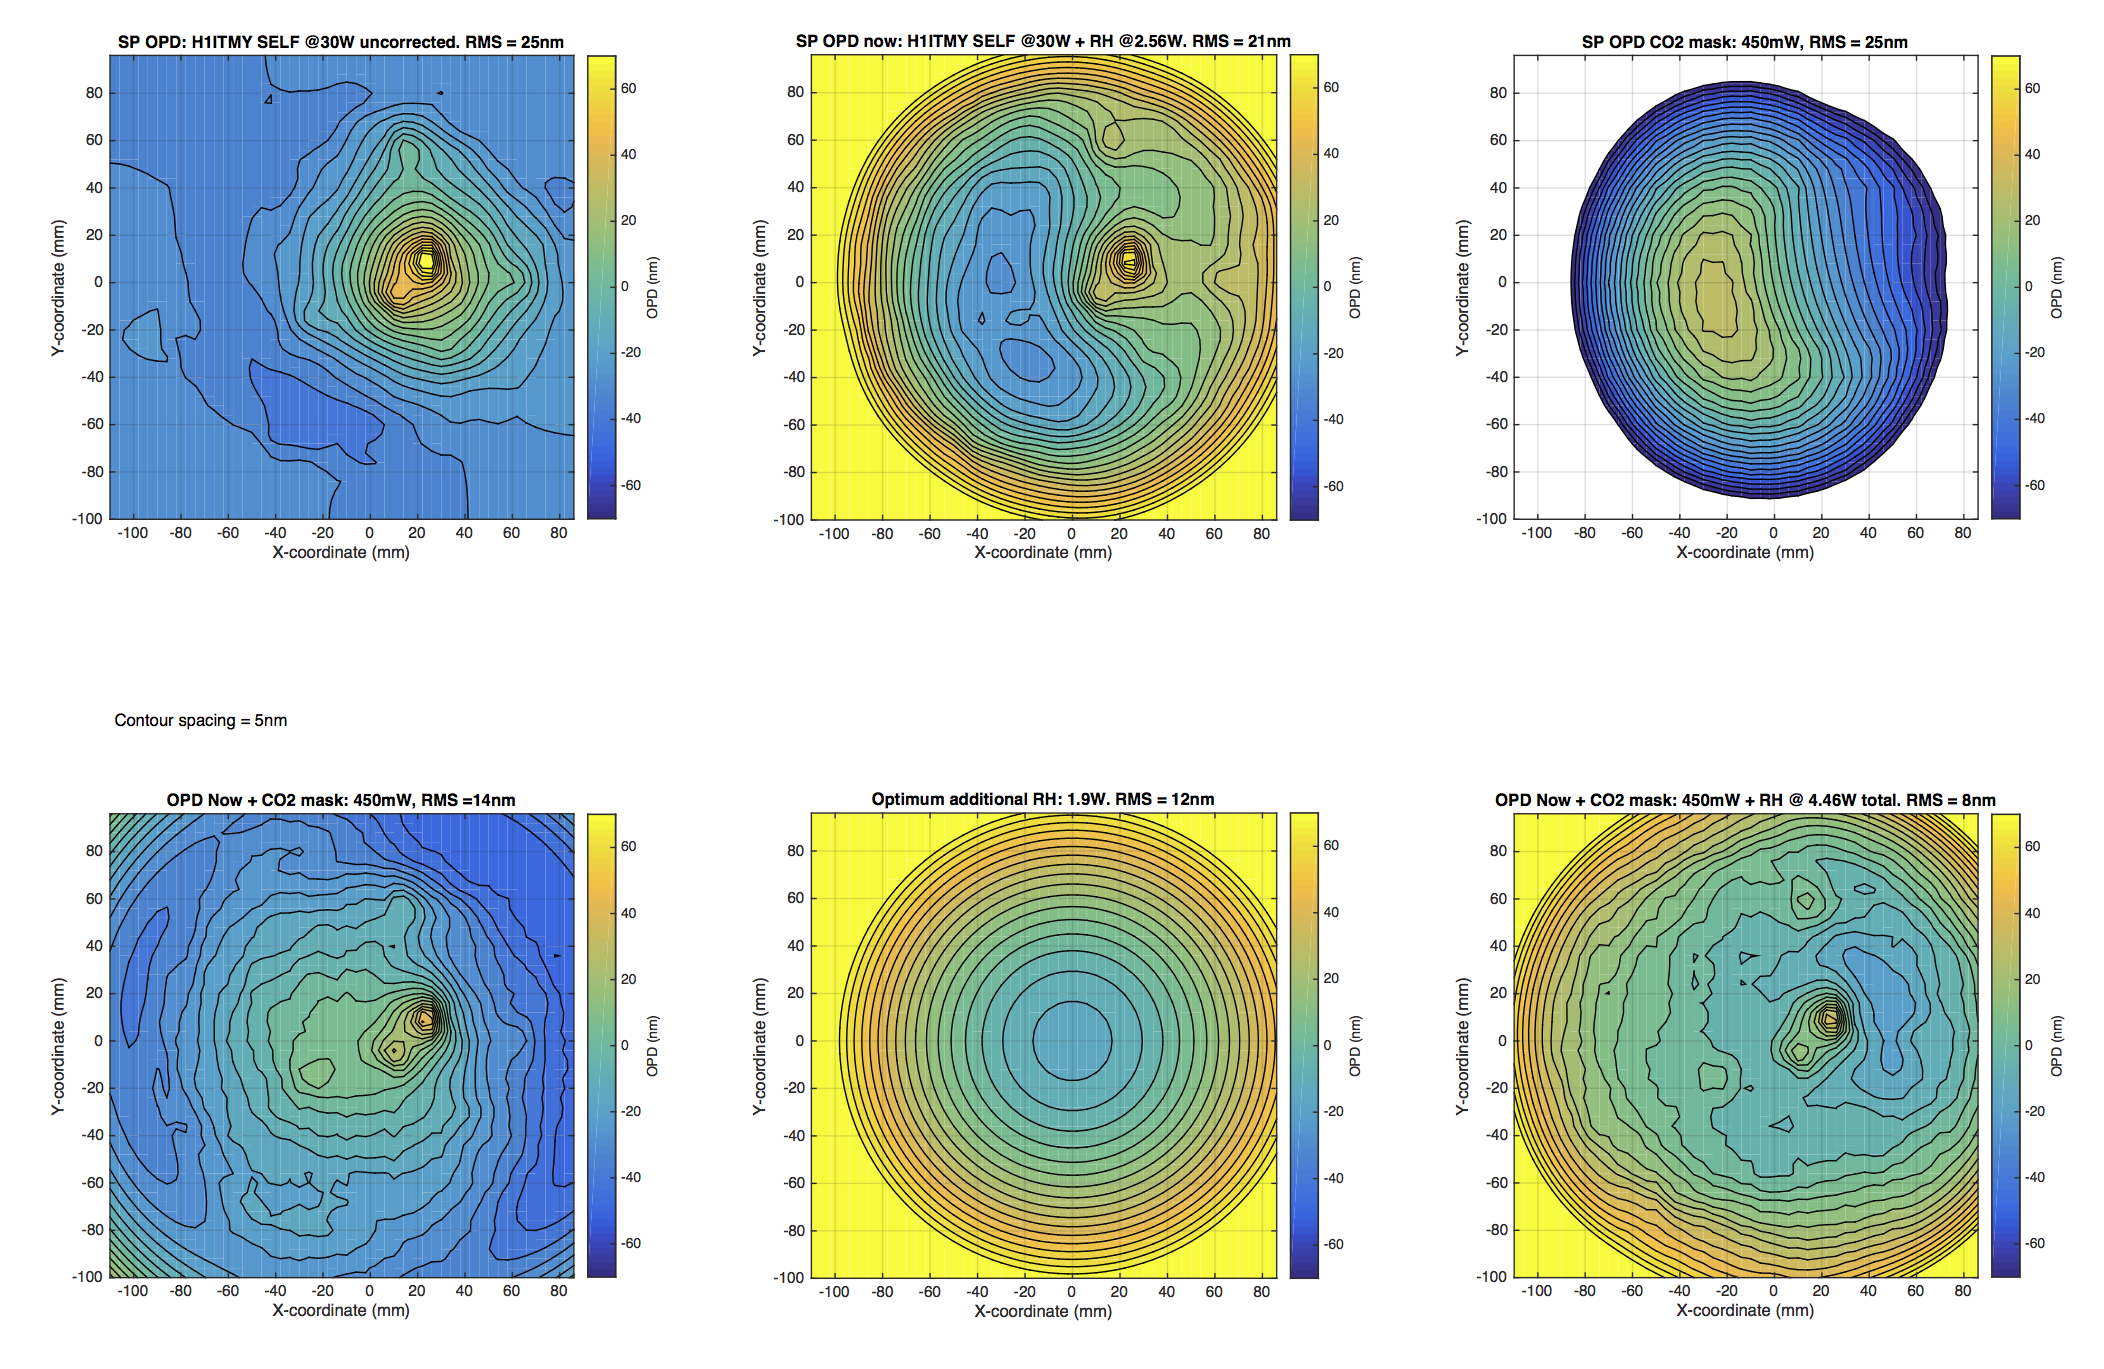
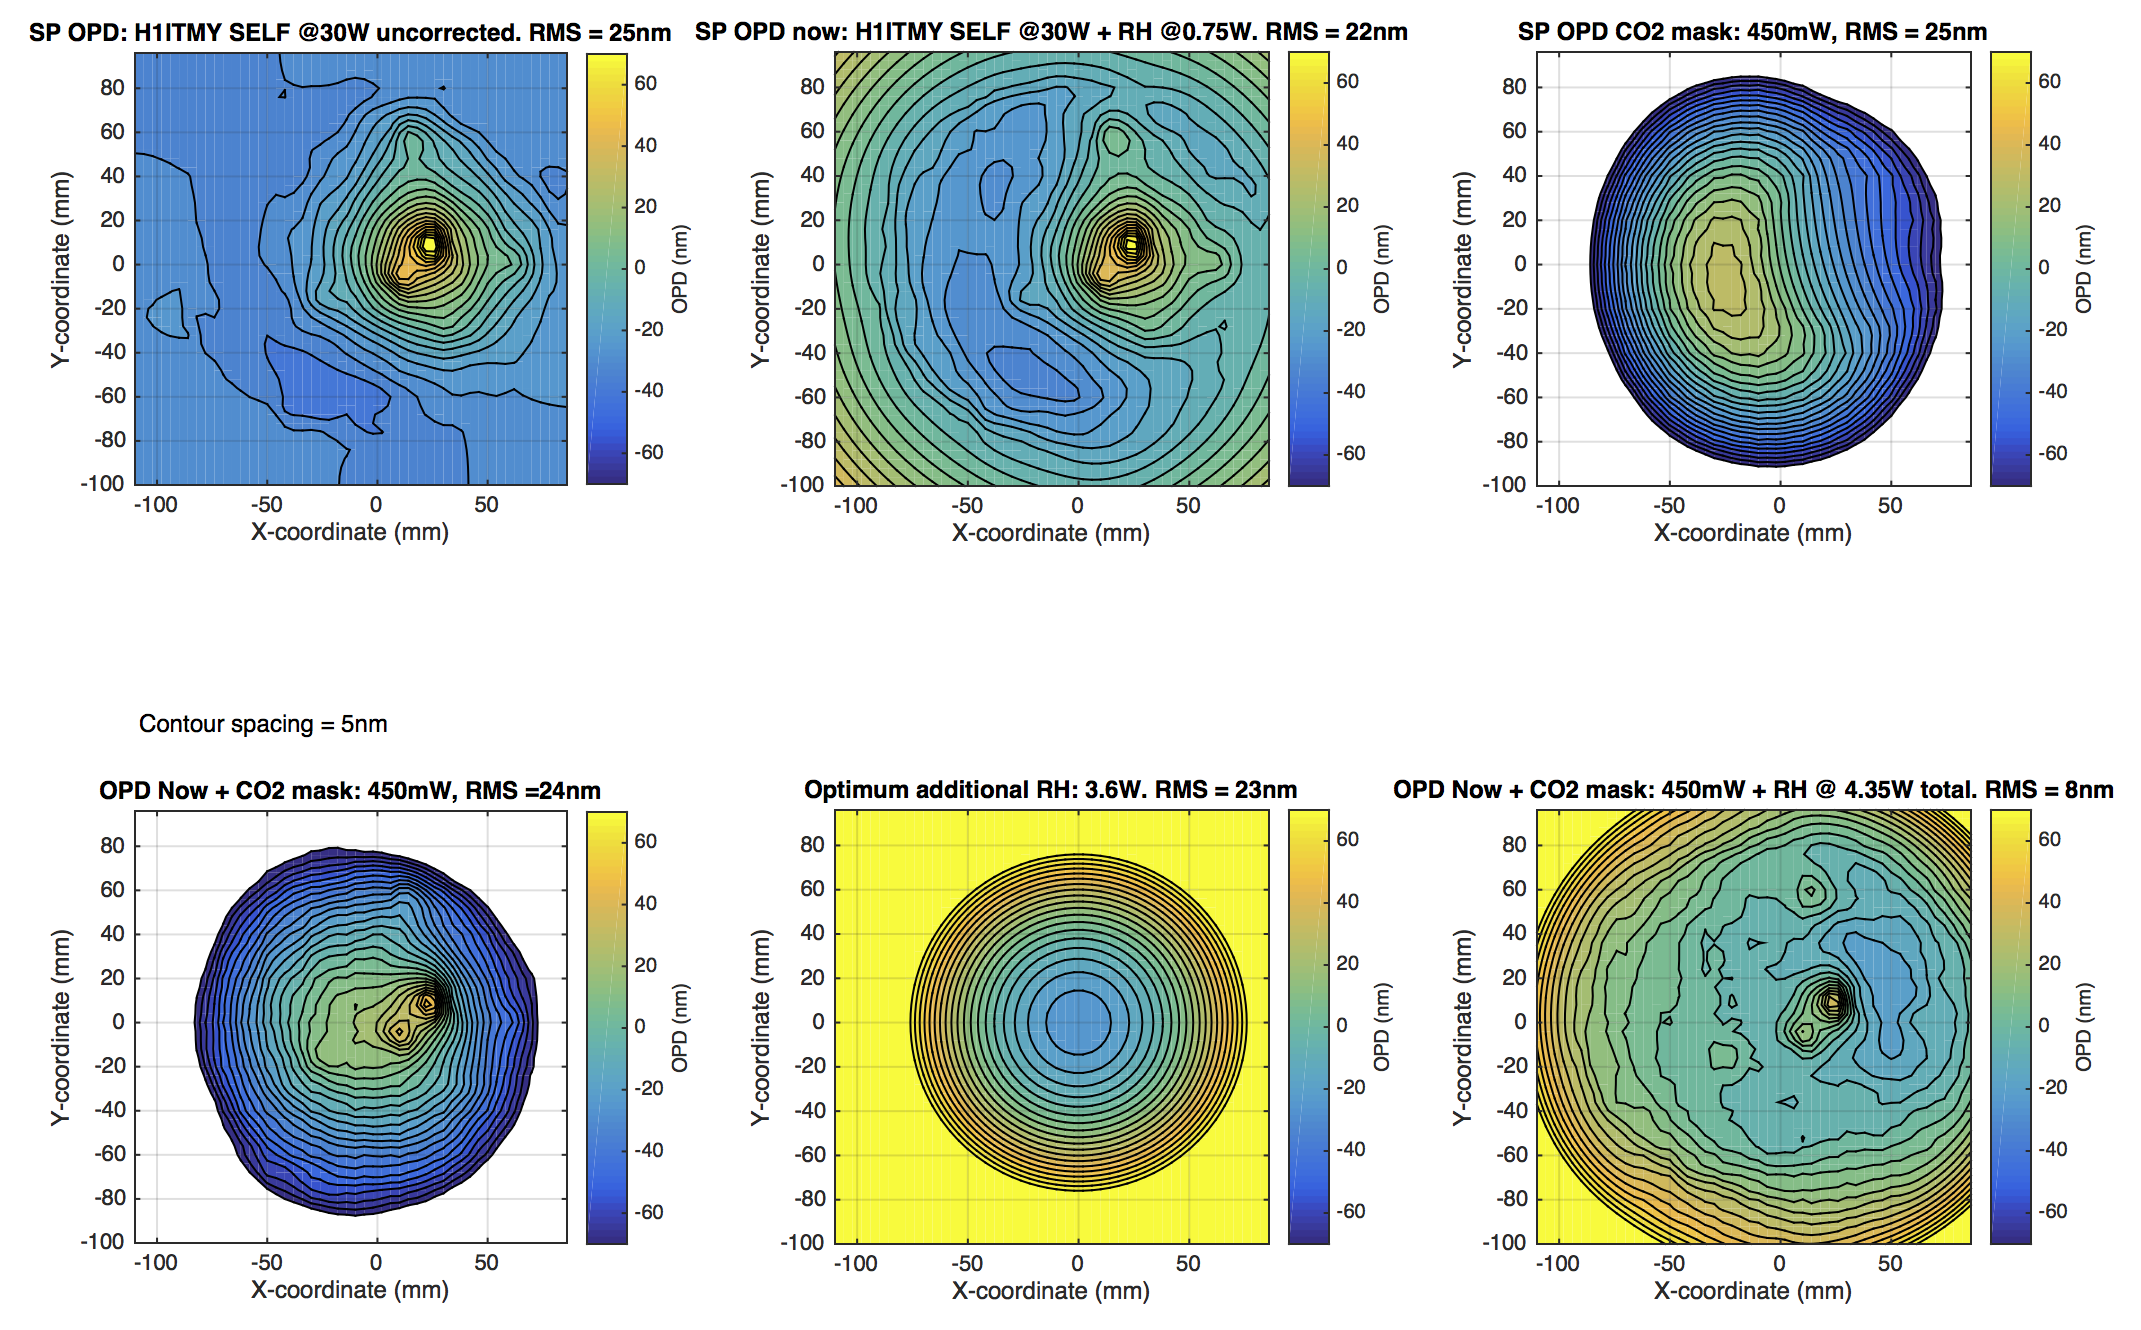
The following is a short summary of an approach to commissioning the H1 ITMY CO2 mask, D1900030. The purpose of the mask is to reduce the scattering of sidebands into higher order spatial modes. However, when the mask is simply applied by itself, it creates a strong positive quadratic lens. A combination of the ITMY RH, ITMX CO2 central heating and ITMX RH must be used to minimize the overall effect of the COMMON & DIFFERENTIAL MICH lenses and the COMMON and DIFFERENTIAL ITM curvatures.
The application of the mask is illustrated in the attached PDFs. An example of the application is shown here:
Note that (a) the color scales have been set to the same level [-70, 70]nm for comparison between different plots [so there is some saturation in some of the plots], (b) contours are set to 5nm spacing in all plots, (c) DC levels have been subtracted from each image so that the Gaussian weighted mean value is 0nm.

Once this step has been applied, the ITMY substrate lens should be same as it currently is. This will maintain the COMMON and DIFFERENTIAL MICH lenses. However, the application of ITMY RH will change the ITMY ROC and, hence, the COMMON and DIFF ITM ROC will need to be corrected. Which will be dealt with in step 2.
The attached PDFs show the effect for differing CO2 powers ranging from 50mW to 750mW. The minimum RMS OPD is achieved around 450mW.
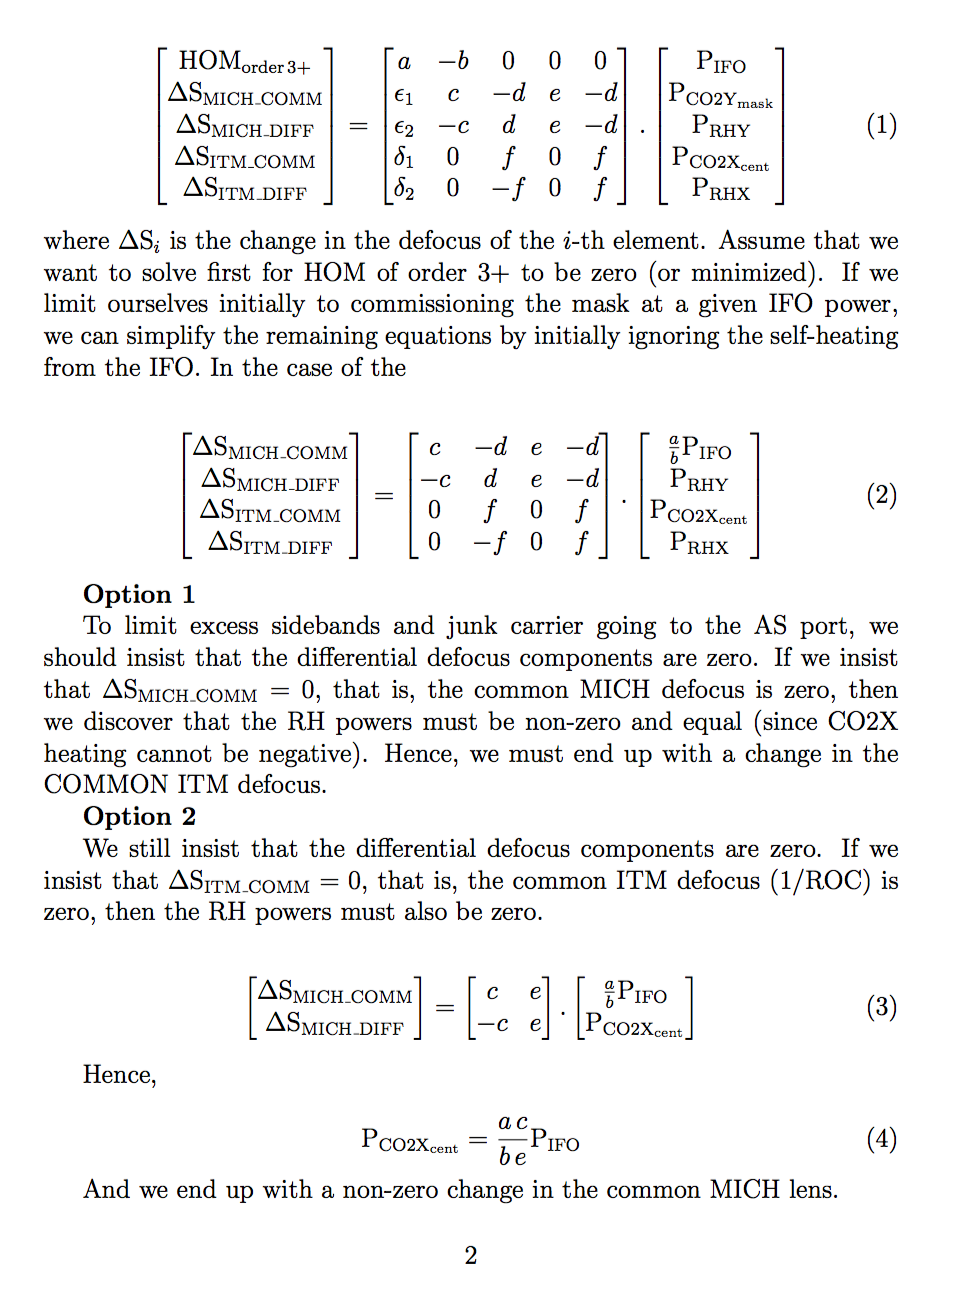
Working on the full matrix description of this: 4 TCS actuators > 4 DOF (COMM/DIFF MICH, COMM/DIFF ITM ROC).
Somewhat crude matrix analysis of actuation strategies. The effect of interferometer power and the CO2 mask can be seen below. Any actuation strategy that employs this mask will enforce a change in either the COMMON ITM ROC/DEFOCUS and/or the COMMON MICH DEFOCUS.

I'm working on plotting the time evolution of the RMS value of the OPD once the mask is added. However, as a rough guide (based on (a) some provisional simulations, (b) basic thermal diffusivity calculations), the thermal time constant of the mask is approximately 40 minutes. This means that the majority of the effect the mask should manifest on this time scale.
Note: this excludes the time constant associated with the RH
I just discovered that the code used to generate the wavefronts was using the ITMX RH power (~0.78W) rather than the ITMY RH (~2.56W). I'll need to regenerate these plots with the correct RH power.
Here is the updated mask application based on 2.56W into ITMY RH.

TJ, TVo, Danny
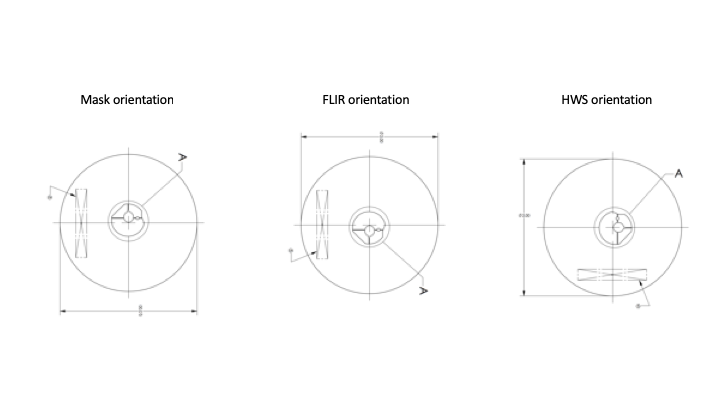
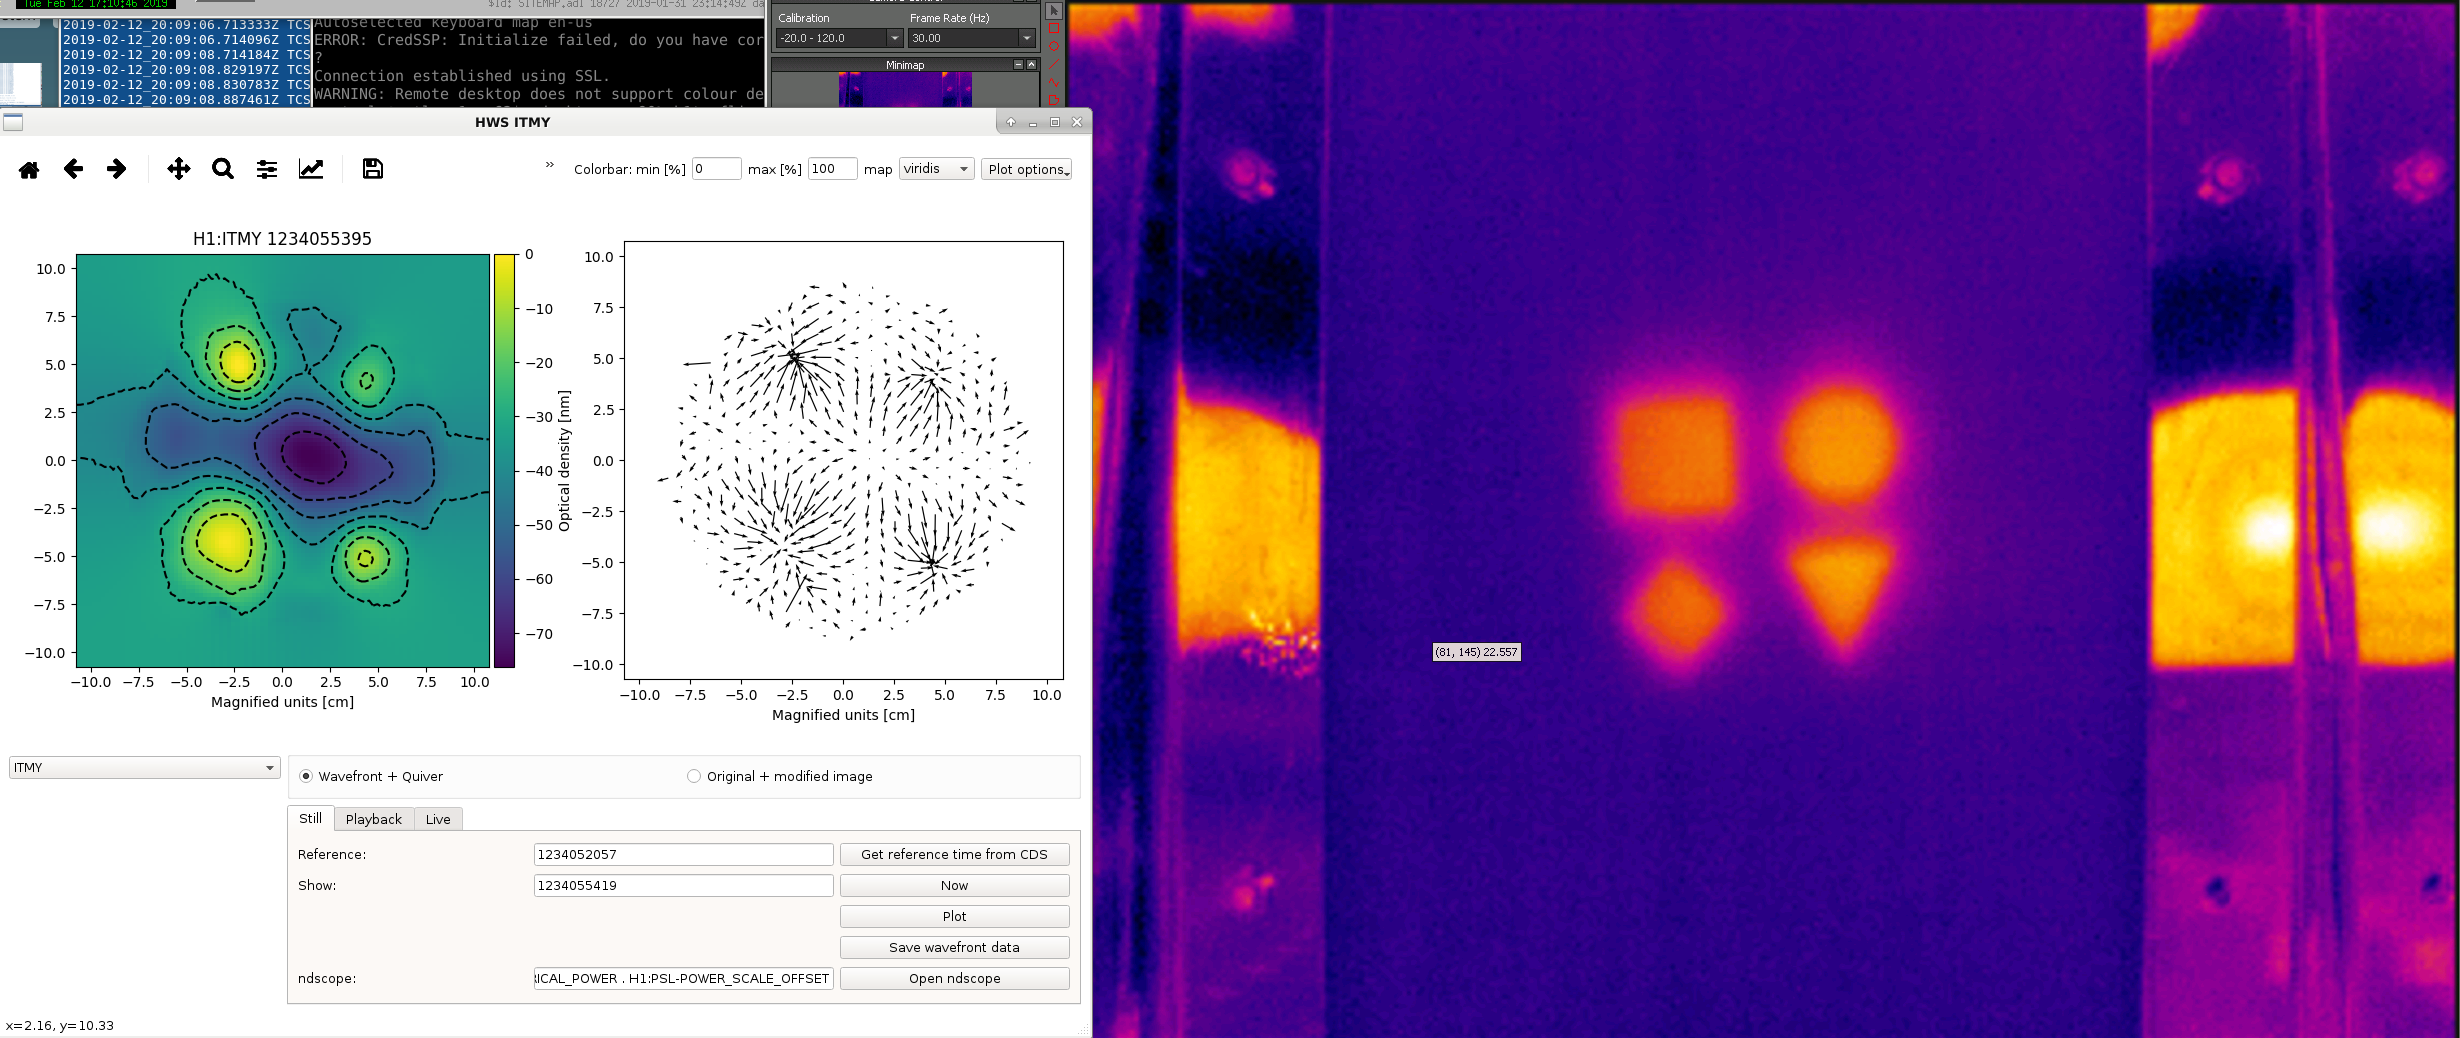
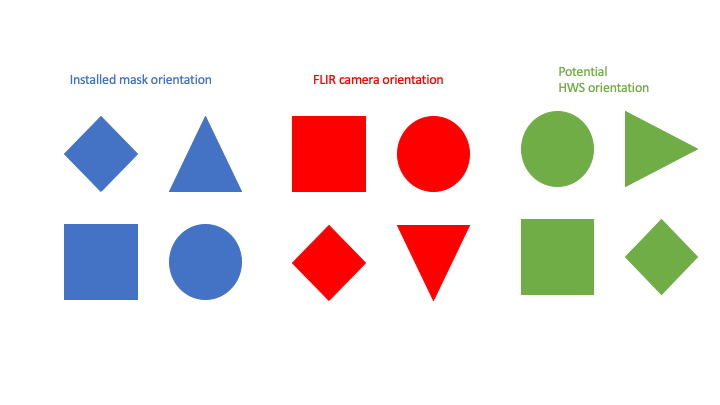
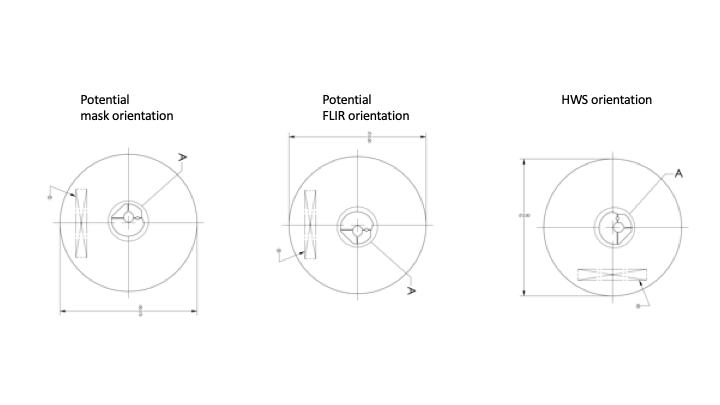
| Poker mask | FLIR | HWS |
|---|---|---|
| Up | Down | Right |
| Left | Left | Down |
| Down | Up | Left |
| Right | Right |
Up |
I had a look at the data from yesterday. I had expected to see features as sharp as previously measured: 14714 (and reproduced here). The reality is a lot more thermal diffusion of the features over the time-scale of the measurement. Using a shorter time-scale turns out not to work because the SNR of the HWS isn't large enough on the scale of the measurement
There are two possible fixes to this:

Ideally, we'd compare HWS measurements after one or two minutes rather than 60 to see the poker mask.
I tried adding the poker heat load map to a compensation plate in COMSOL to see what the induced optical depth change might be like. First plot shows the steady state solution for OPD, second the heat map I applied to the surface, scaling of OPD will be way off as I just guessed intensities. In order of OPD depth you'd probably see on the HWS largest to smallest: square, circle, triangle, diamond. So looks like your fourth plot is probably correct!
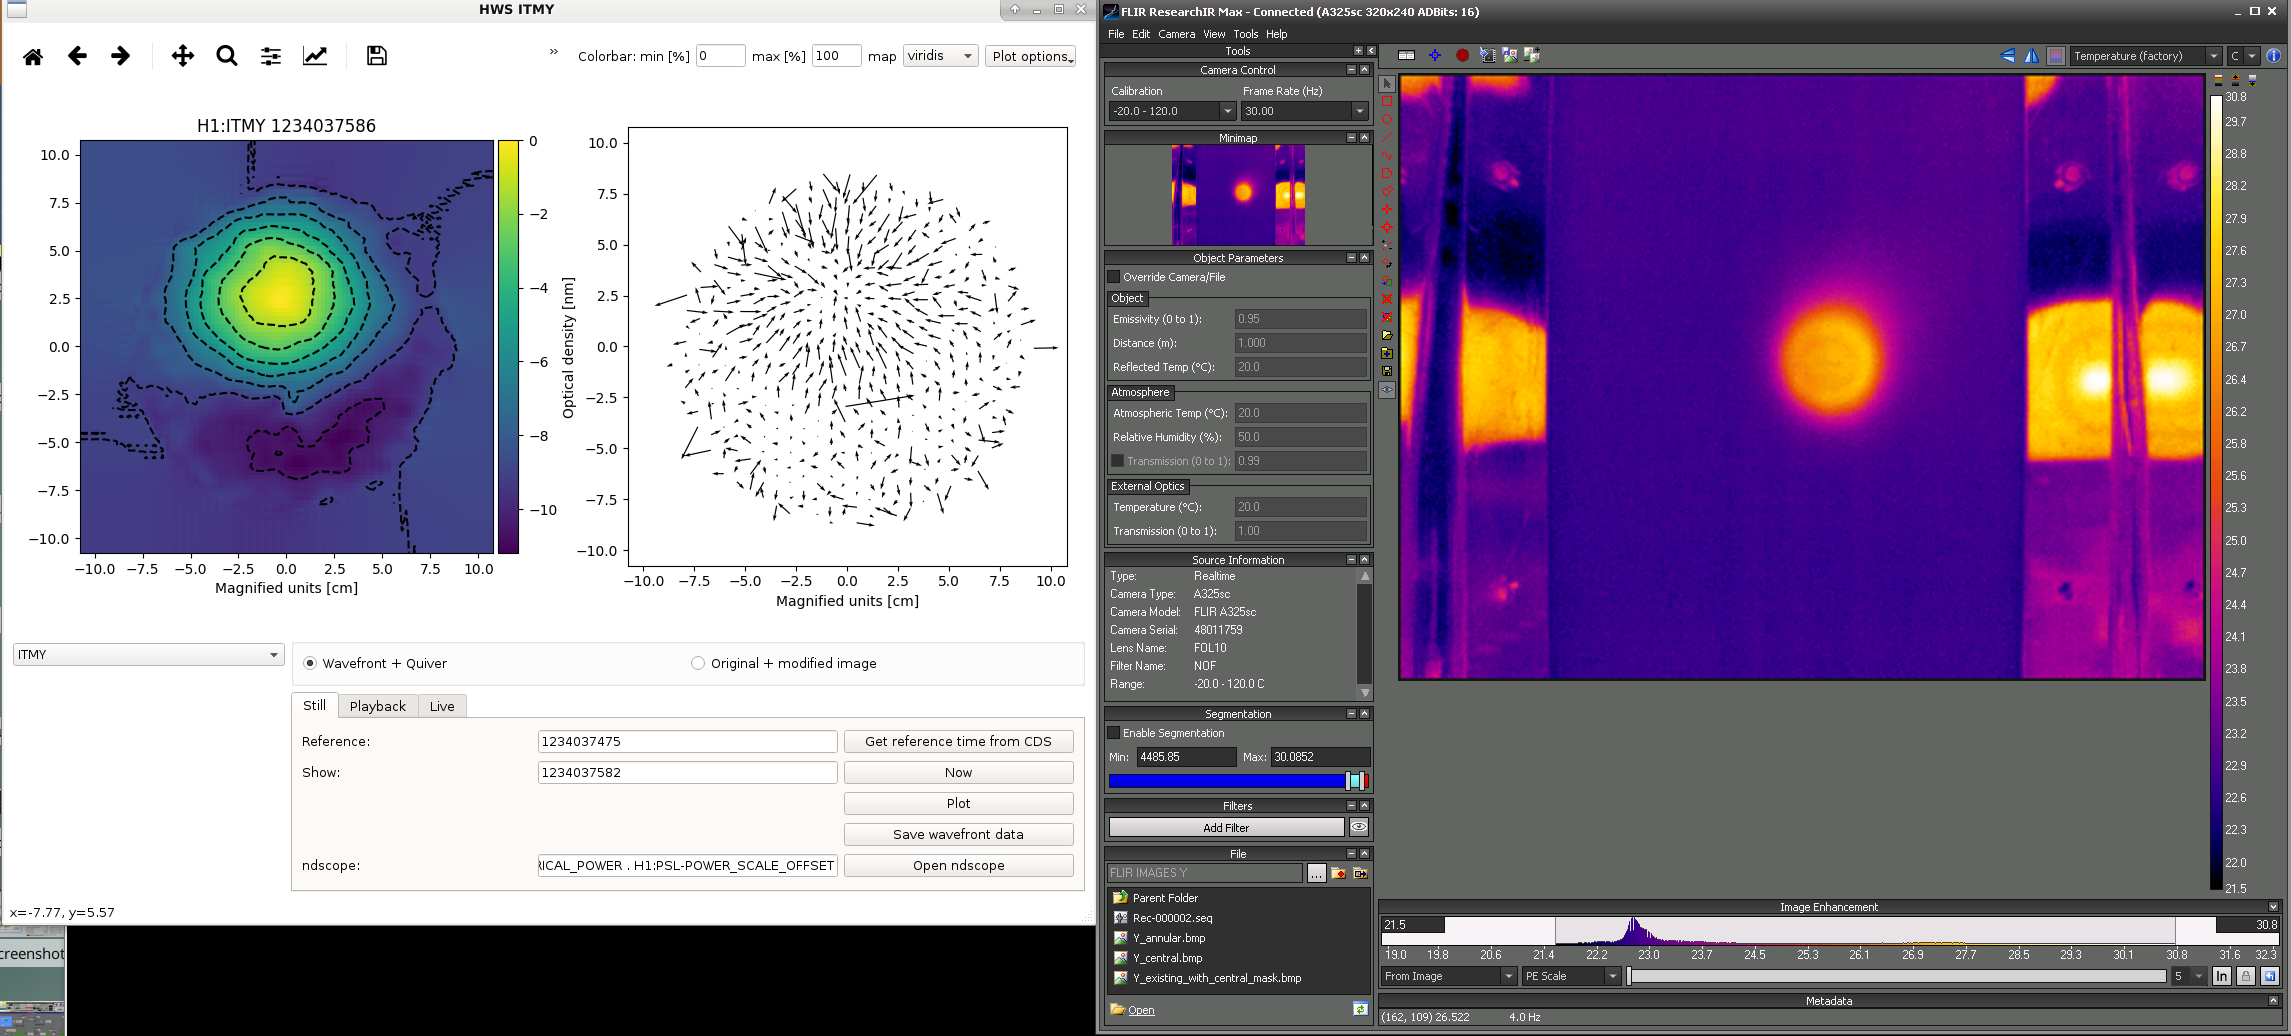
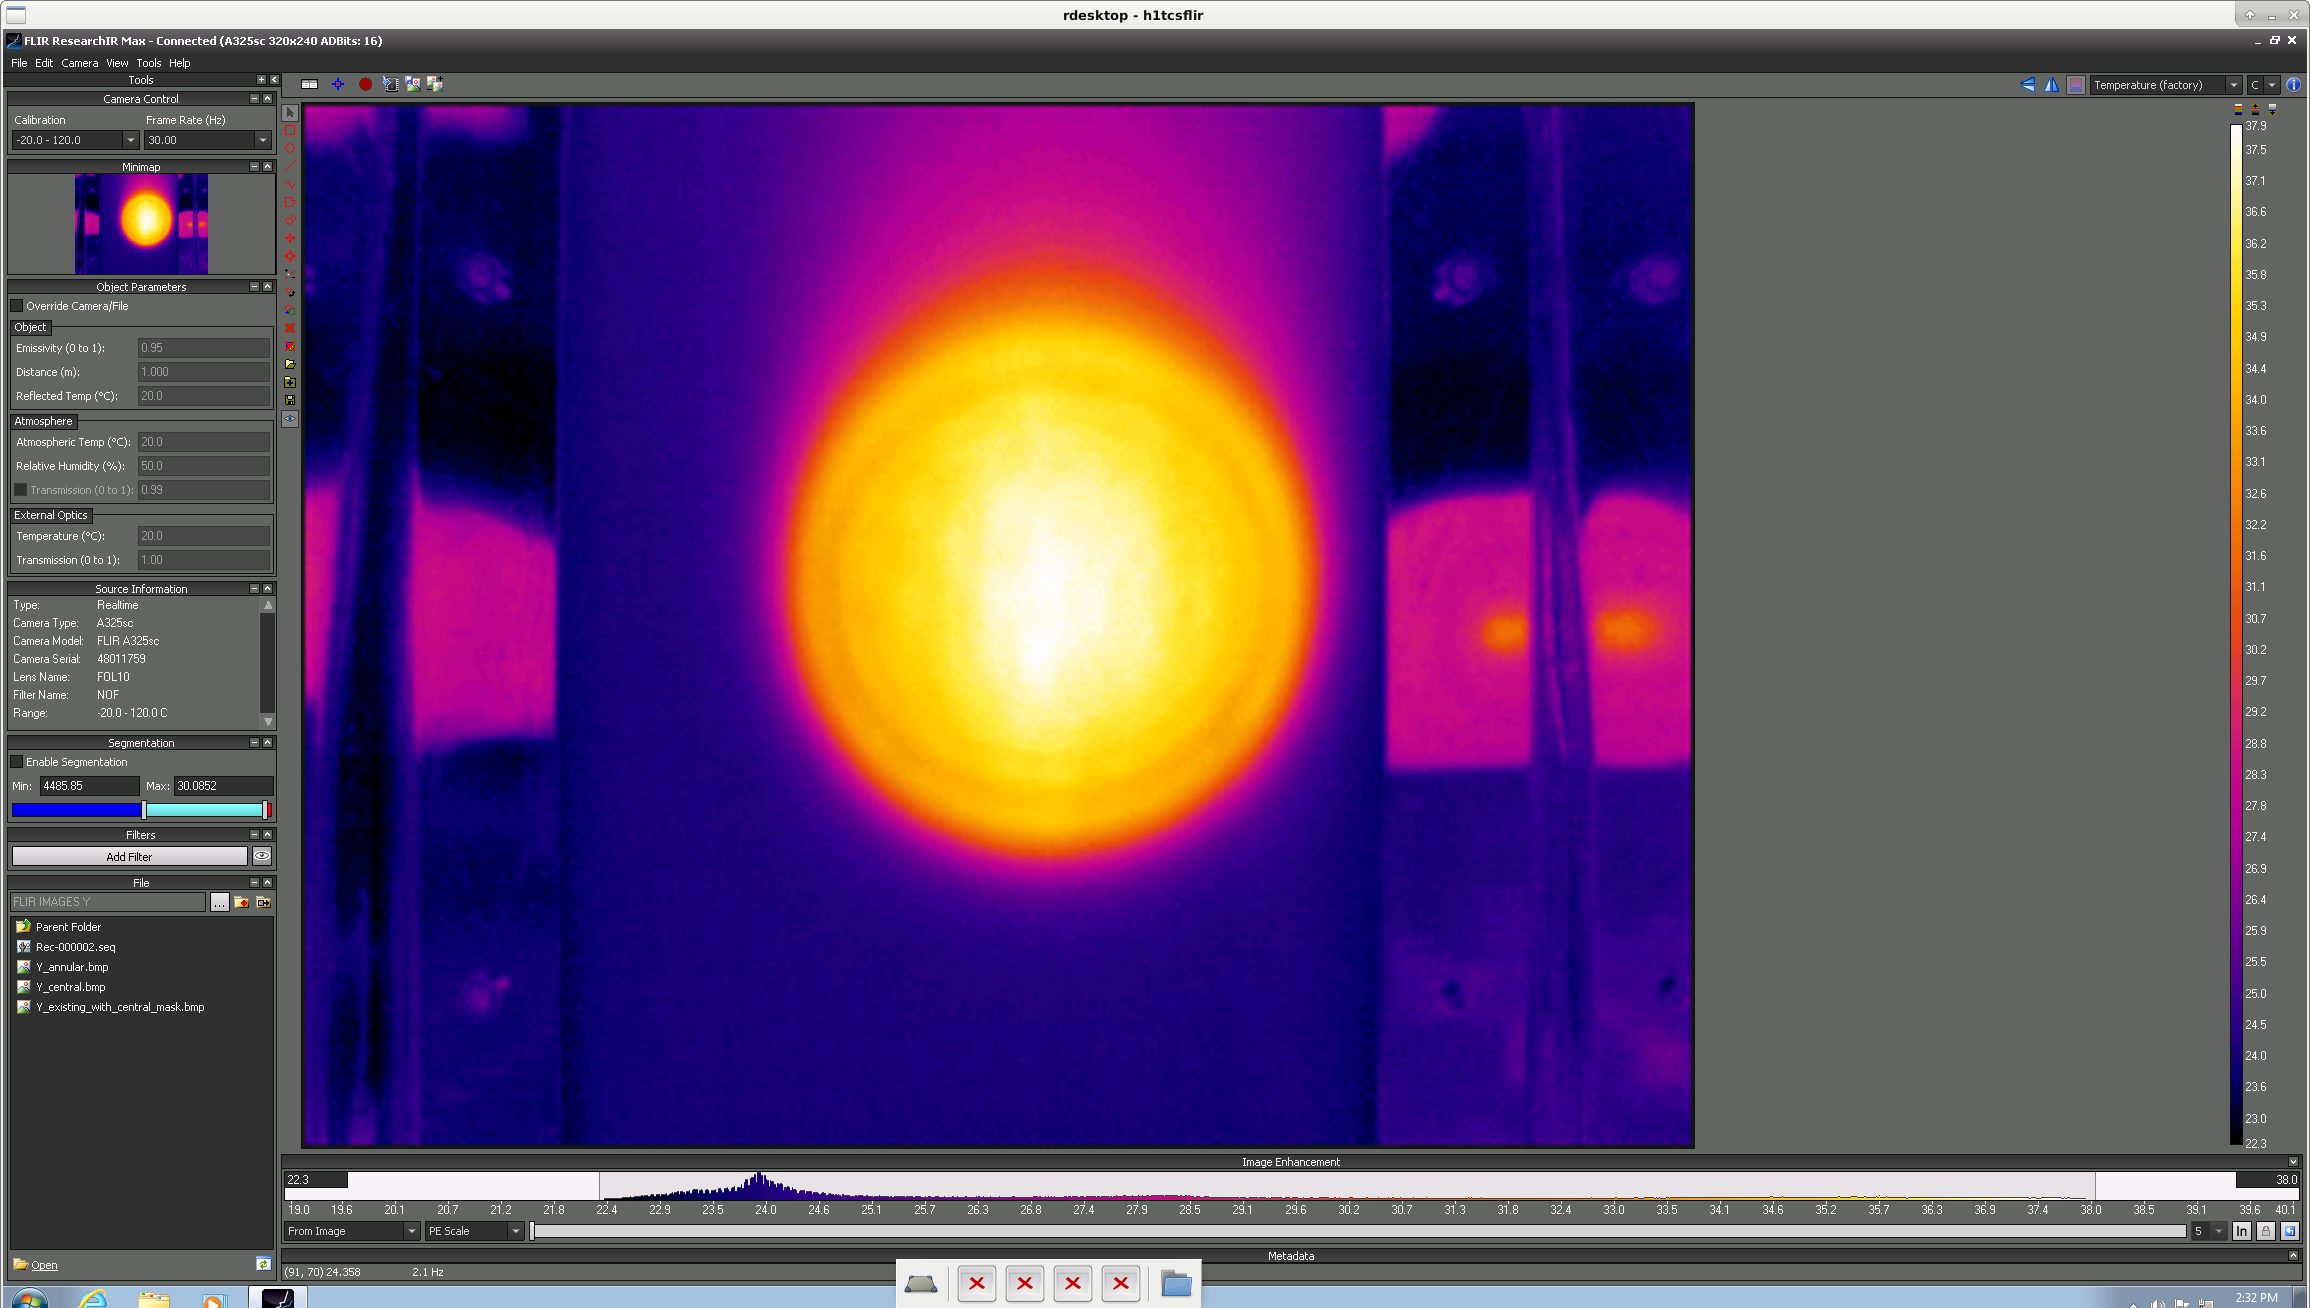
I overlaid the FLIR images of the central heating iris and the poker card. Then I found the center of the heat pattern and thermal lens of the central heating and circled that heat distribution and thermal lens on the poker card images. The upper left of the thermal lens image corresponds to the upper right of the FLIR image. Coupled with the large thermal lens in the lower left of the thermal lens image, this supports the hypothesis that the HWS image is the FLIR image rotated by 90 degrees counter-clockwise.

Correction on the fifth figure attached to this log post: The FLIR orientation and the mask orientation should be switched. Attached is a png with the correct orientations.