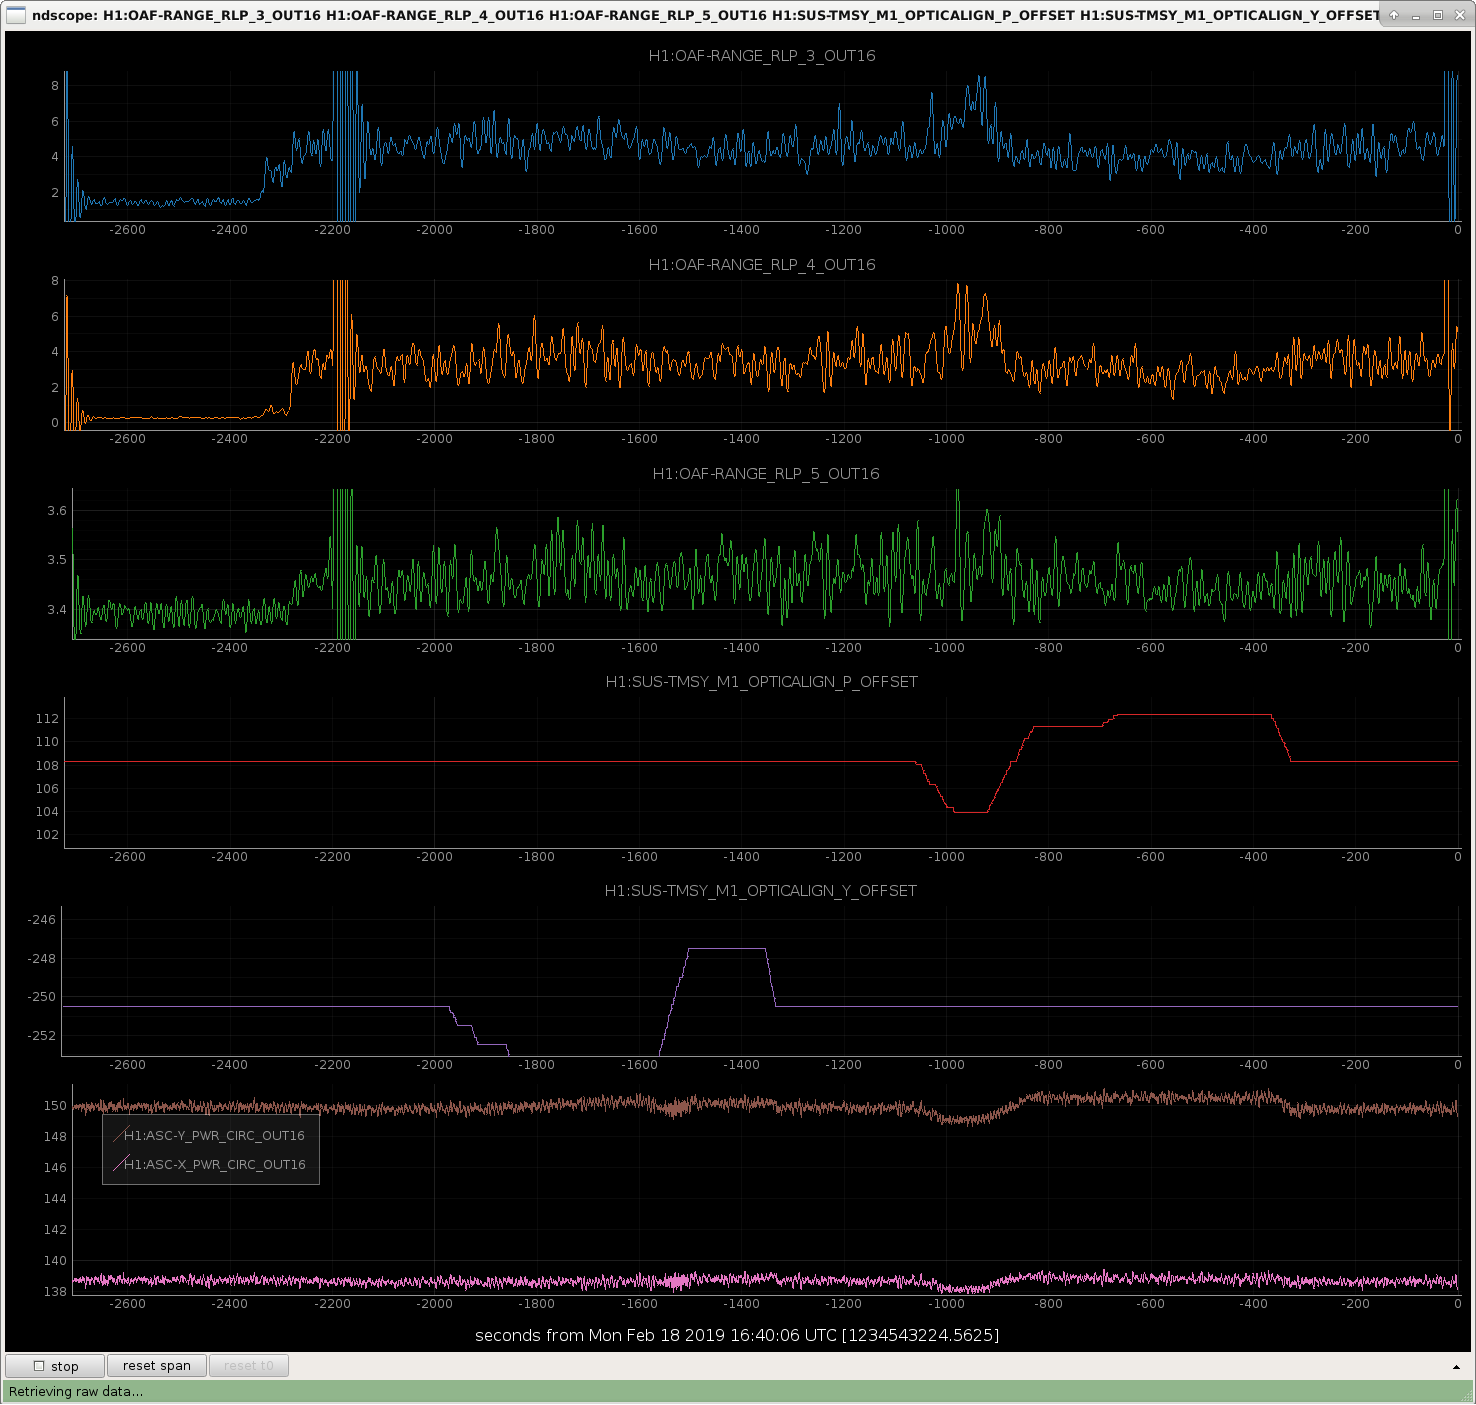
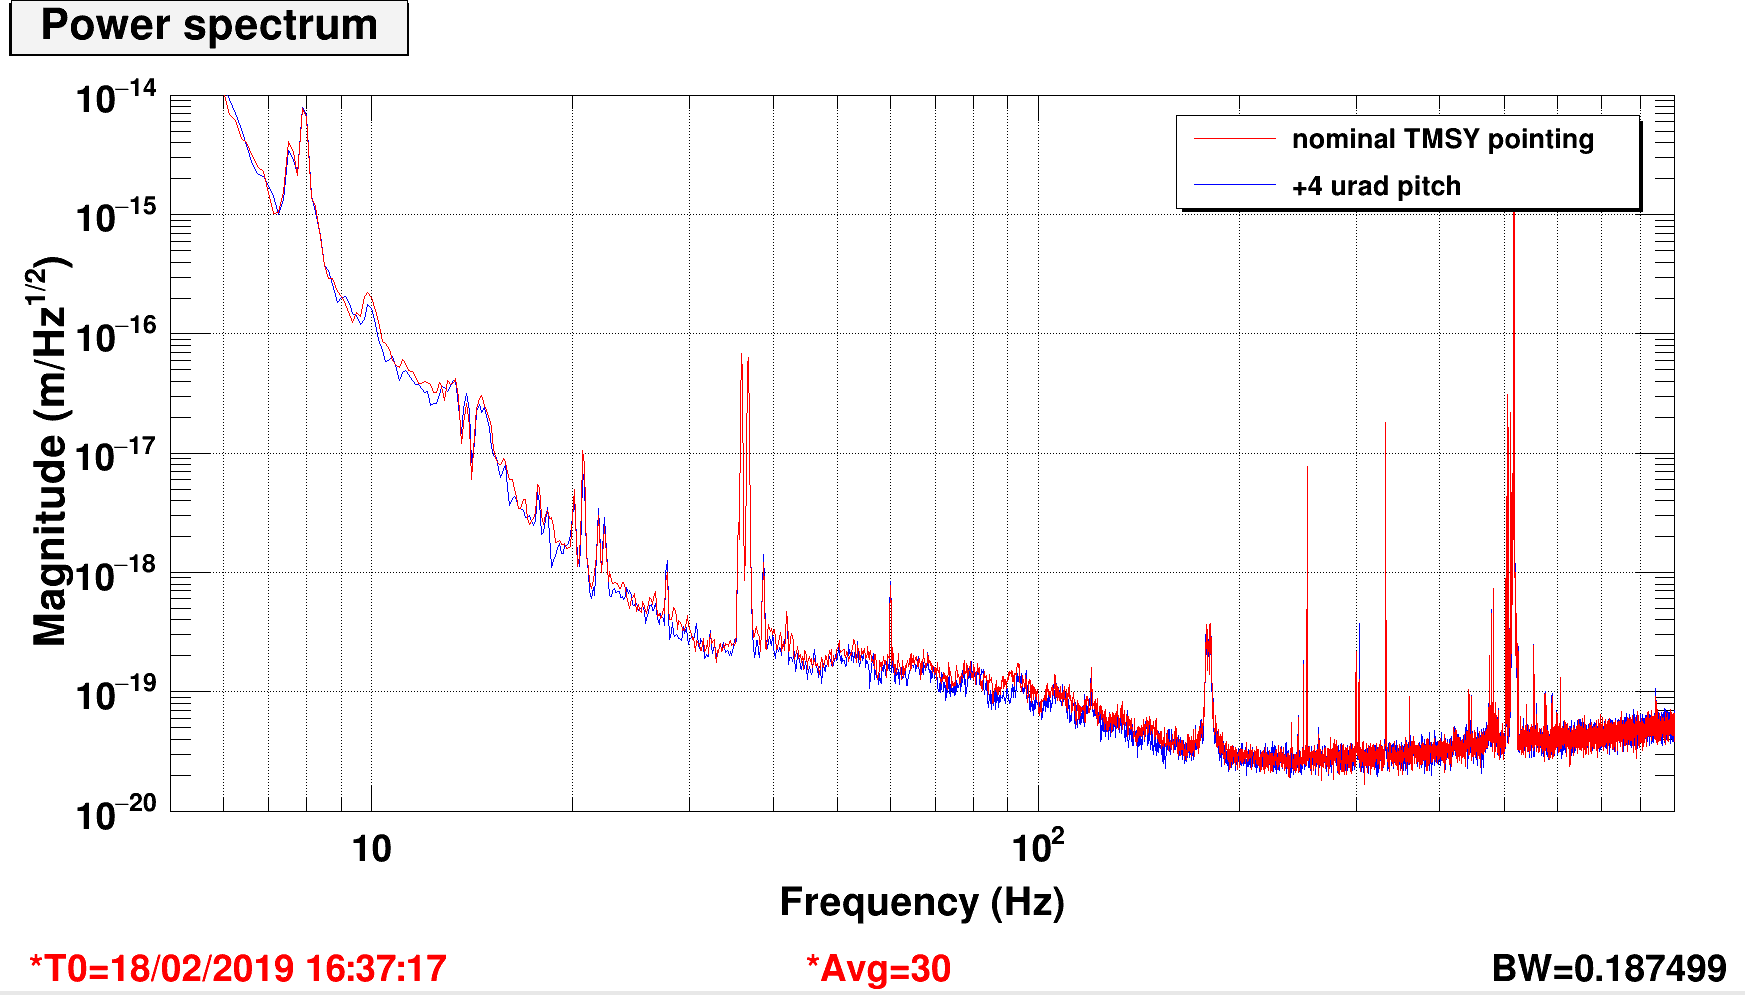
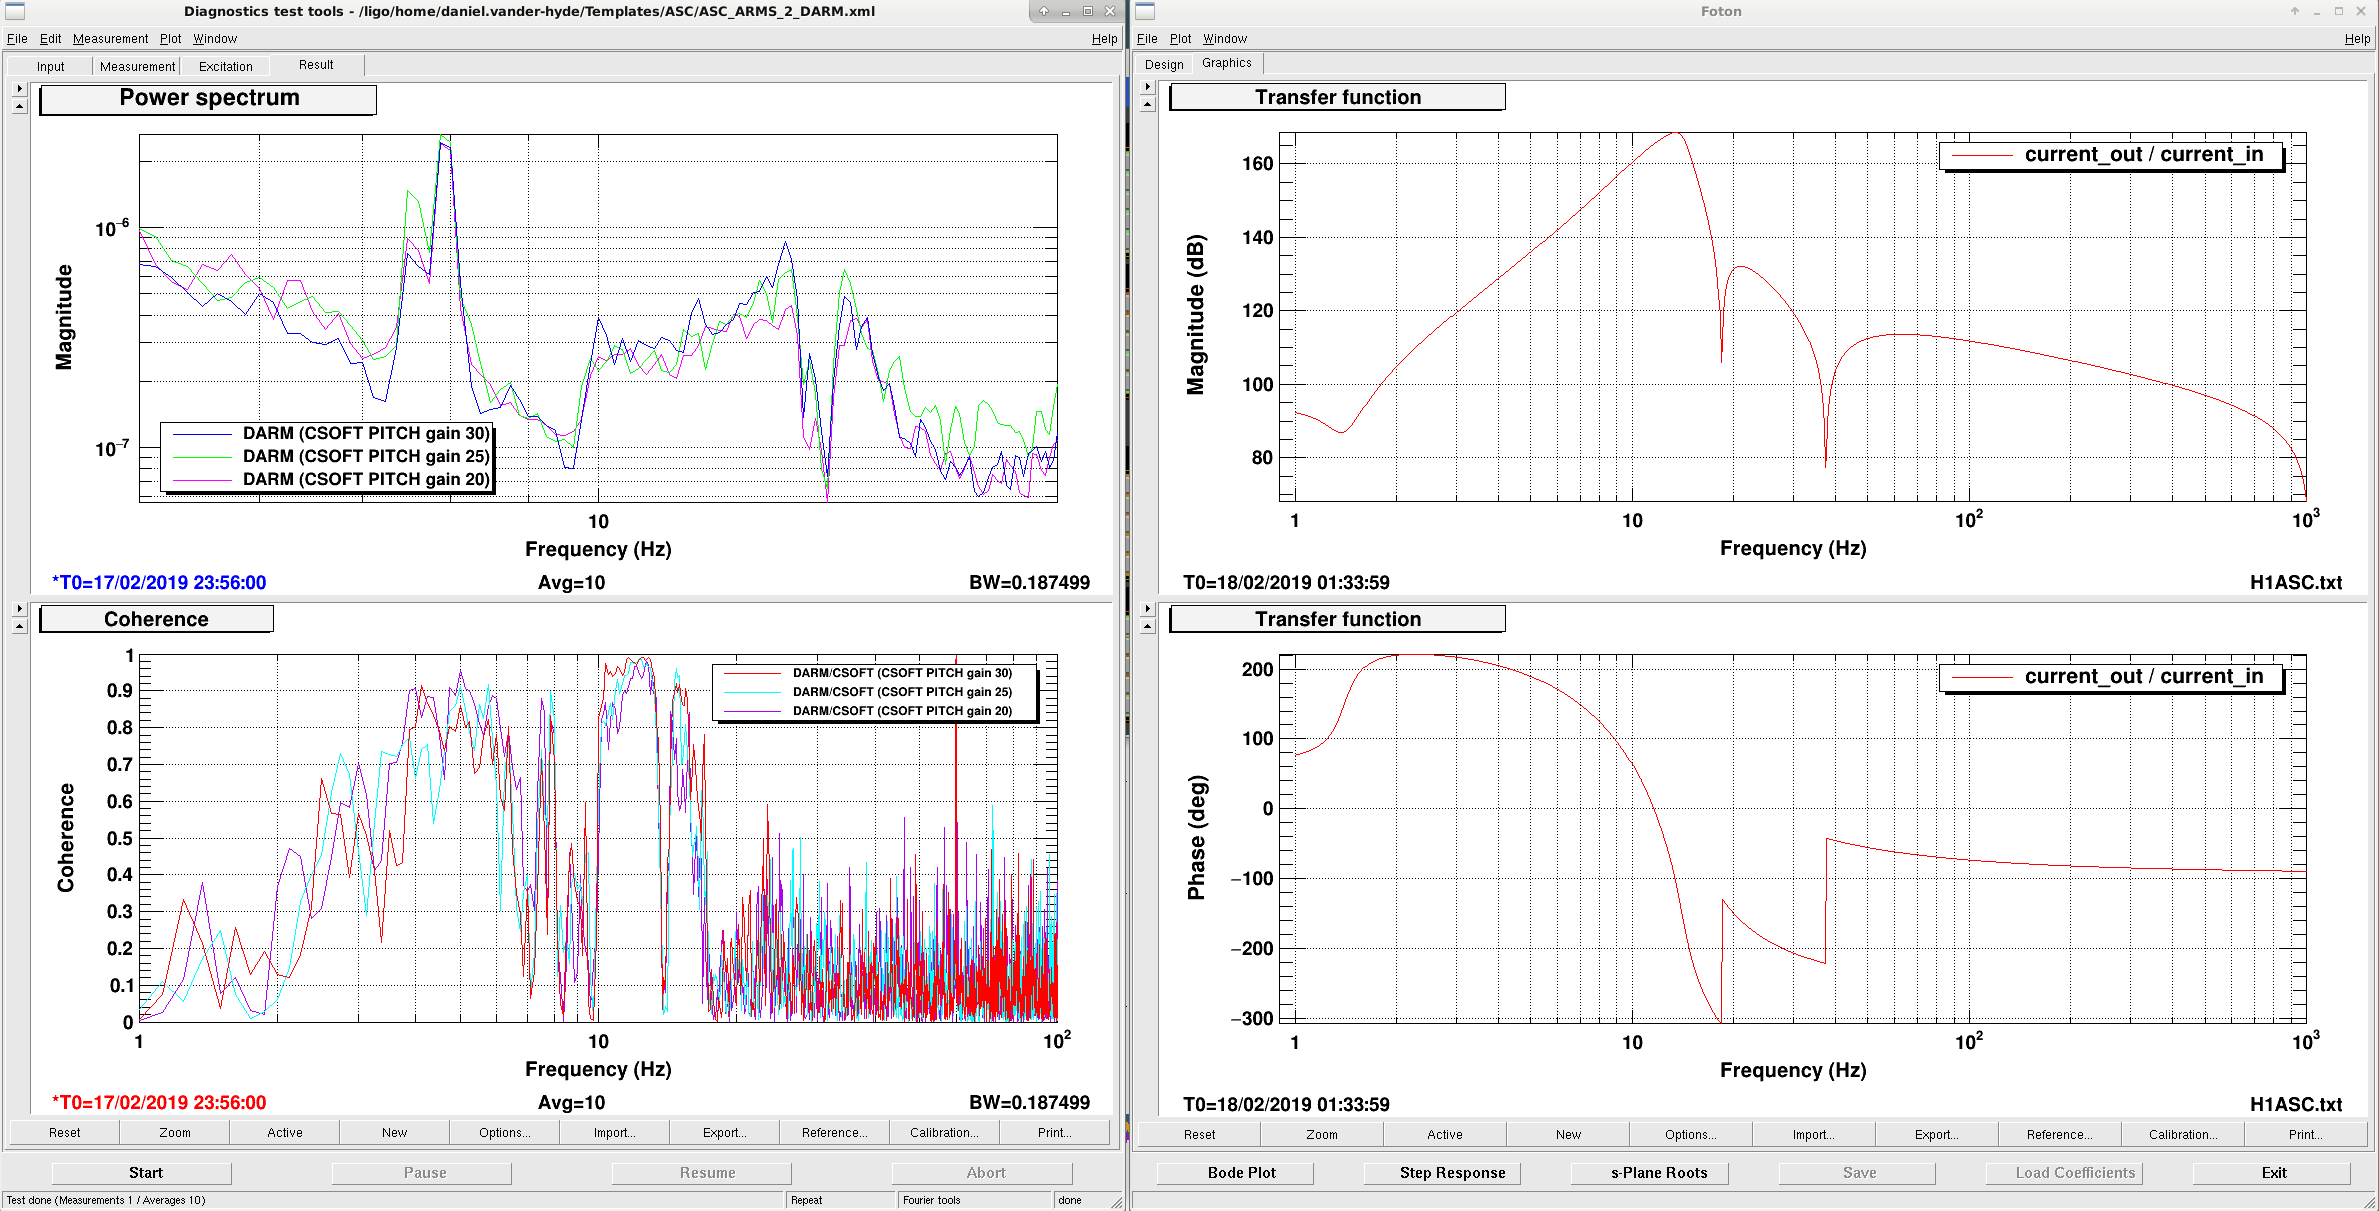
Lost lock trying to de-blend CHARD. My TMS dithers weren't giving enough velocity to make any fringe wrapping show up at frequencies that are useful, but I can't push harder since the TMS motion is causing ASC signals to move the IFO. Normally, CSOFT P, DSOFT P, as well as CHARD P and Y all use the TMS QPDs. When I was shaking TMS in length, I was seeing a lot of yaw motion on the TMS QPDs, as well as a lot of yaw motion in other ASC channels. This indicates that much of this coupling was through CHARD, since the SOFT DOFs are not using yaw right now.
Recall DARM BLRMS 3 looks at 38 Hz - 60 Hz. DARM BLRMS 4 looks at 60 Hz - 100 Hz. DARM BLRMD 5 looks at 100 Hz - 450 Hz.
The OMC camera seems to have frozen sometime last week. We've tried resetting it and restarting the service, but that hasn't worked.
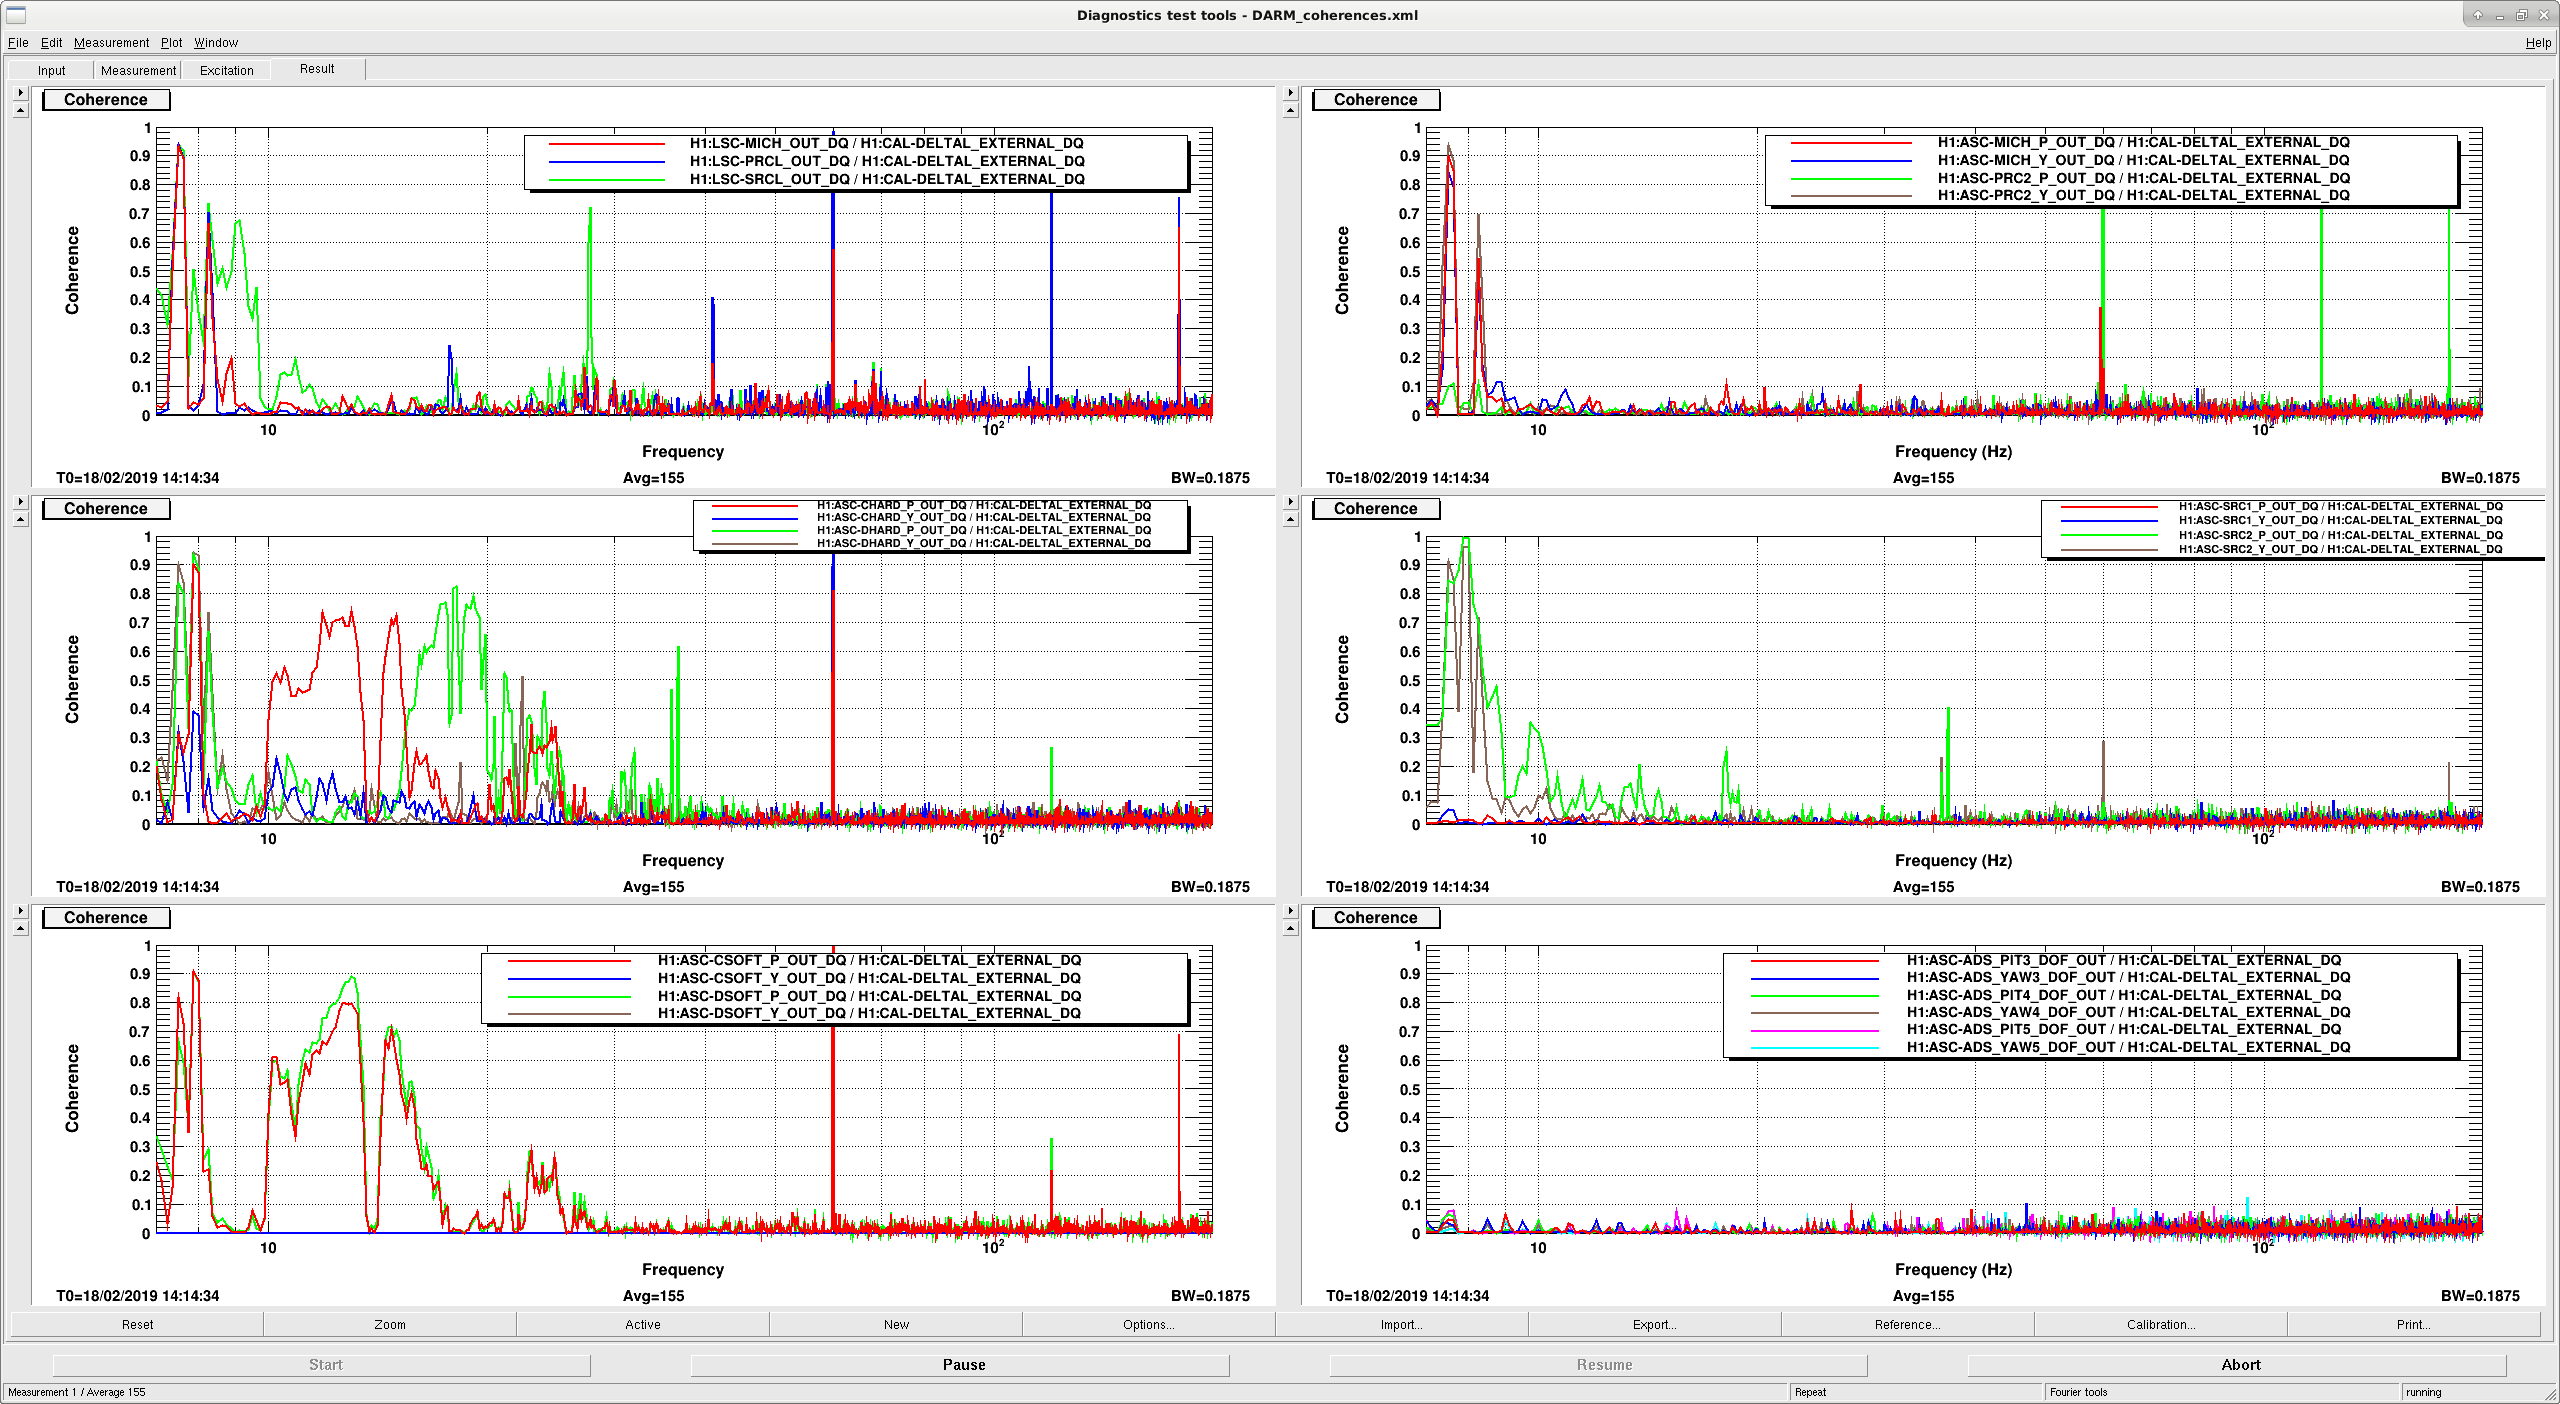
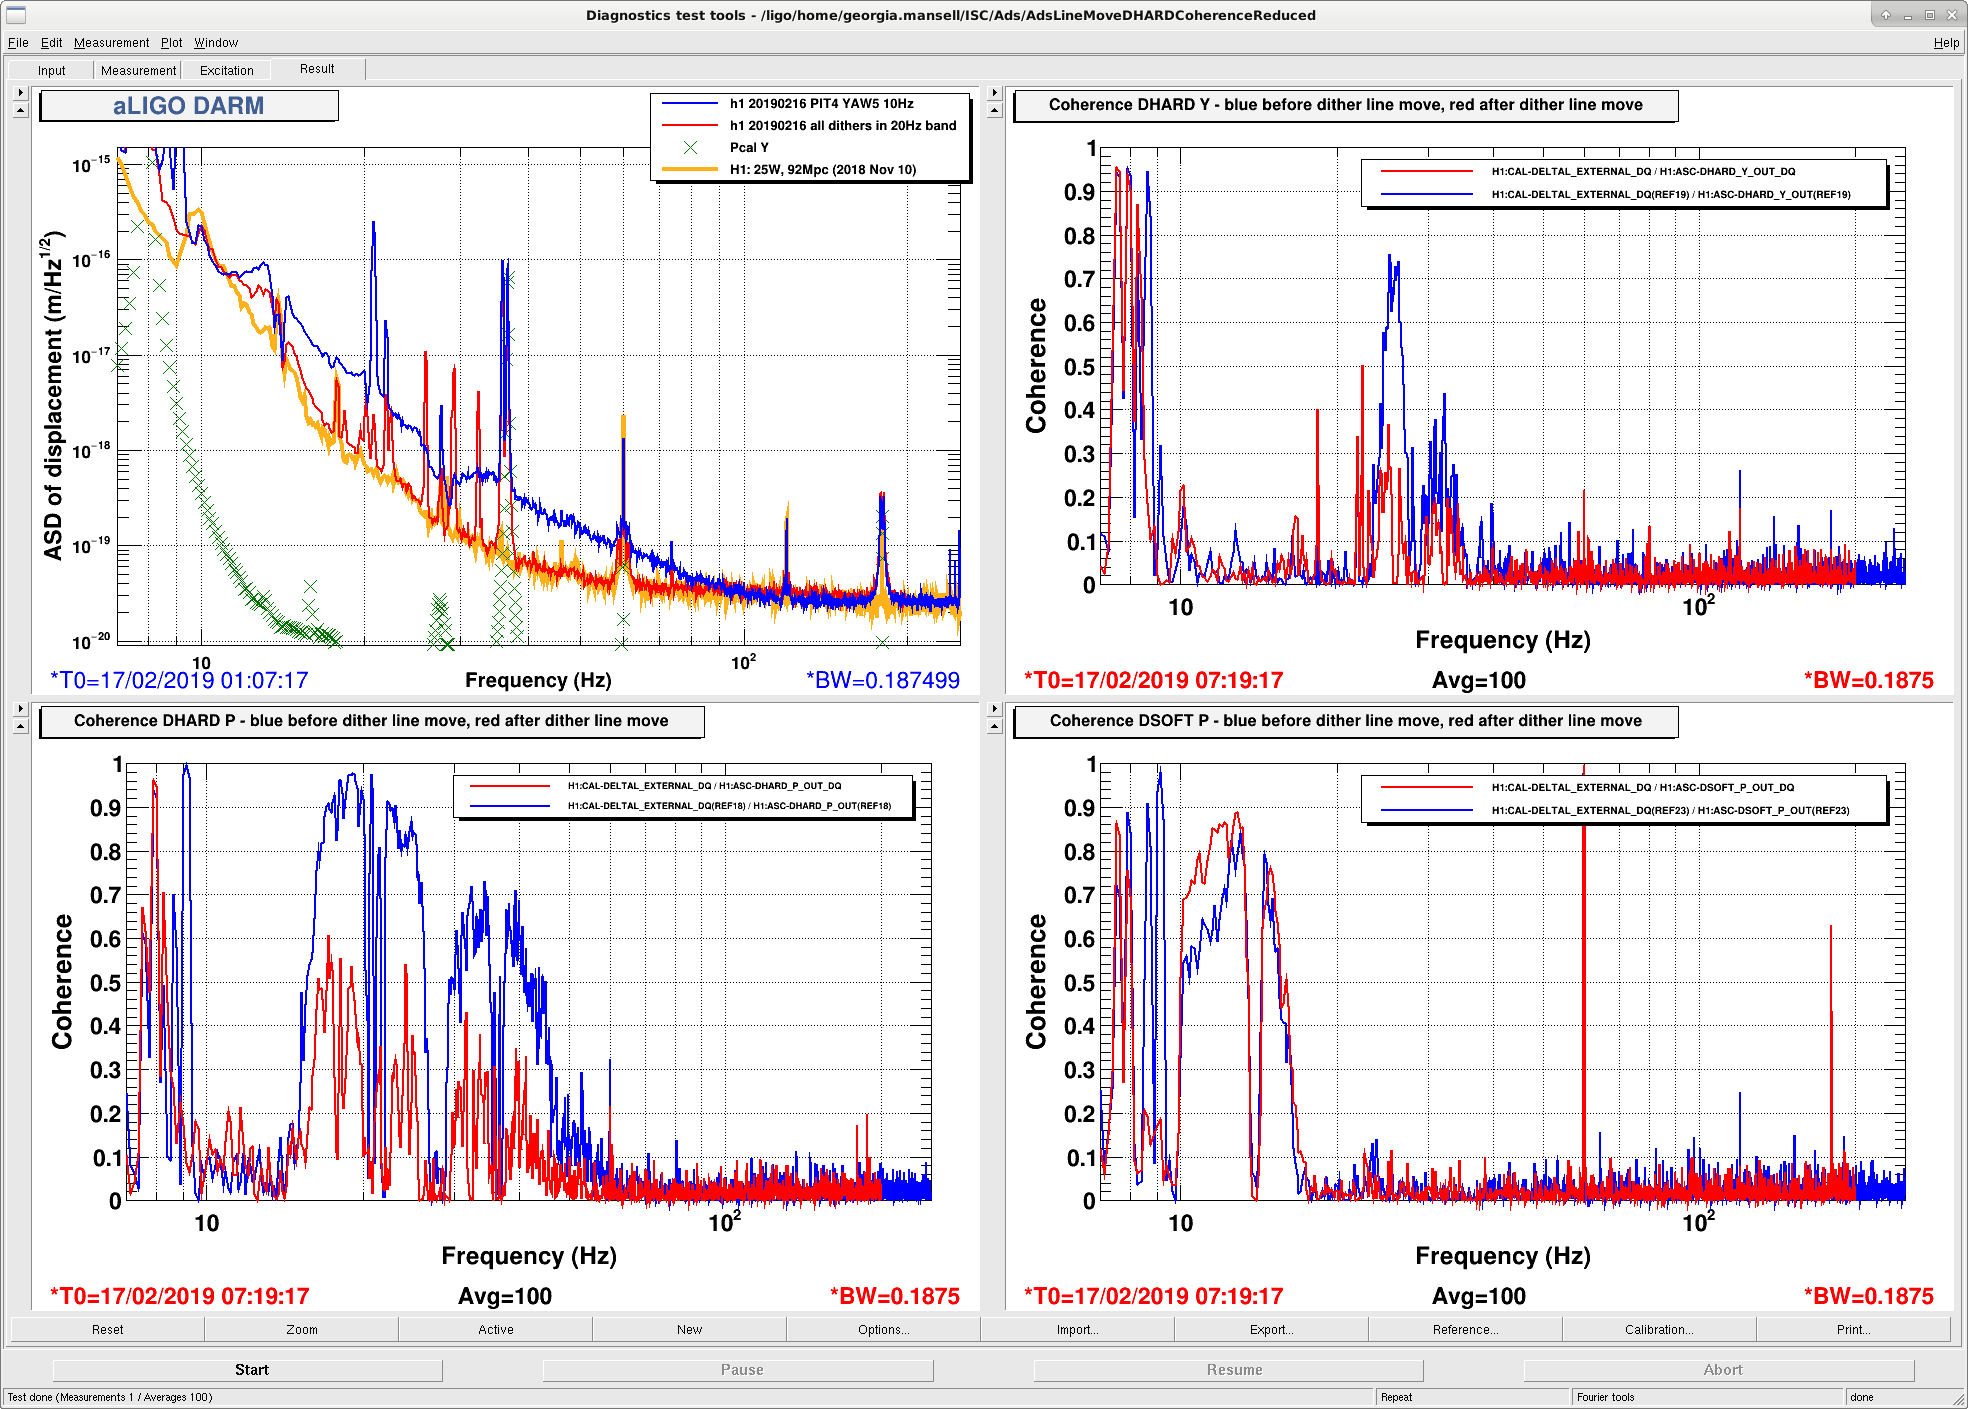
The DARM coherence with ASC and LSC is fairly low above 25 Hz, with the exception of DHARD_P having some coherence between 30-40Hz. We should address this at some point, but it is not a high priority. So, Danny's suspicions of the extra low frequency noise being due to his ASC change yesterday are exonerated.
Also, we are not saving any signals from the ADS system, which is now being used to control the pointing of PRM and the SOFT degrees of freedom. We need to add these in (at least the DOF[3,4,5]_OUT) before ER14.
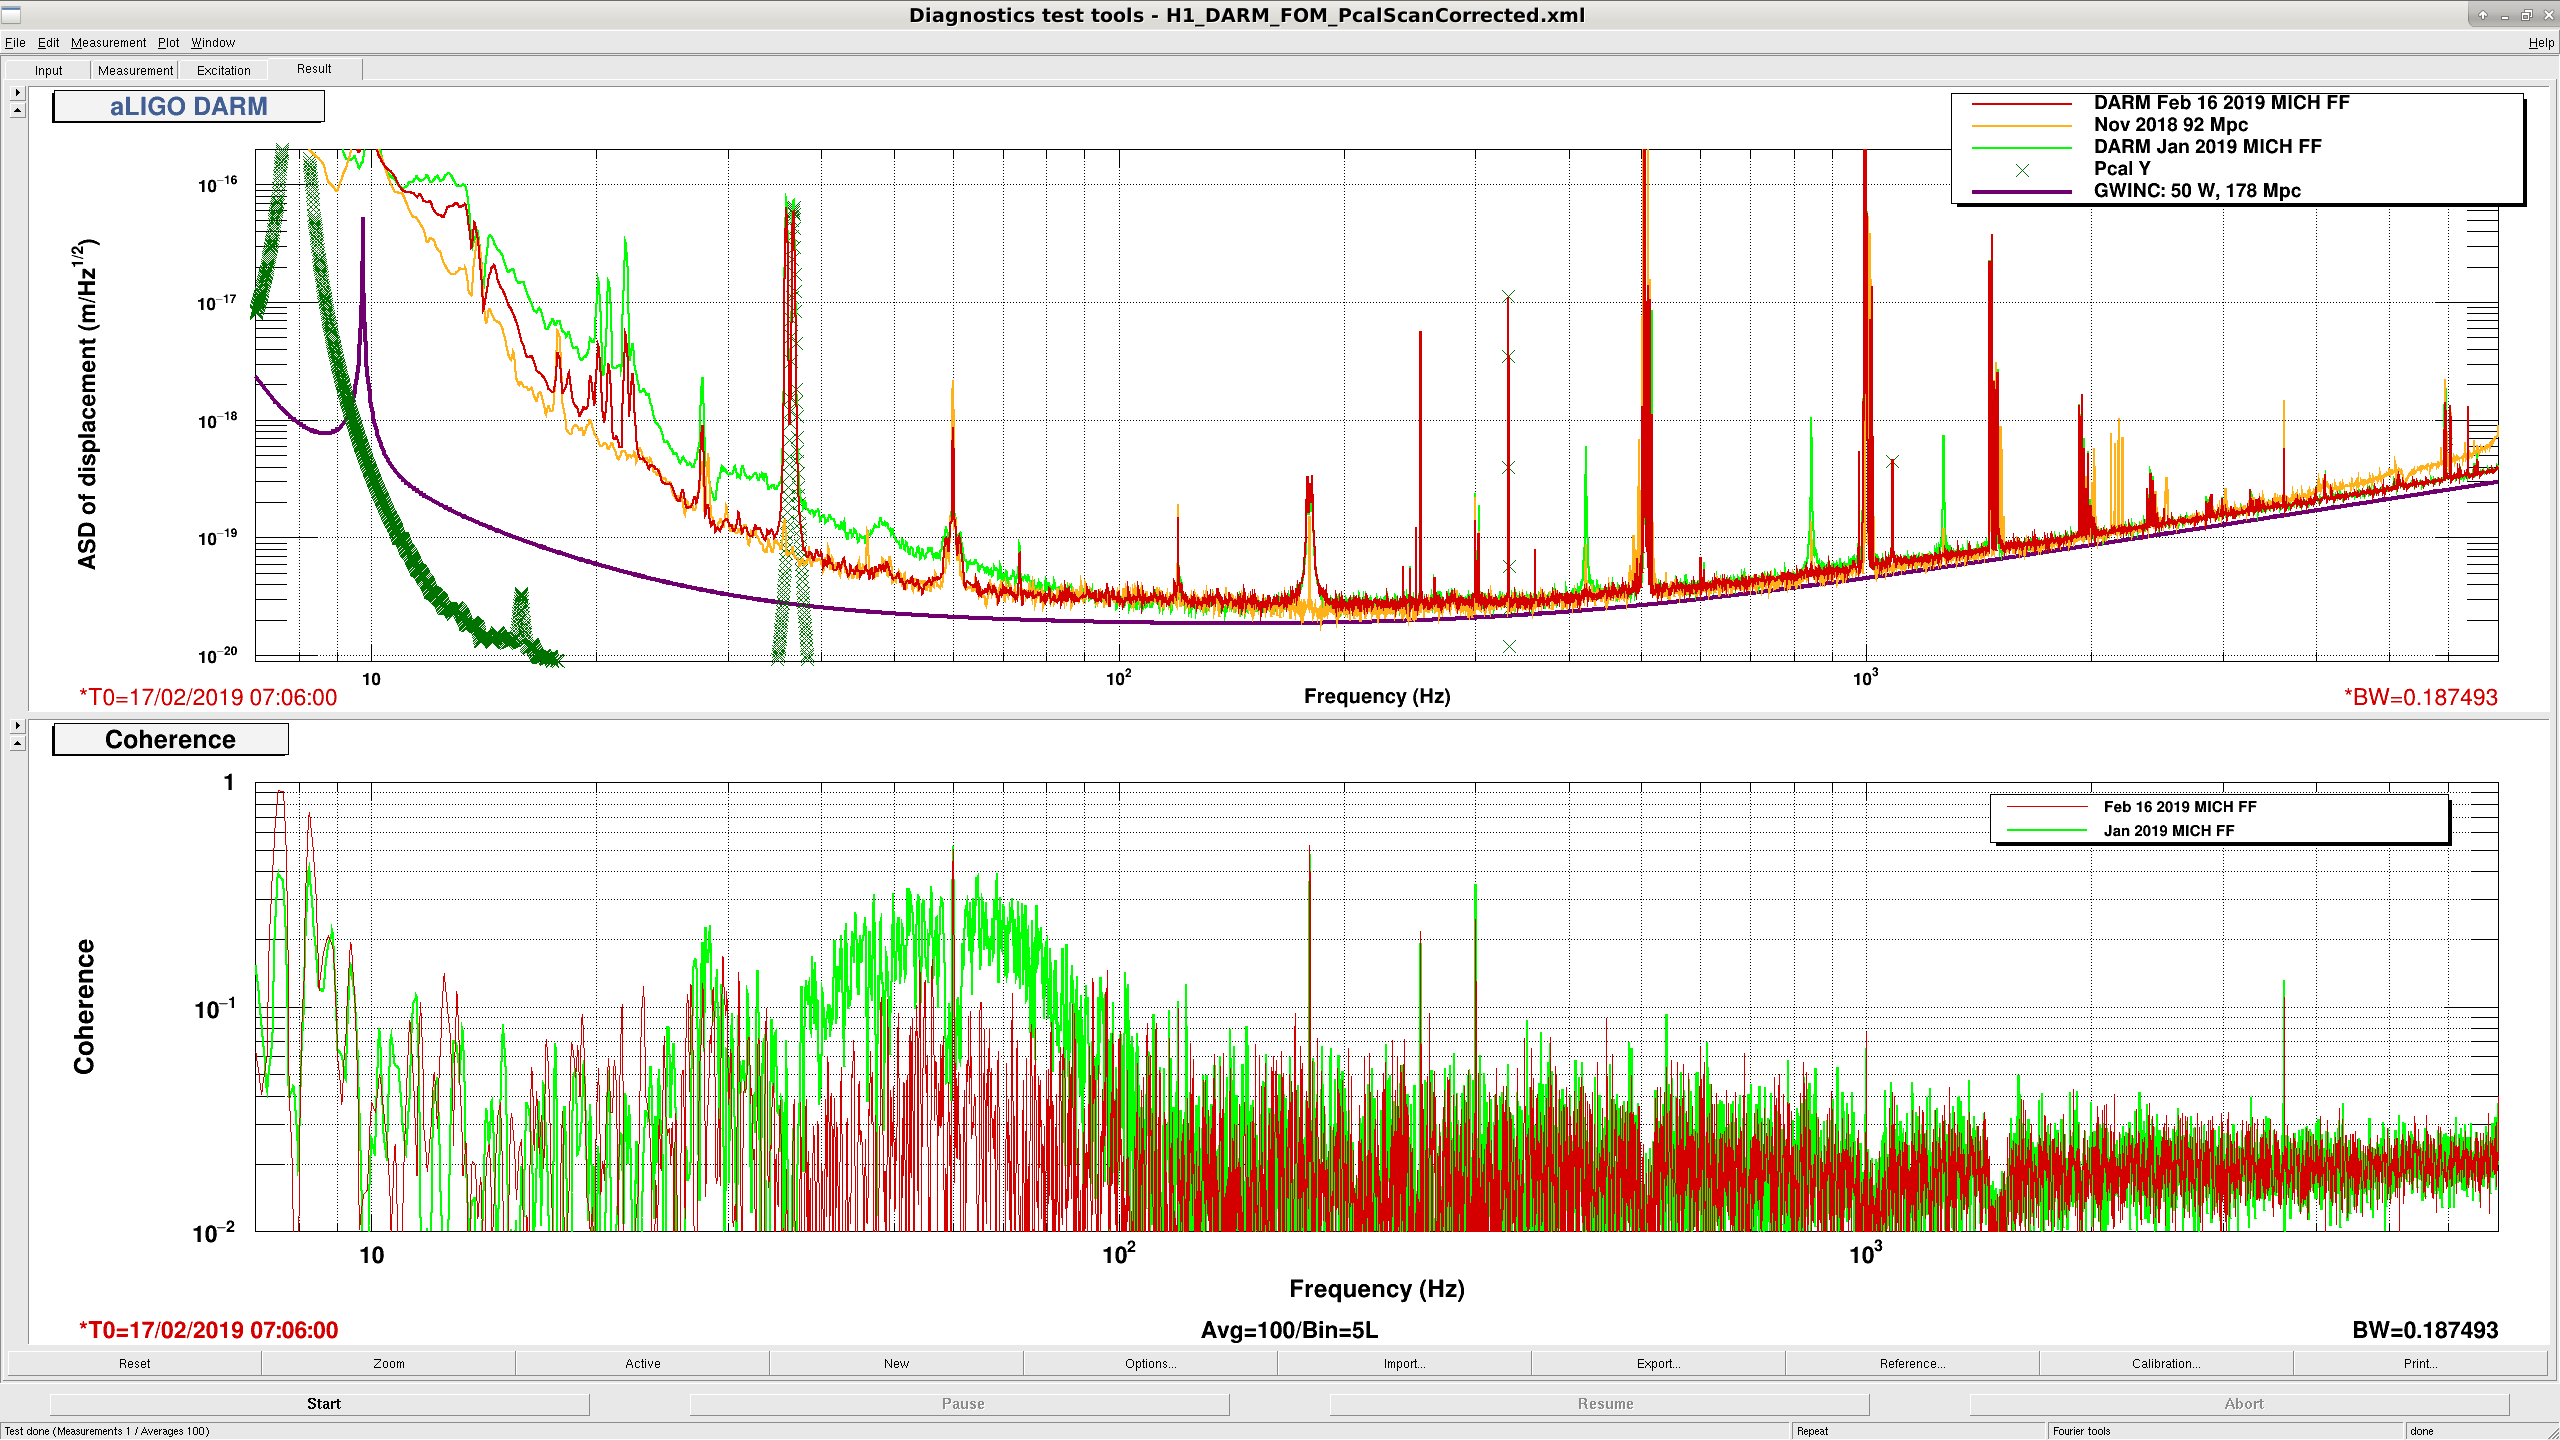
I don't know if anyone has explicitly written this in the alog, but in the Saturday evening alog (46972) it is noted that while the DARM reference is mostly back to November levels, we're reporting a far smaller BNS range. I'm quite confident that most of that range loss is due to the broad peak at 180 Hz from the OMC and PZT driver. We already have plans to address this with the same solution that LLO implemented several months ago (LLO alog 41374 and comments).
This lock lasted more than 20 hours.
A bruco scan is available here. There is a lot of coherence with the ETMX L1 FASTIMON channels, which are just seeing DARM, which I've now added to the excluded channels list. Other than that we have a few things of interest:
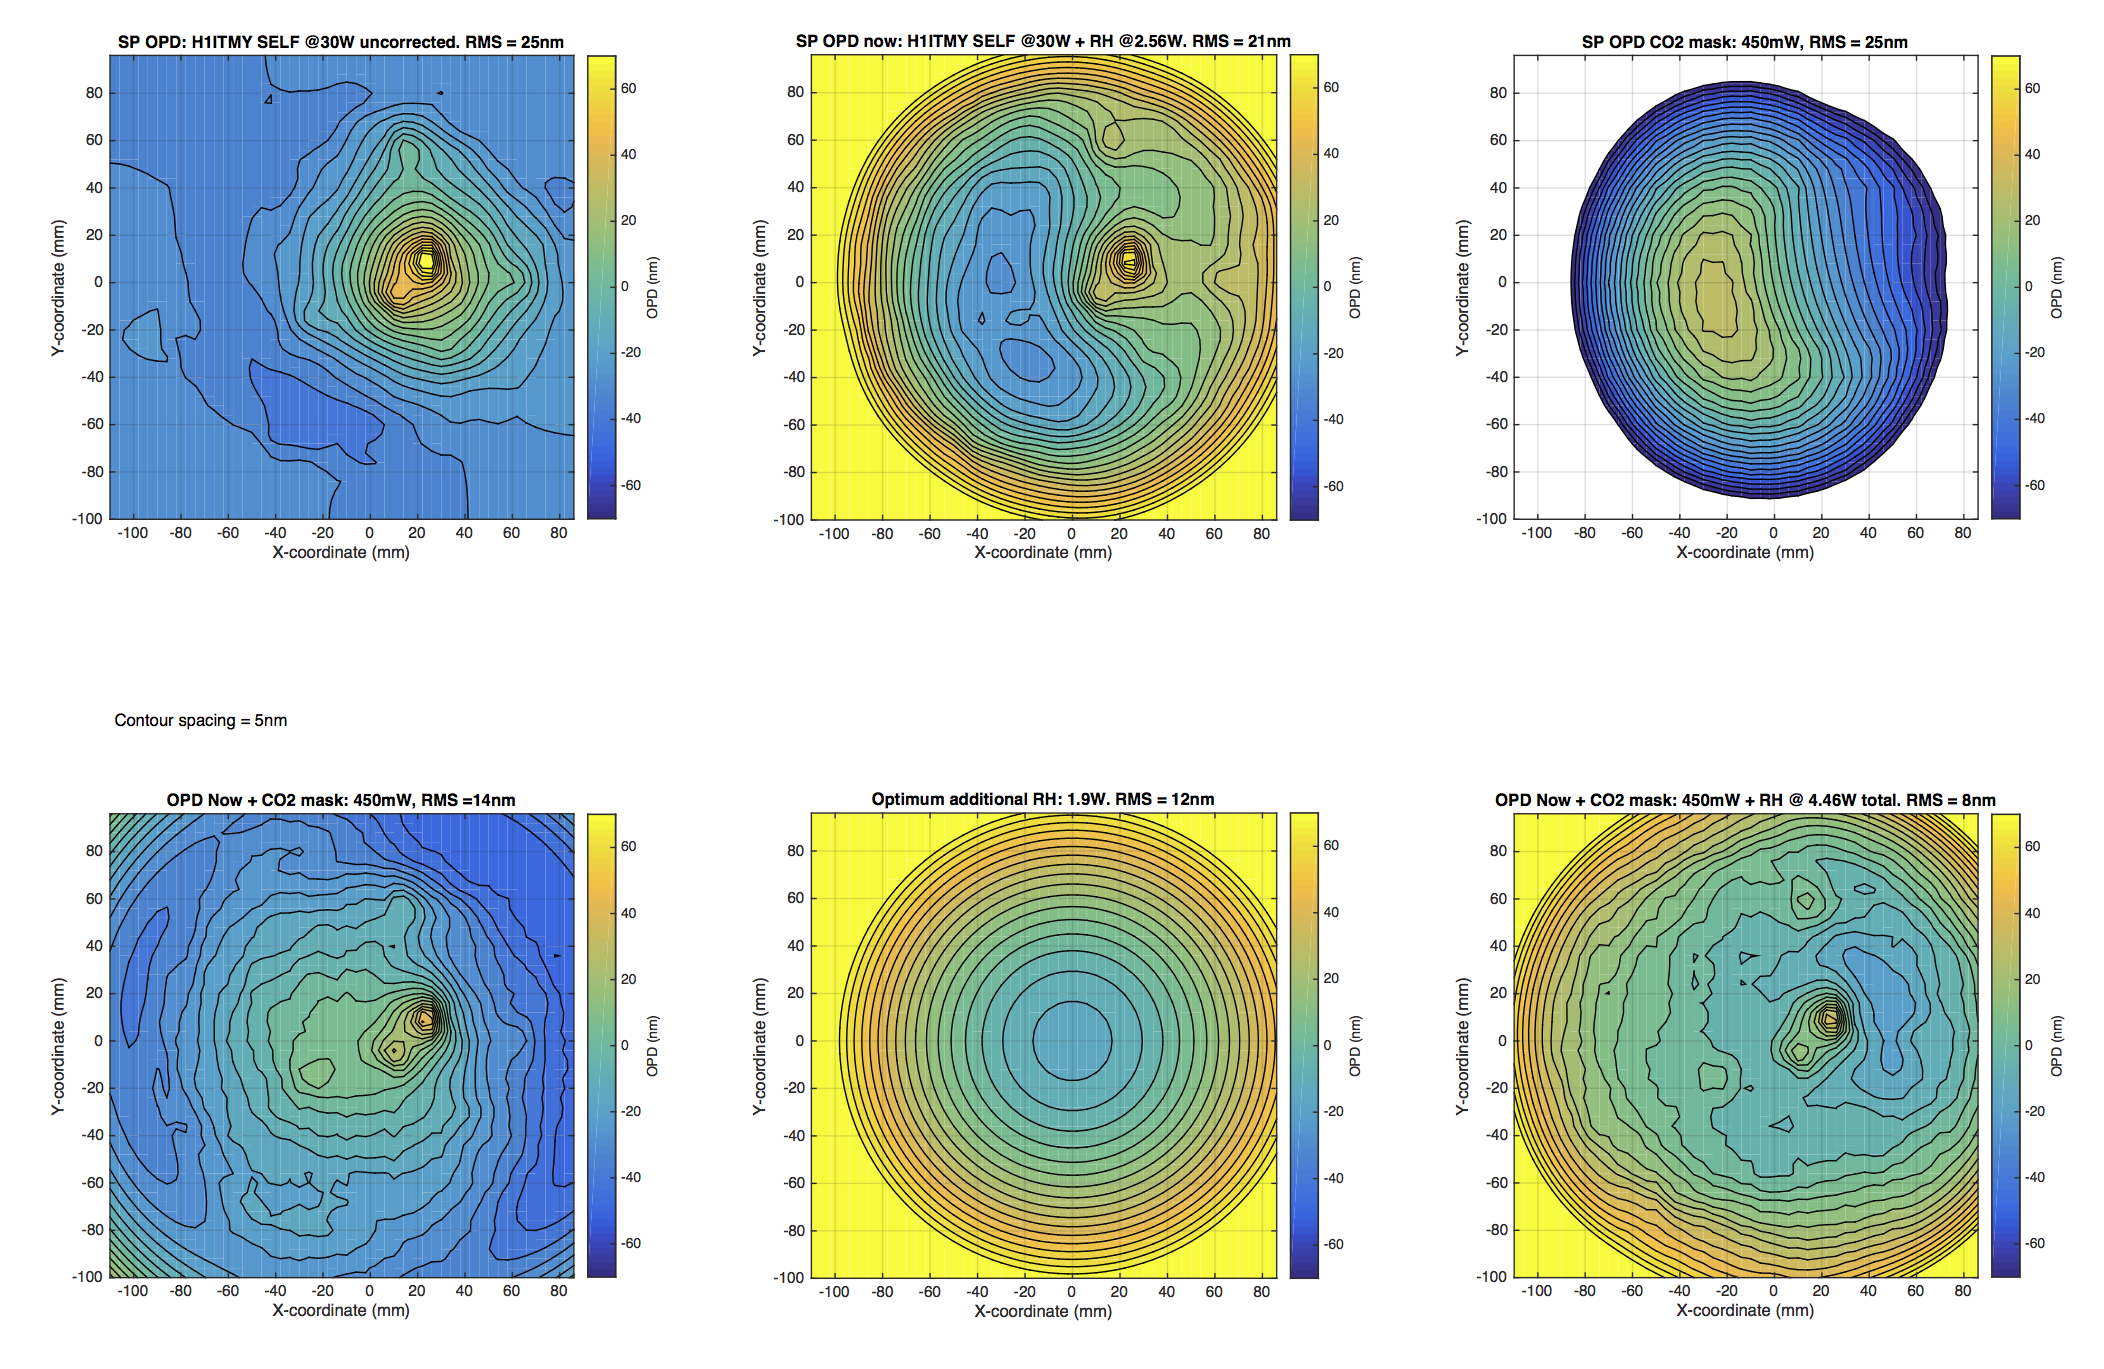
The following is a short summary of an approach to commissioning the H1 ITMY CO2 mask, D1900030. The purpose of the mask is to reduce the scattering of sidebands into higher order spatial modes. However, when the mask is simply applied by itself, it creates a strong positive quadratic lens. A combination of the ITMY RH, ITMX CO2 central heating and ITMX RH must be used to minimize the overall effect of the COMMON & DIFFERENTIAL MICH lenses and the COMMON and DIFFERENTIAL ITM curvatures.
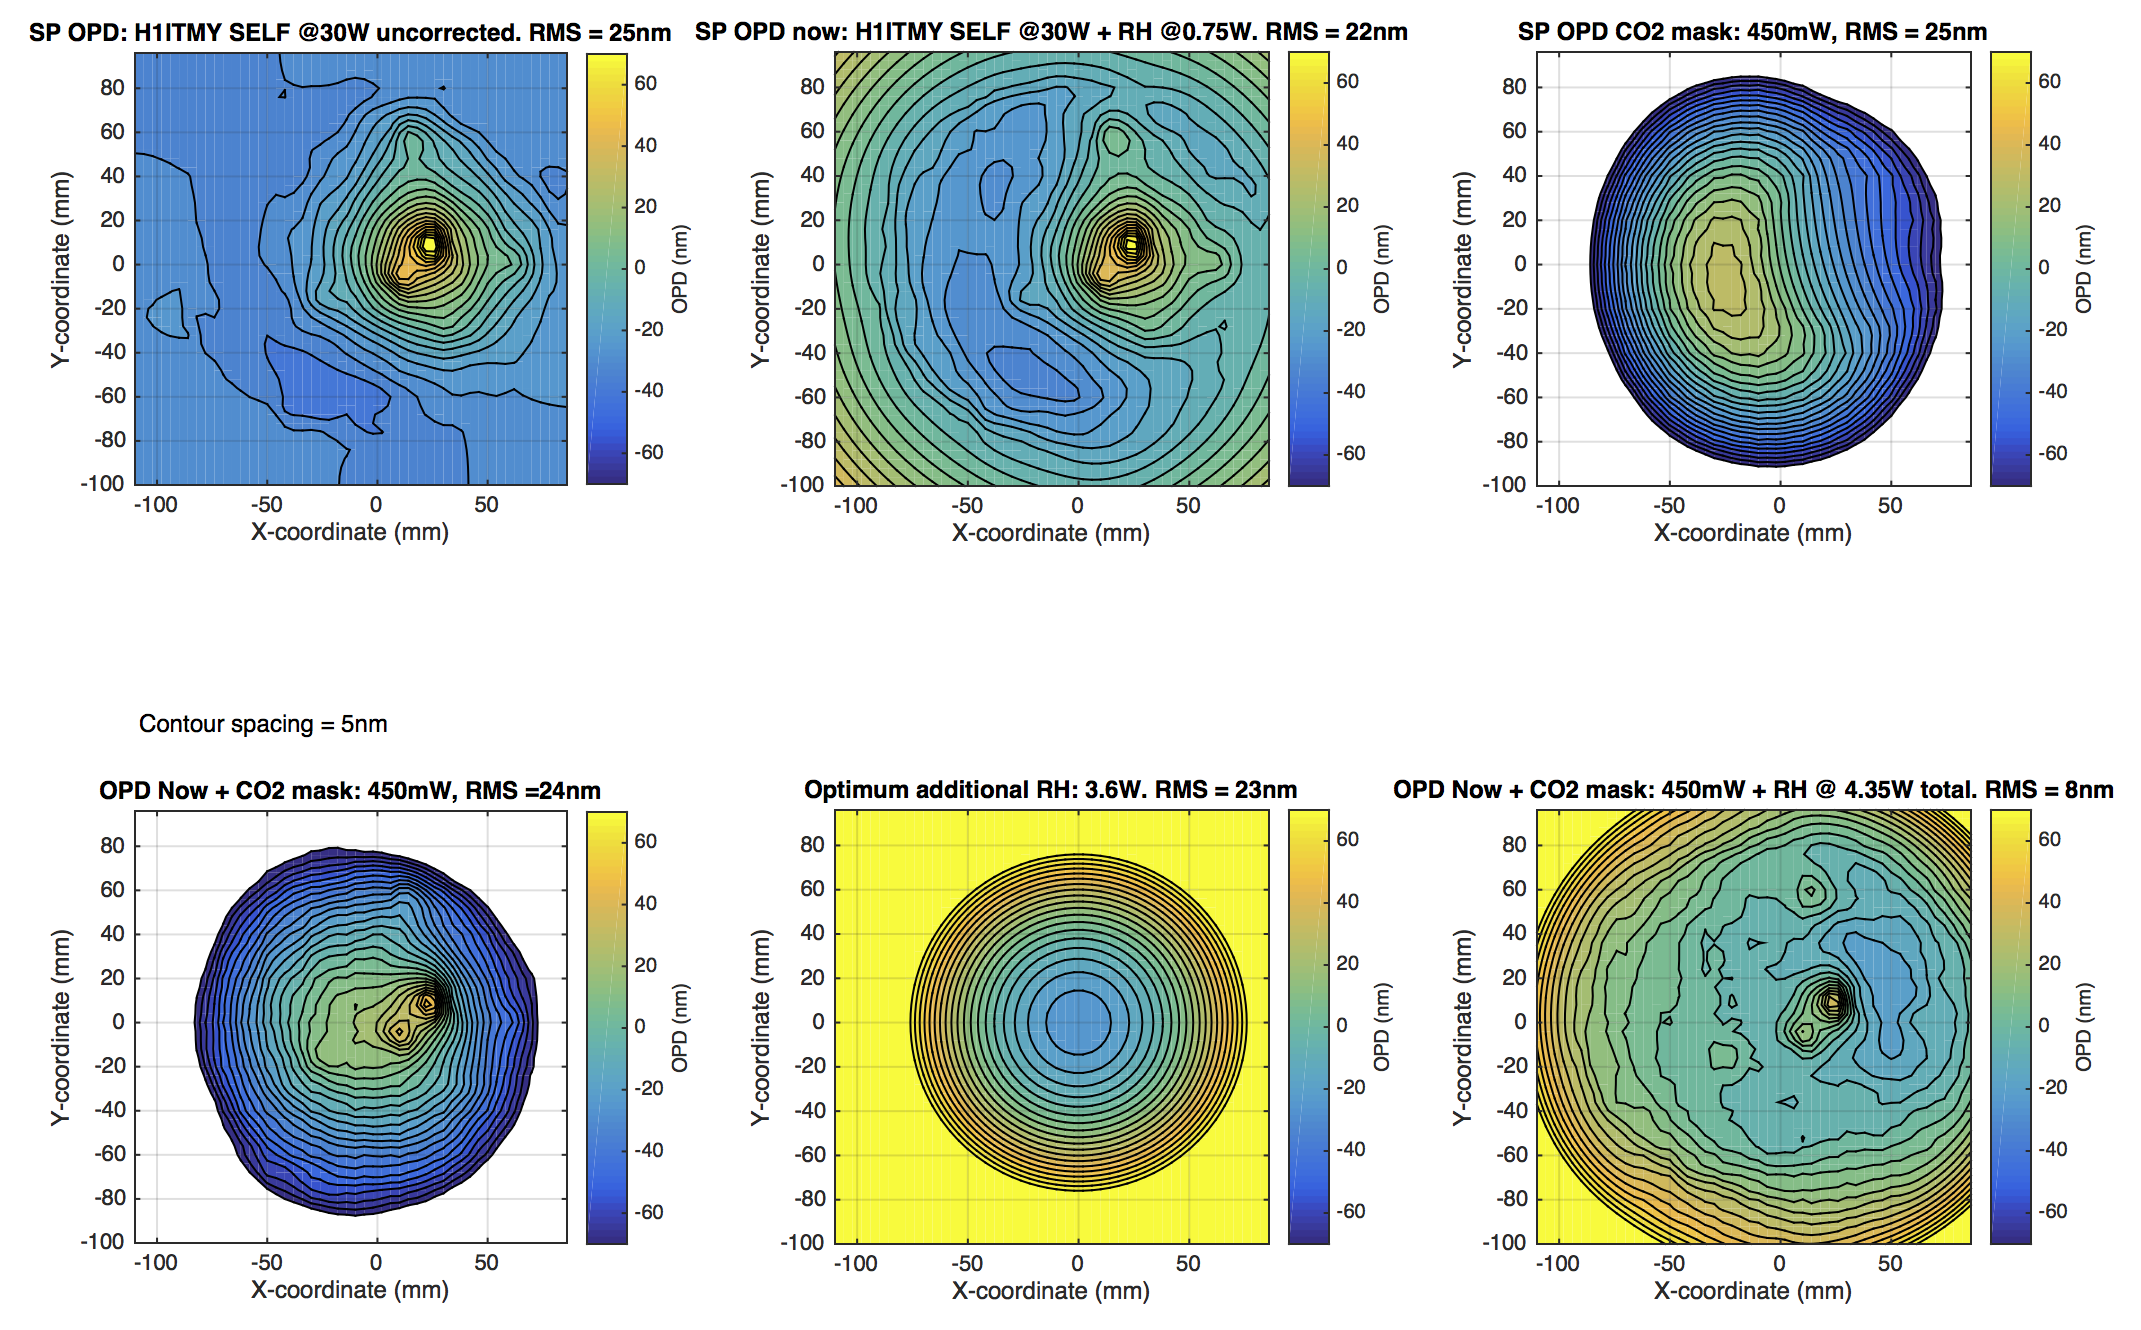
The application of the mask is illustrated in the attached PDFs. An example of the application is shown here:
Note that (a) the color scales have been set to the same level [-70, 70]nm for comparison between different plots [so there is some saturation in some of the plots], (b) contours are set to 5nm spacing in all plots, (c) DC levels have been subtracted from each image so that the Gaussian weighted mean value is 0nm.

Once this step has been applied, the ITMY substrate lens should be same as it currently is. This will maintain the COMMON and DIFFERENTIAL MICH lenses. However, the application of ITMY RH will change the ITMY ROC and, hence, the COMMON and DIFF ITM ROC will need to be corrected. Which will be dealt with in step 2.
The attached PDFs show the effect for differing CO2 powers ranging from 50mW to 750mW. The minimum RMS OPD is achieved around 450mW.
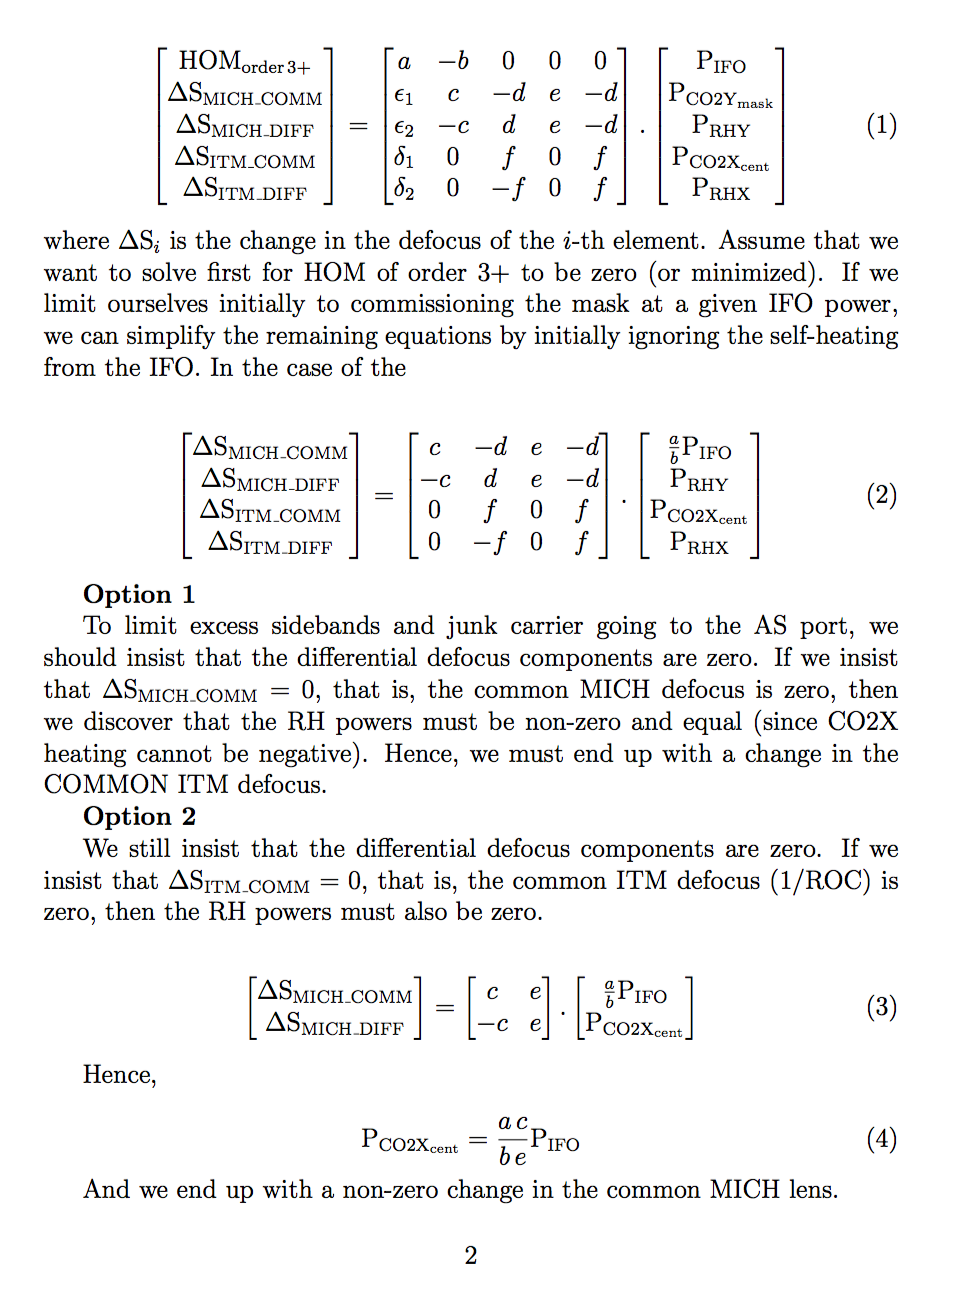
Working on the full matrix description of this: 4 TCS actuators > 4 DOF (COMM/DIFF MICH, COMM/DIFF ITM ROC).
Somewhat crude matrix analysis of actuation strategies. The effect of interferometer power and the CO2 mask can be seen below. Any actuation strategy that employs this mask will enforce a change in either the COMMON ITM ROC/DEFOCUS and/or the COMMON MICH DEFOCUS.

I'm working on plotting the time evolution of the RMS value of the OPD once the mask is added. However, as a rough guide (based on (a) some provisional simulations, (b) basic thermal diffusivity calculations), the thermal time constant of the mask is approximately 40 minutes. This means that the majority of the effect the mask should manifest on this time scale.
Note: this excludes the time constant associated with the RH
I just discovered that the code used to generate the wavefronts was using the ITMX RH power (~0.78W) rather than the ITMY RH (~2.56W). I'll need to regenerate these plots with the correct RH power.
Here is the updated mask application based on 2.56W into ITMY RH.

Craig, Danny, Georgia
Here is the current translation between PZT filter module name and actual PZTs mounted to the OMC mirrors.
| Filter bank | Drive | Bias | OMC PZT |
|---|---|---|---|
| PZT1 | Low Voltage: ±10V | 0V | PZT 1 |
| PZT2 | High Voltage: 0 to +100V | 0V | PZT 2 |
| PZT3 | High Voltage: –10 to +90V | 10V | PZT 1 |
The OMC PZTs have been derated to 100V maximum.
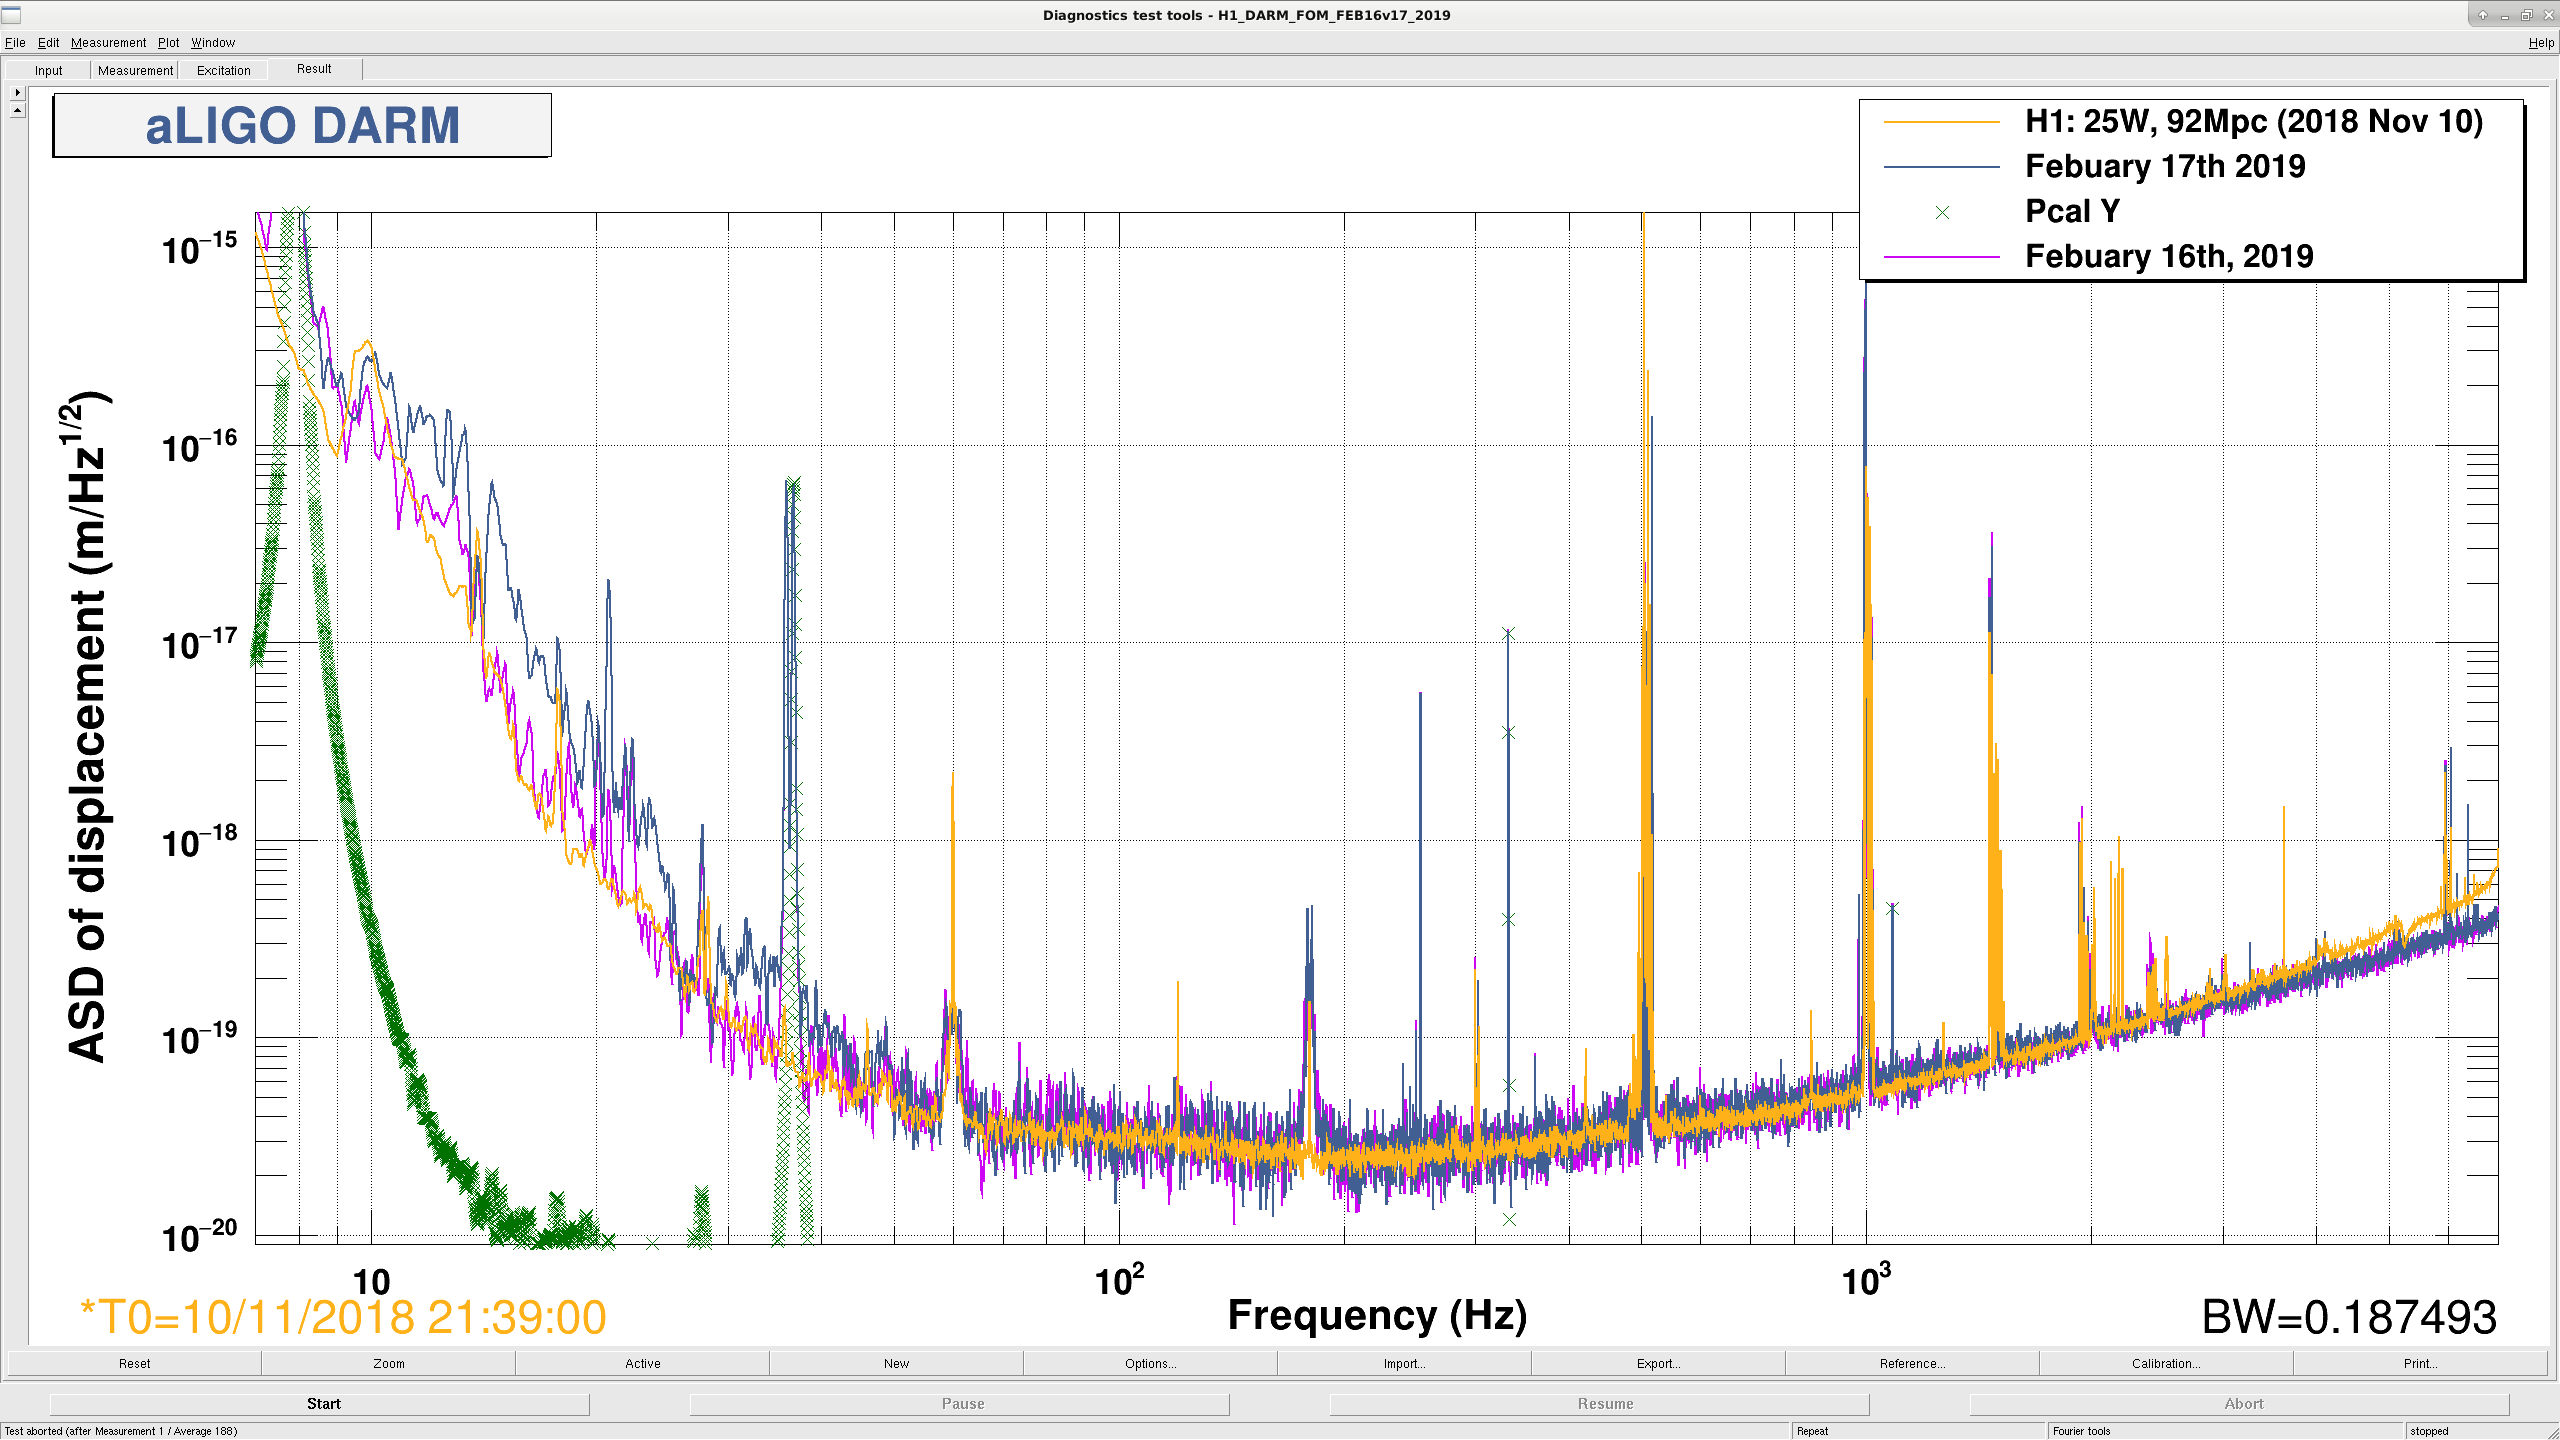
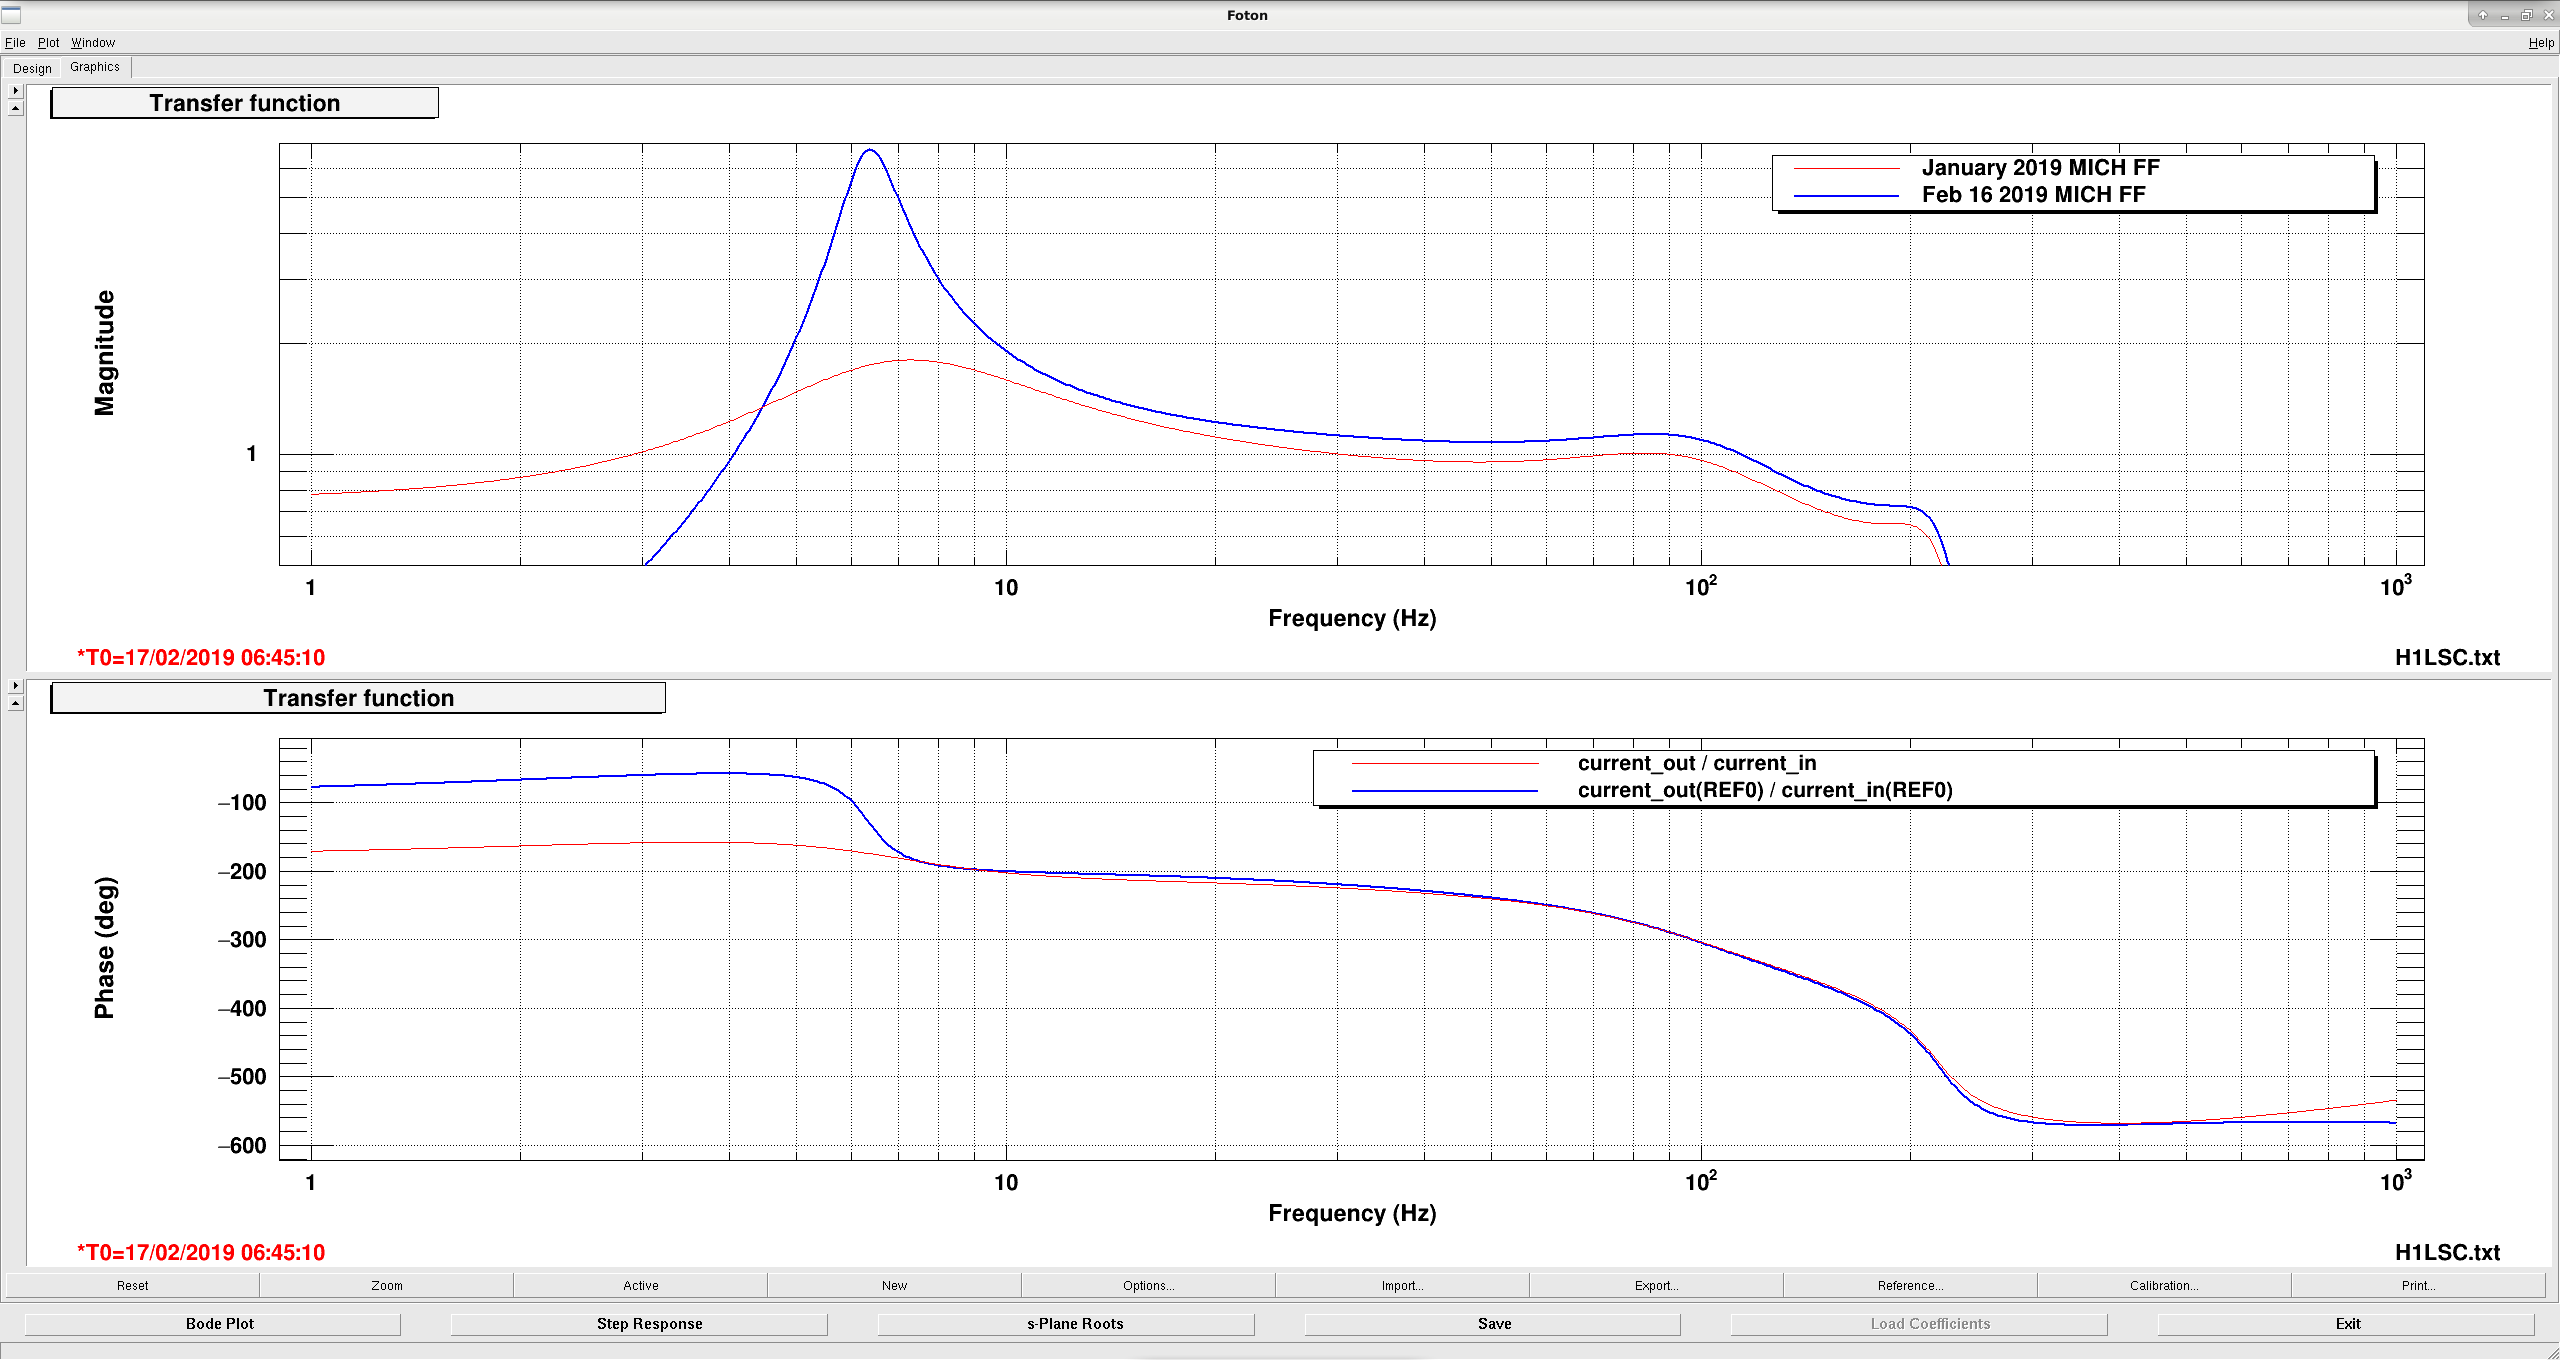
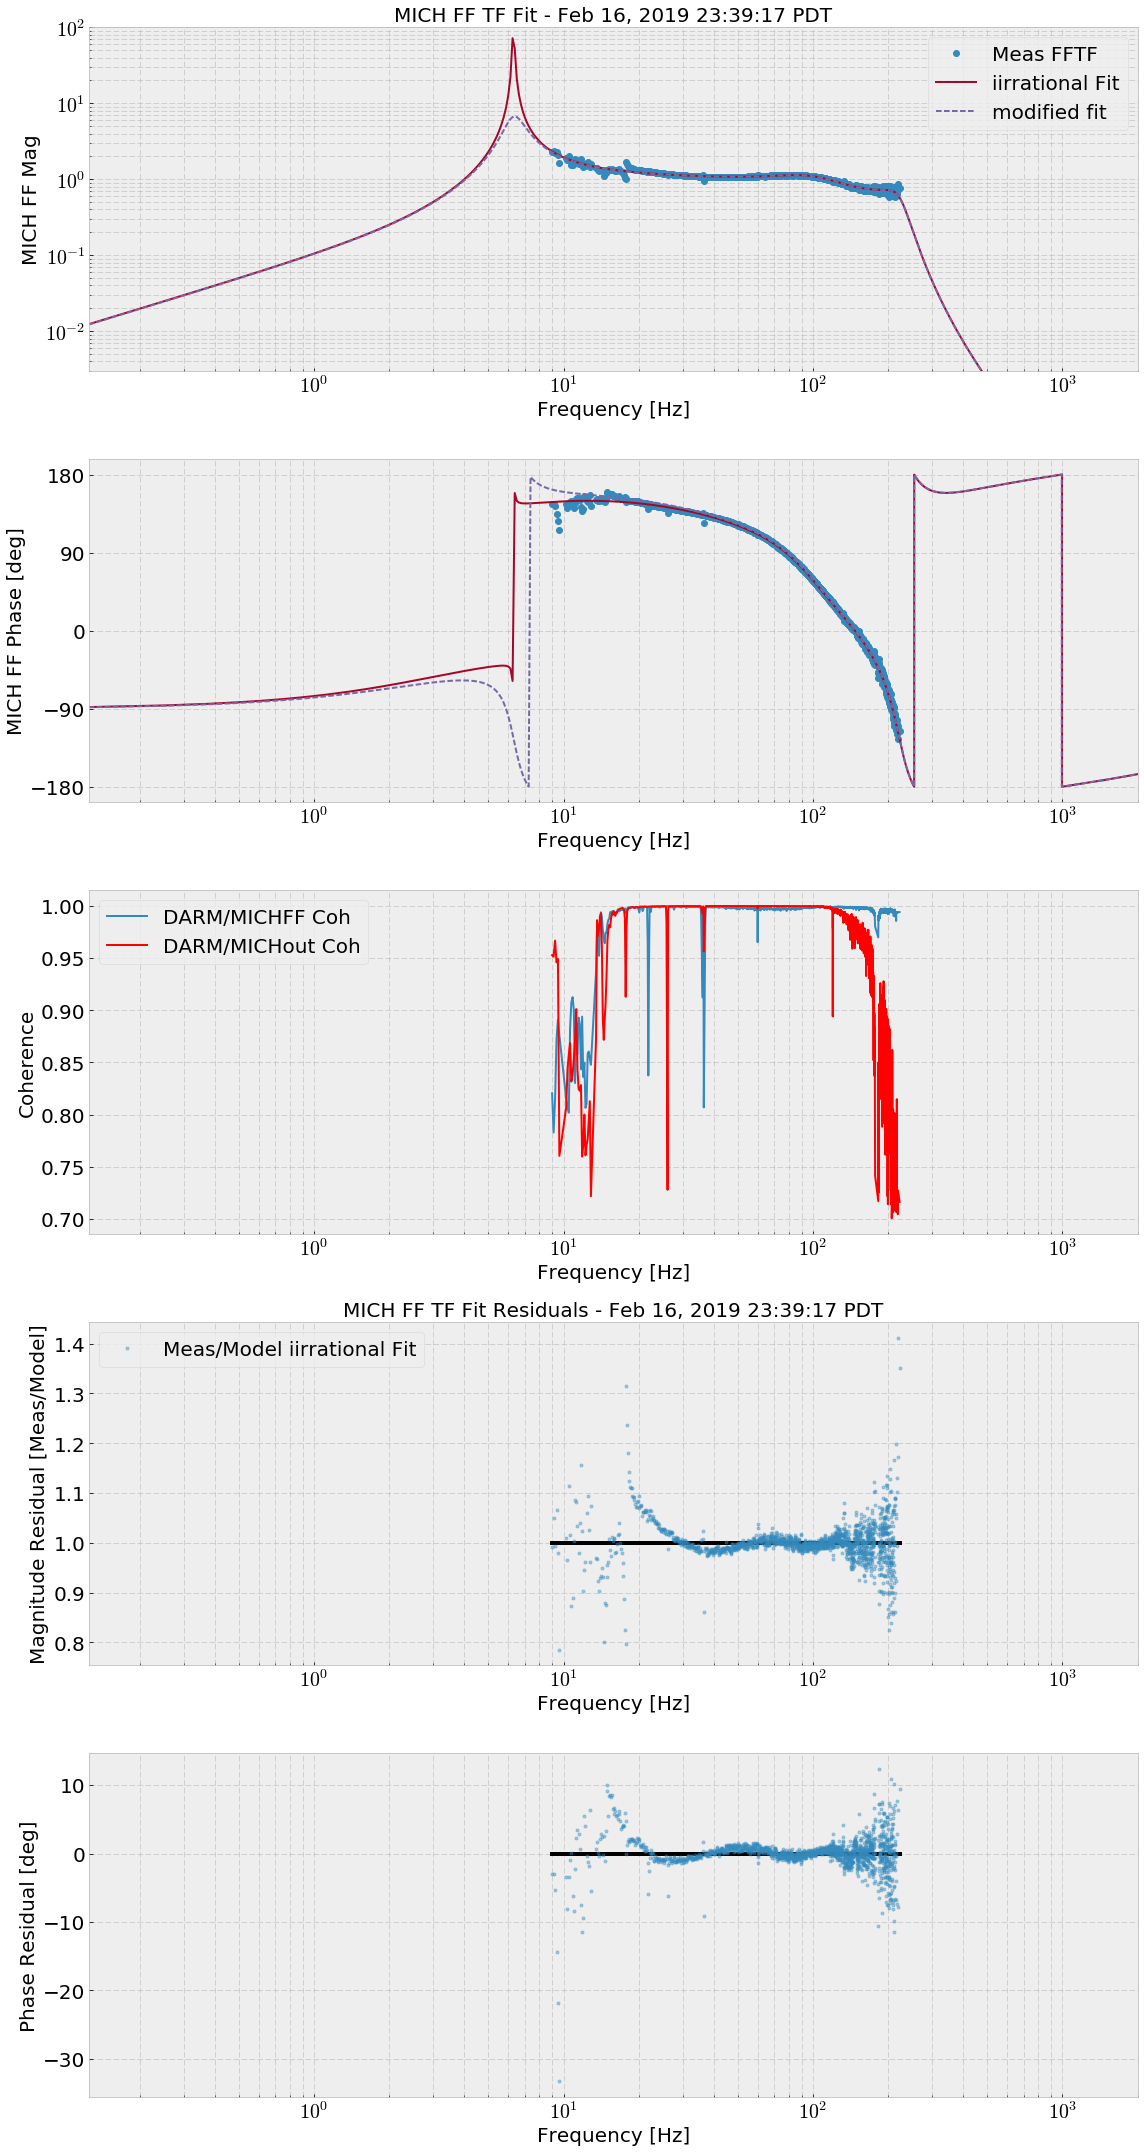
Danny, Georgia, Craig Danny retuned the MICH FF. The coupling from MICH to DARM around 70 Hz was significantly reduced (Attachment one). The filter comparison between Jan 11 and today is seen in attachment two. The new filter is implemented as Feb16b in FM4 of MICHFF. The AC (FM2) filter is no longer turned on with it as it is not needed. This is implemented in LOWNOISE_LENGTH_CONTROL. ---------------------------------------------------------------------------------------------------------------------------------------------------------------------------------------------- I also changed the DARM frontend calibration to reflect Georgia's DARM actuator flip (she put all DARM actuation onto ETMX, see an upcoming alog). According to the PCAL lines we are good to 7%. Our noise seems to back to November 2018 reference FOM levels after the MICH FF retuning and the dither alignment changes done by Georgia today, which improved the DHARD coupling to DARM. The November FOM says 92 Mpc, but our current calculations say 80 Mpc. - Our high frequency noise is much improved with the increased ISS secondloop gain (+12 dB on the SECONDLOOP_GAIN slider) - 180 Hz peak is still broad. We are occasionally seeing what seem like harmonics of this peak in DARM, - ESD glitches are less frequent (1 every ~30 minutes) - Scattering is gone when using the ETMX actuator. - SOFT limits between 10 and 20 Hz, HARD still coherent beyond 20 Hz but is much improved.
A plot of inspiral range hour-trends supports the impression that the rate of major glitches is, at present, greater than in O1 or O2 at LHO and possibly LLO as well. The minimum range per hour in Figure 1 (blue) appears lower now than in O1 and O2 (and the associated commissioning time) because fewer hours are free of major range drops. The plot on the second page of Figure 1 compares single recent days around the supernova alert, when the interferometers were mostly left free of commissioning glitches, to random days in O2, and these plots also suggest a higher big glitch rate at both sites. Hopefully, the high glitch rate will go away once the interferometers are in run mode, but I think we should start worrying, just in case.
One possibility is that the apparent increase in glitch rate is due to a new piece of equipment such as electronic or computer equipment, that was installed at each site during the O1-O2 break. Sheila pointed out that the possibilities might be narrowed down at LLO since the installation was staggered. I looked for a step increase, and, while it is not completely clear, the best candidate appeared to be the March – September 2018 down-time (Figure 2). Suggestions of equipment to investigate would be appreciated.
I, and as far as I know, others, have not found channels that predict the majority of the major glitches. So, Kara and I set up magnetometer channels to monitor new equipment that might be too far from the permanent magnetometers for glitch source identification.
Robert, Kara
|
H1:PEM-EX_ADC_0_13_2K_OUT_DQ |
EX HV ESD power supply, gain 1 |
|
H1:PEM-CS_ADC_5_20_2K_OUT_DQ |
Diode room 70W box, gain 100 |
|
H1:PEM-CS_ADC_5_21_2K_OUT_DQ |
Diode room 70W box, gain 1 |
|
H1:PEM-CS_ADC_5_22_2K_OUT_DQ |
Diode room 70W box, gain 1 |
|
H1:PEM-CS_ADC_5_23_2K_OUT_DQ |
Squeezer rack, gain 100 |
|
H1:PEM-CS_ADC_5_24_2K_OUT_DQ |
Squeezer rack, gain 1 |
|
H1:PEM-CS_ADC_5_25_2K_OUT_DQ |
Squeezer rack, gain 1 |
There are so far no obvious correlations between the magnetometer signals and the glitches. We will continue to analyze the lock segments that we have using different methods, but to broaden our search I have moved the 3rd magnetometer from the squeezer rack to next to the TTFSS on top of the table at Nutsinee's suggestion.
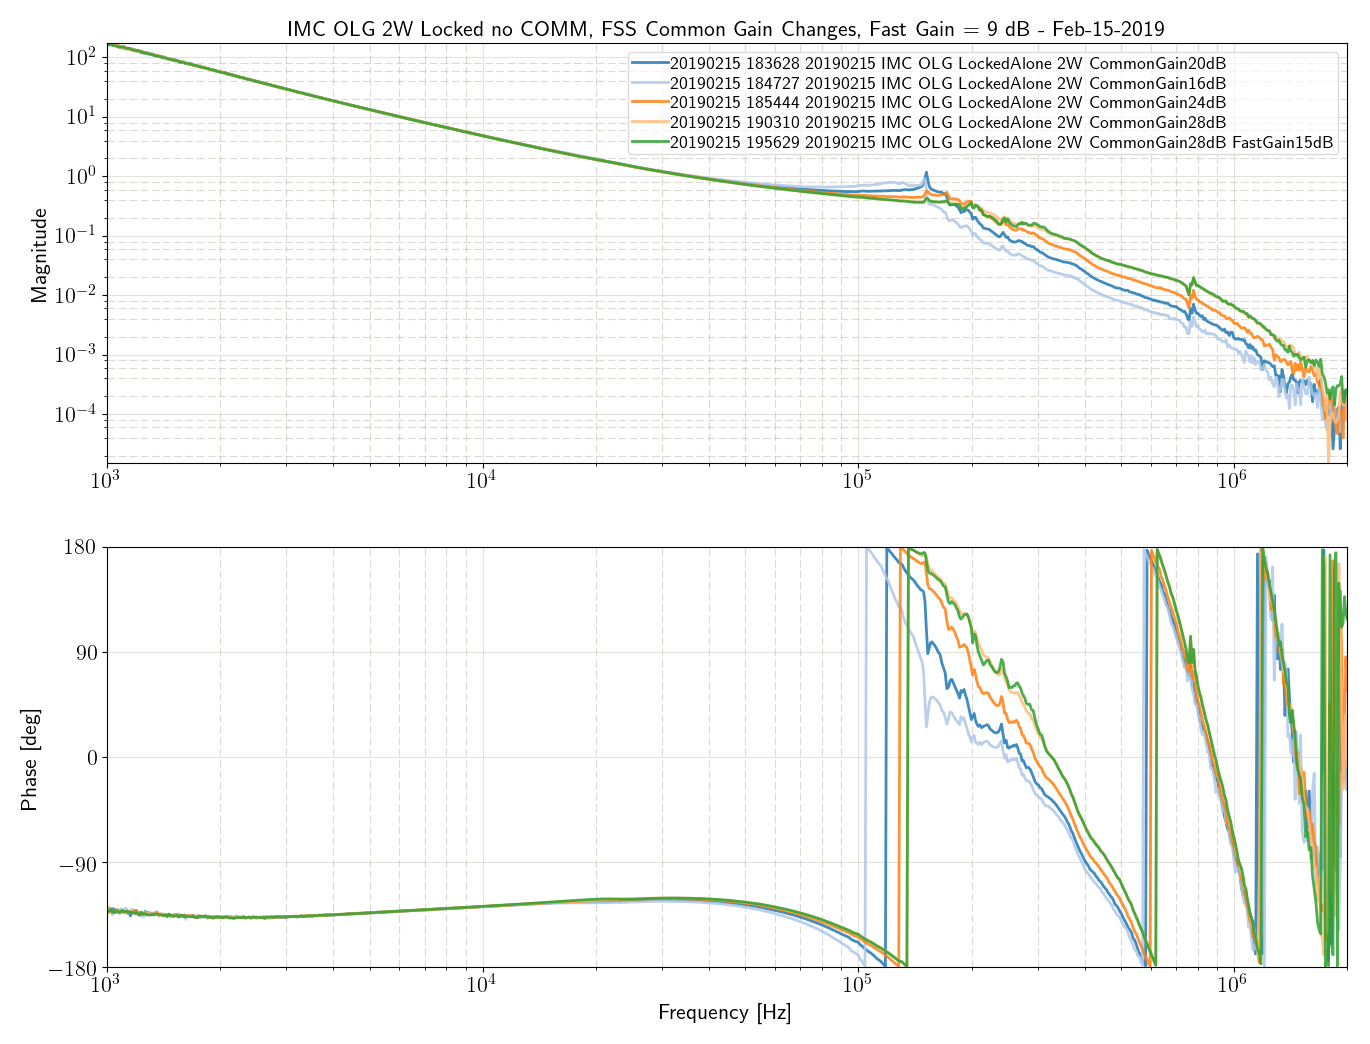
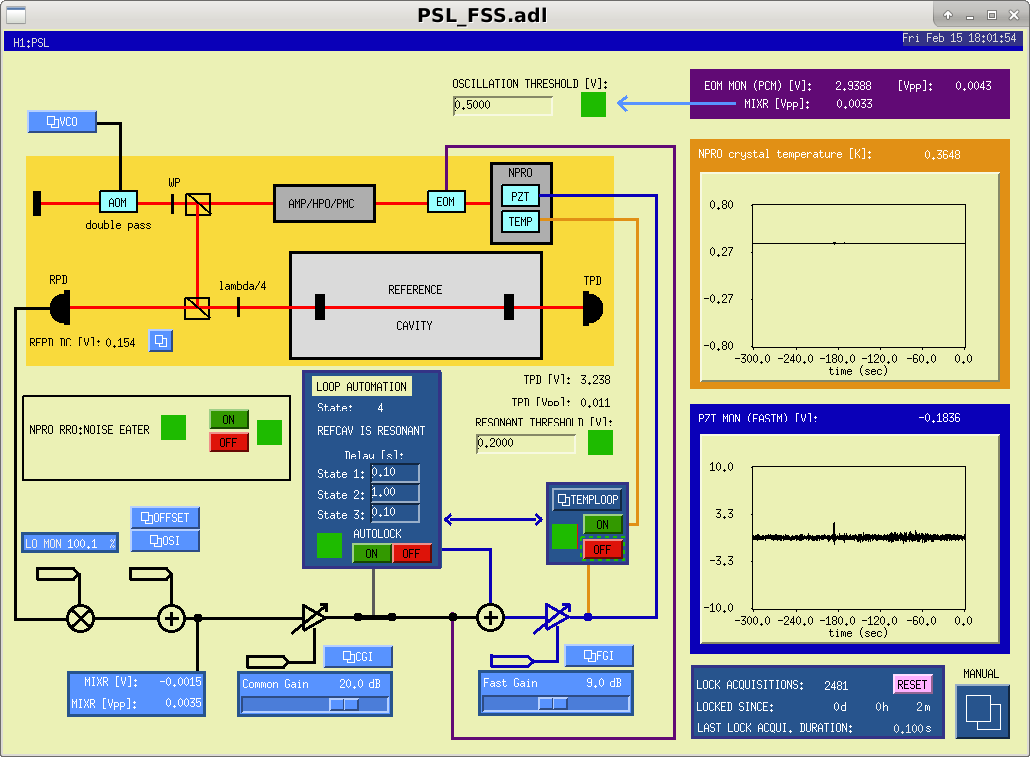
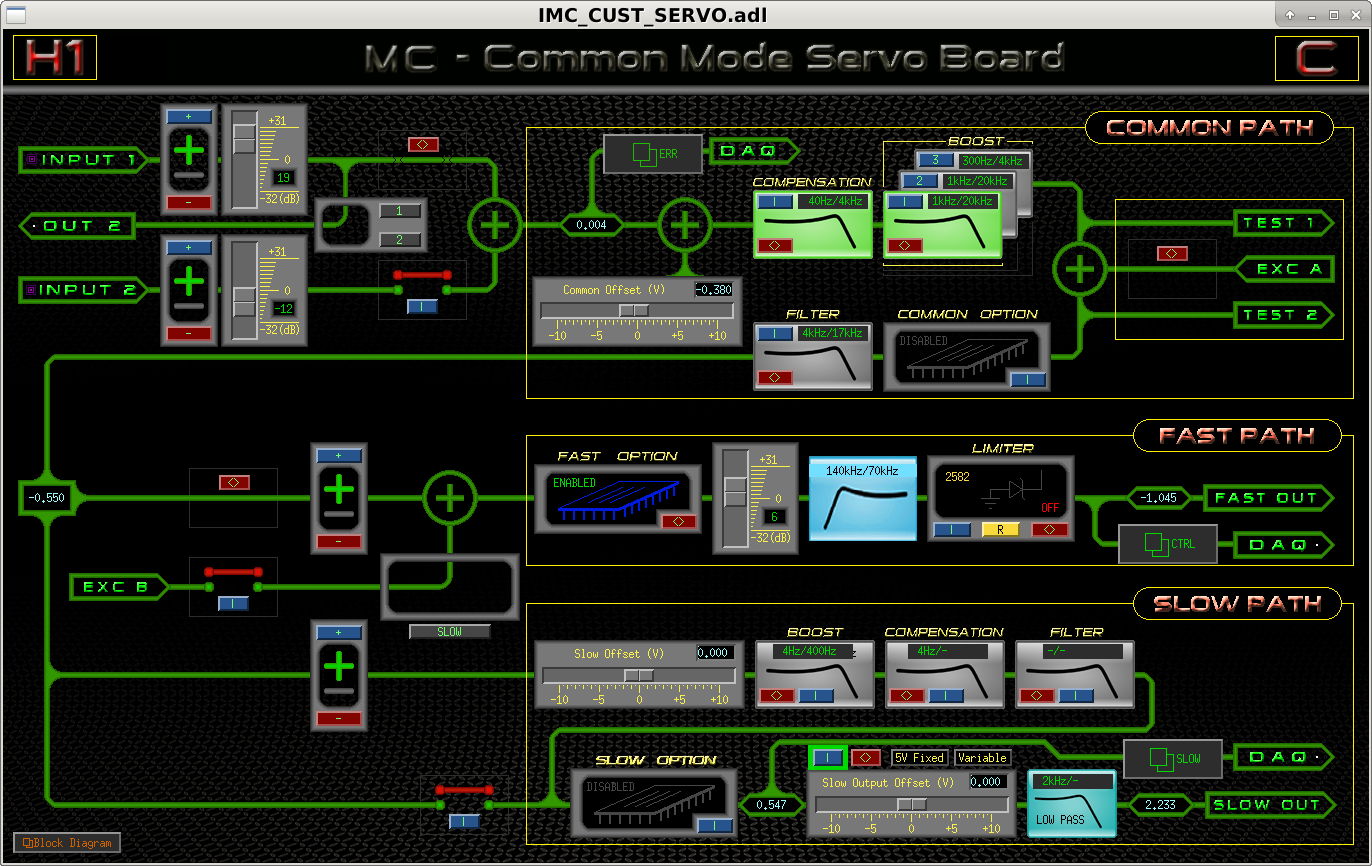
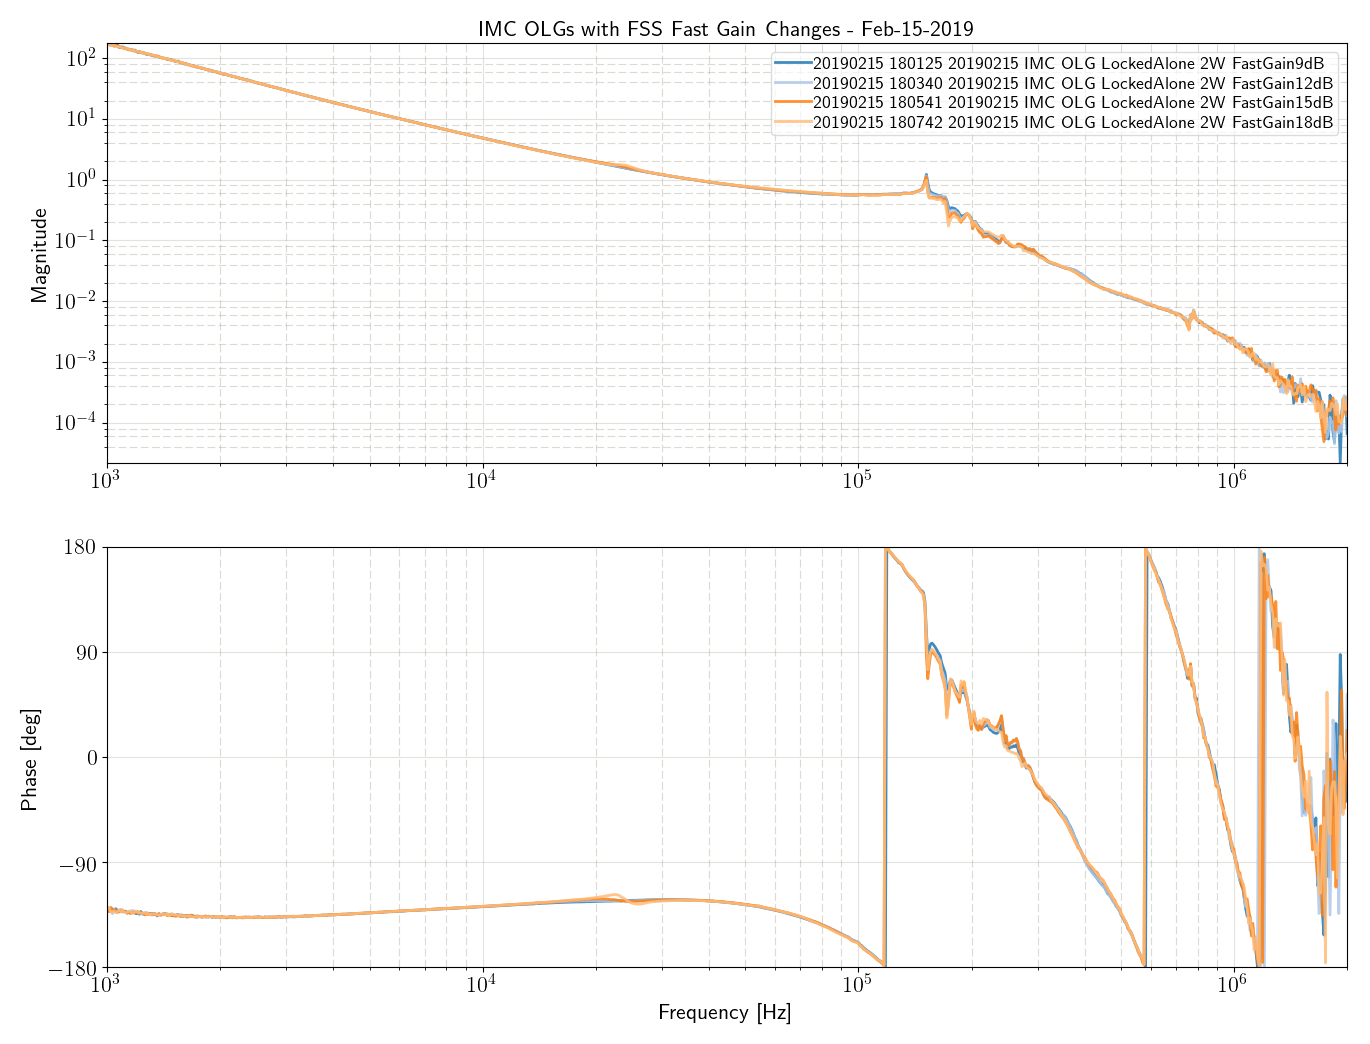
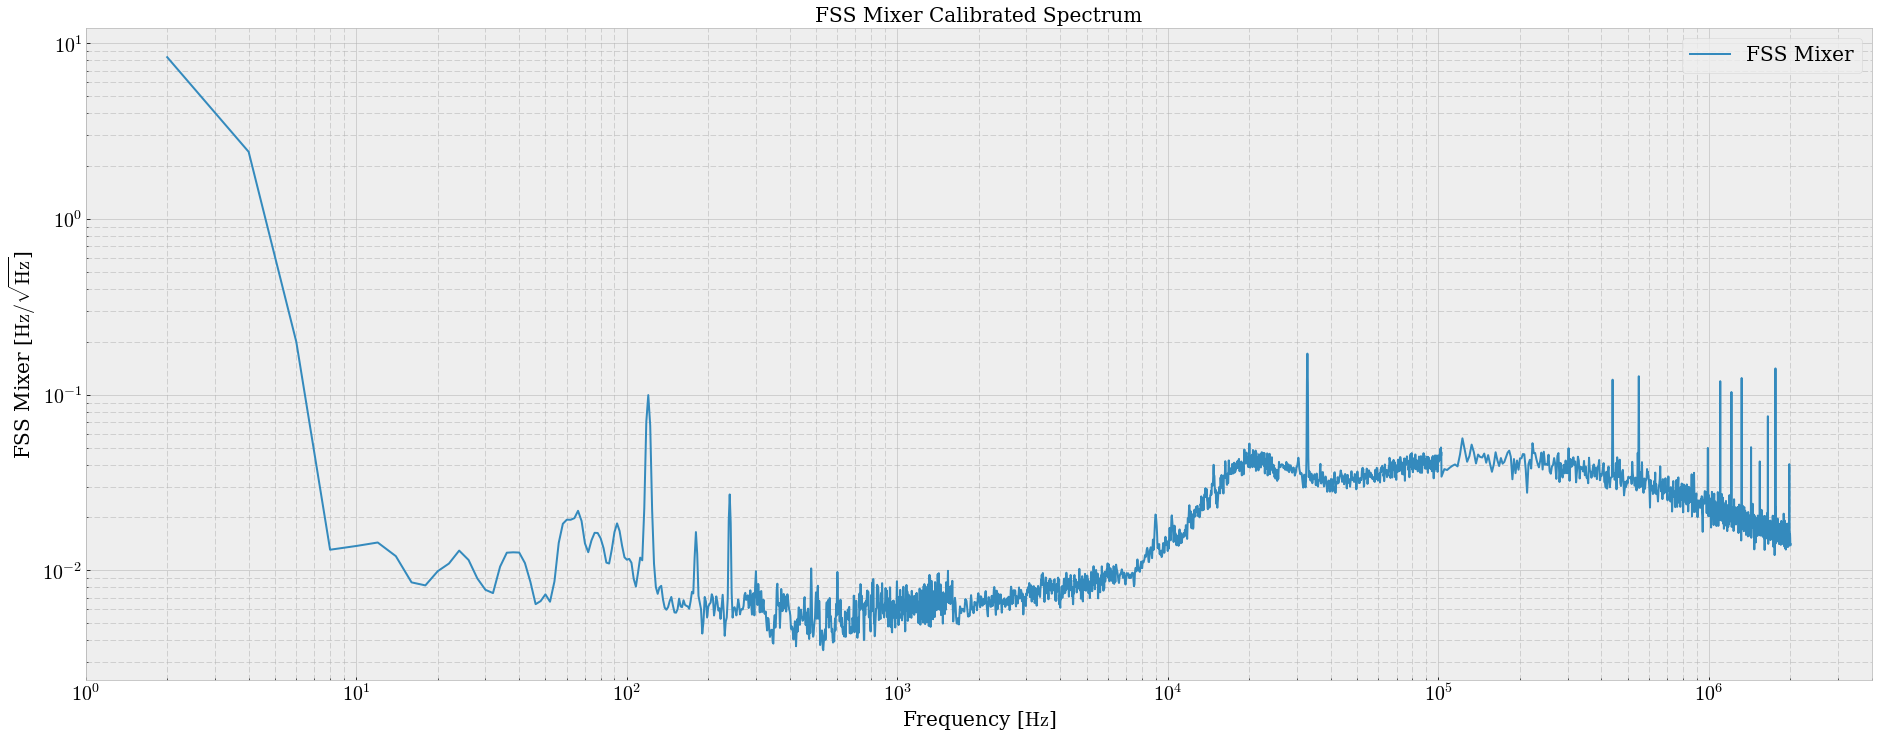
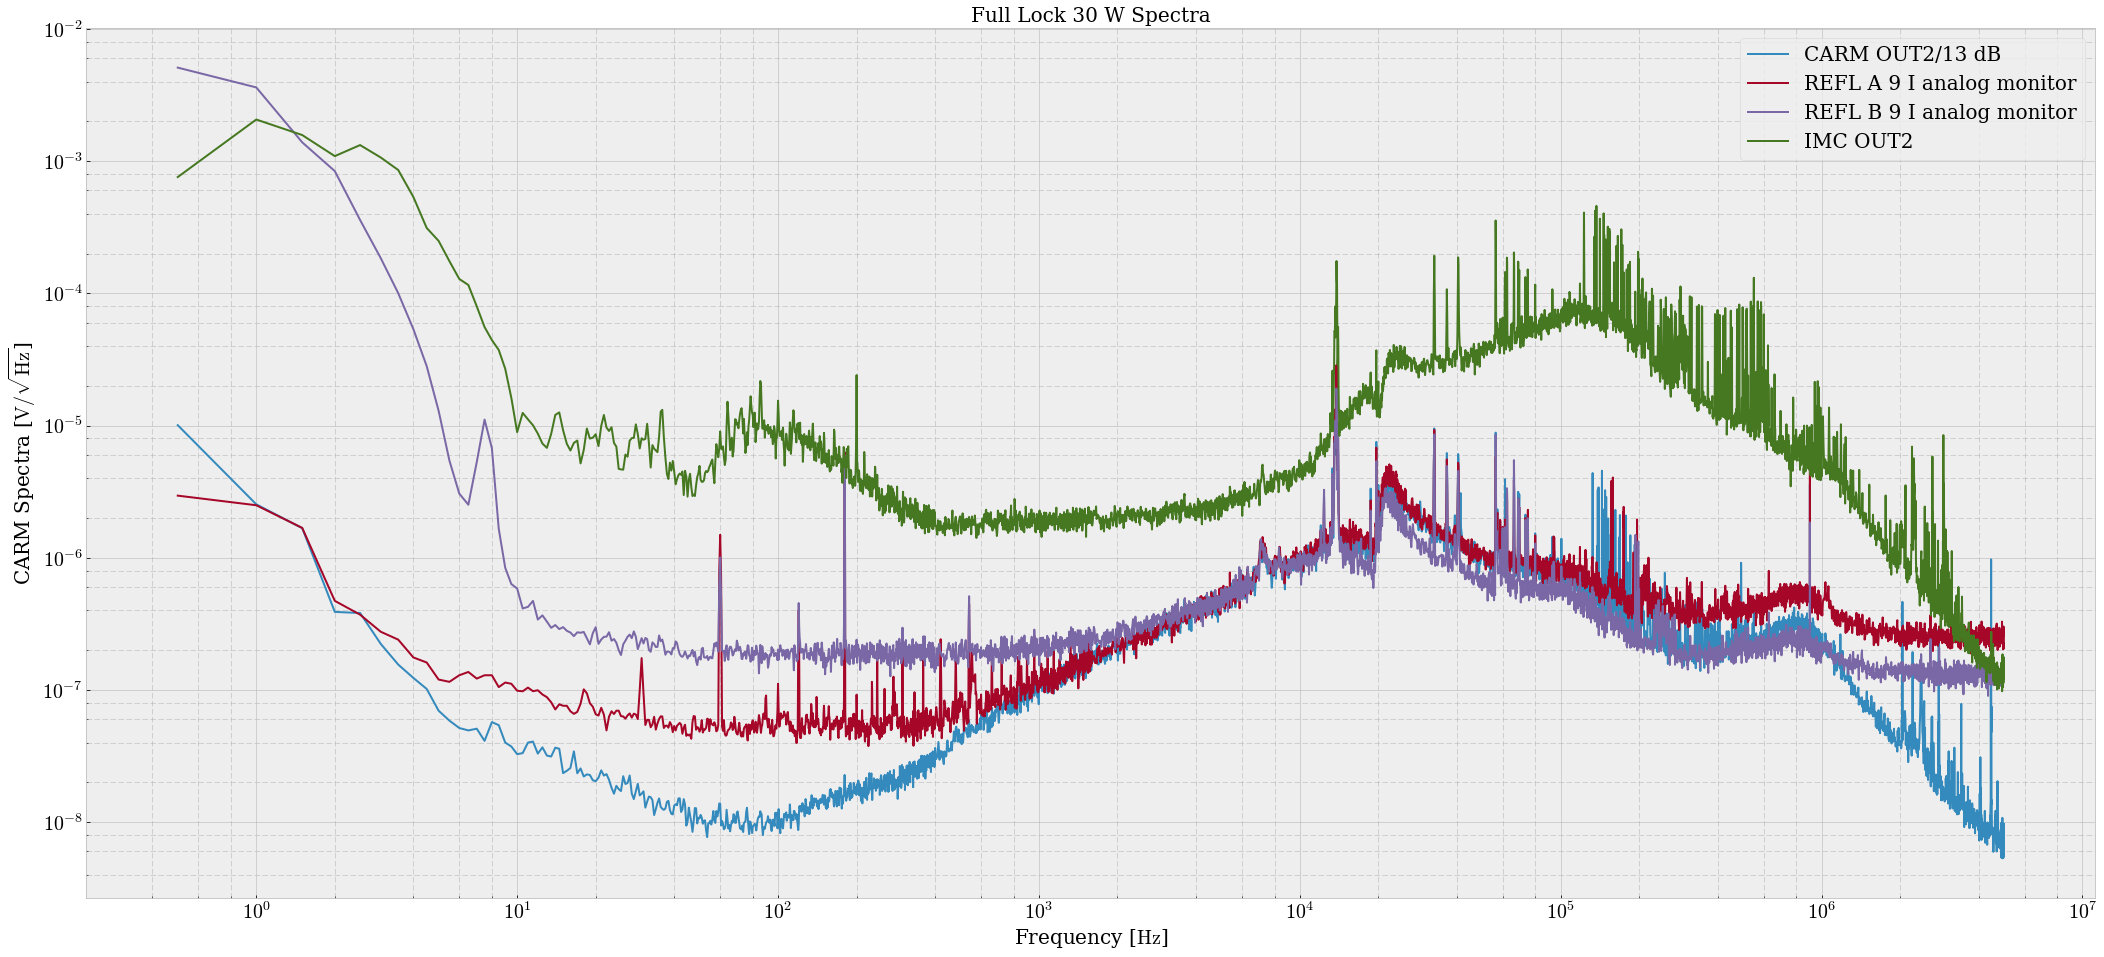
Sheila, Keita, Jenne, Daniel, Georgia, Craig Today we have been having issues powering up due to large glitches in the CARM loop when lowering the IMC fast gain. This has not been an issue in the recent past, and no changes have been applied to the CARM or IMC loops since the 6 dB gain redistribution back in January. We measured the IMC OLG in it's former nominal configuration (OLGs in attachment 1, nominal configs pictured below in attachments 2 and 3). There was a feature at 150 kHz causing a second UGF in the IMC OLG in it's nominal configuration. When we increased the FSS Common Gain, the feature was suppressed. (Attachment 1) Changing the FSS Fast Gain did not change the 150 kHz feature. (Attachment 4) We increased the FSS common gain from 20 dB to 28 dB, and the FSS fast gain from 9 dB to 15 dB. This suppressed the glitches associated with the IMC fast gain slider changes during INCREASE_POWER, and we were able to power up to 30 W. We suspect that the FSS common gain somehow fell significantly over the past week, causing some small feature in the FSS loop to approach a gain of 1, causing excessive oscillations in the IMC around 150 kHz, eventually leading to locklosses due to powerup gain slider glitches. More investigation into the FSS is required to understand if the FSS gain really fell, and why. Relevant alogs: Peter King's last FSS OLG measurement (400 kHz UGF) August 2018 test of the FSS common gain setting August 2018 test of the FSS fast gain setting Recent 2W IMC and CARM OLGs (with old FSS settings) Relevant spectra: Latest FSS Mixer Error Spectrum (alog 46631) Latest CARM and IMC Error Spectra (alog 46635)
Some other notes from locking today:
Some other brief locking note from tonight:
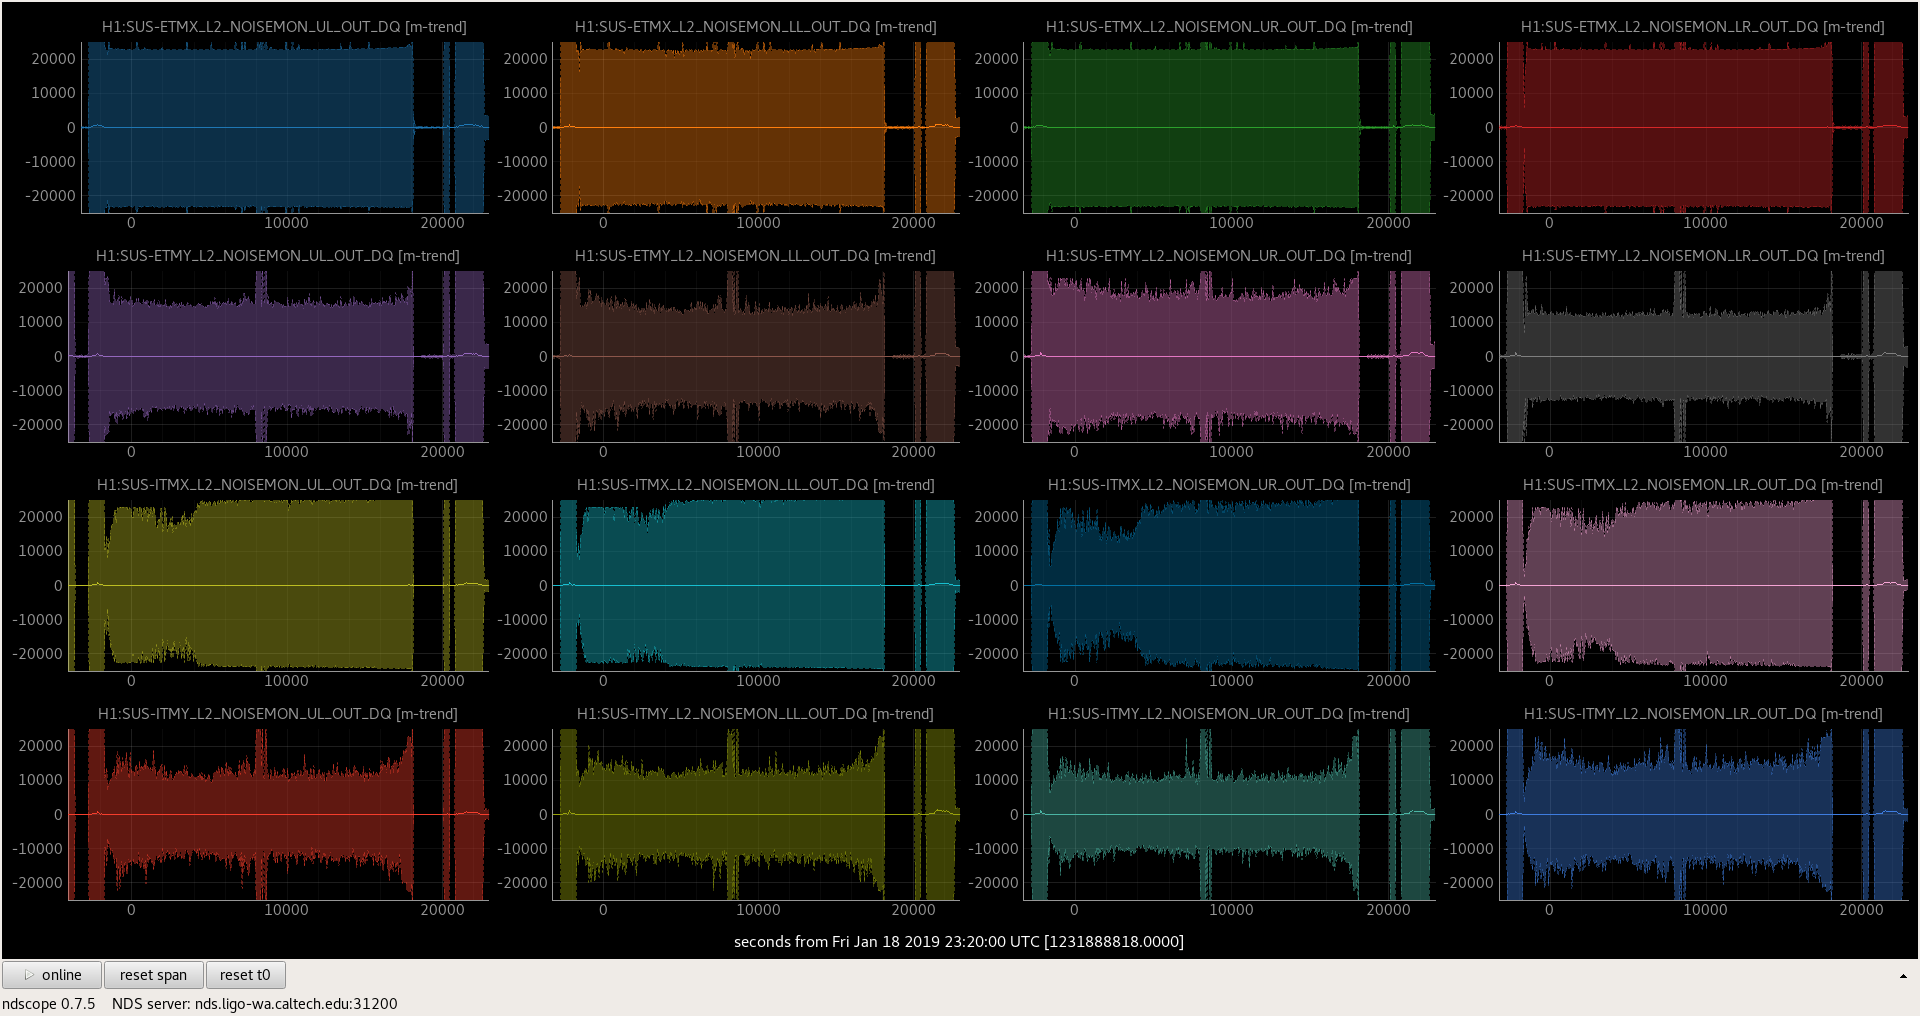
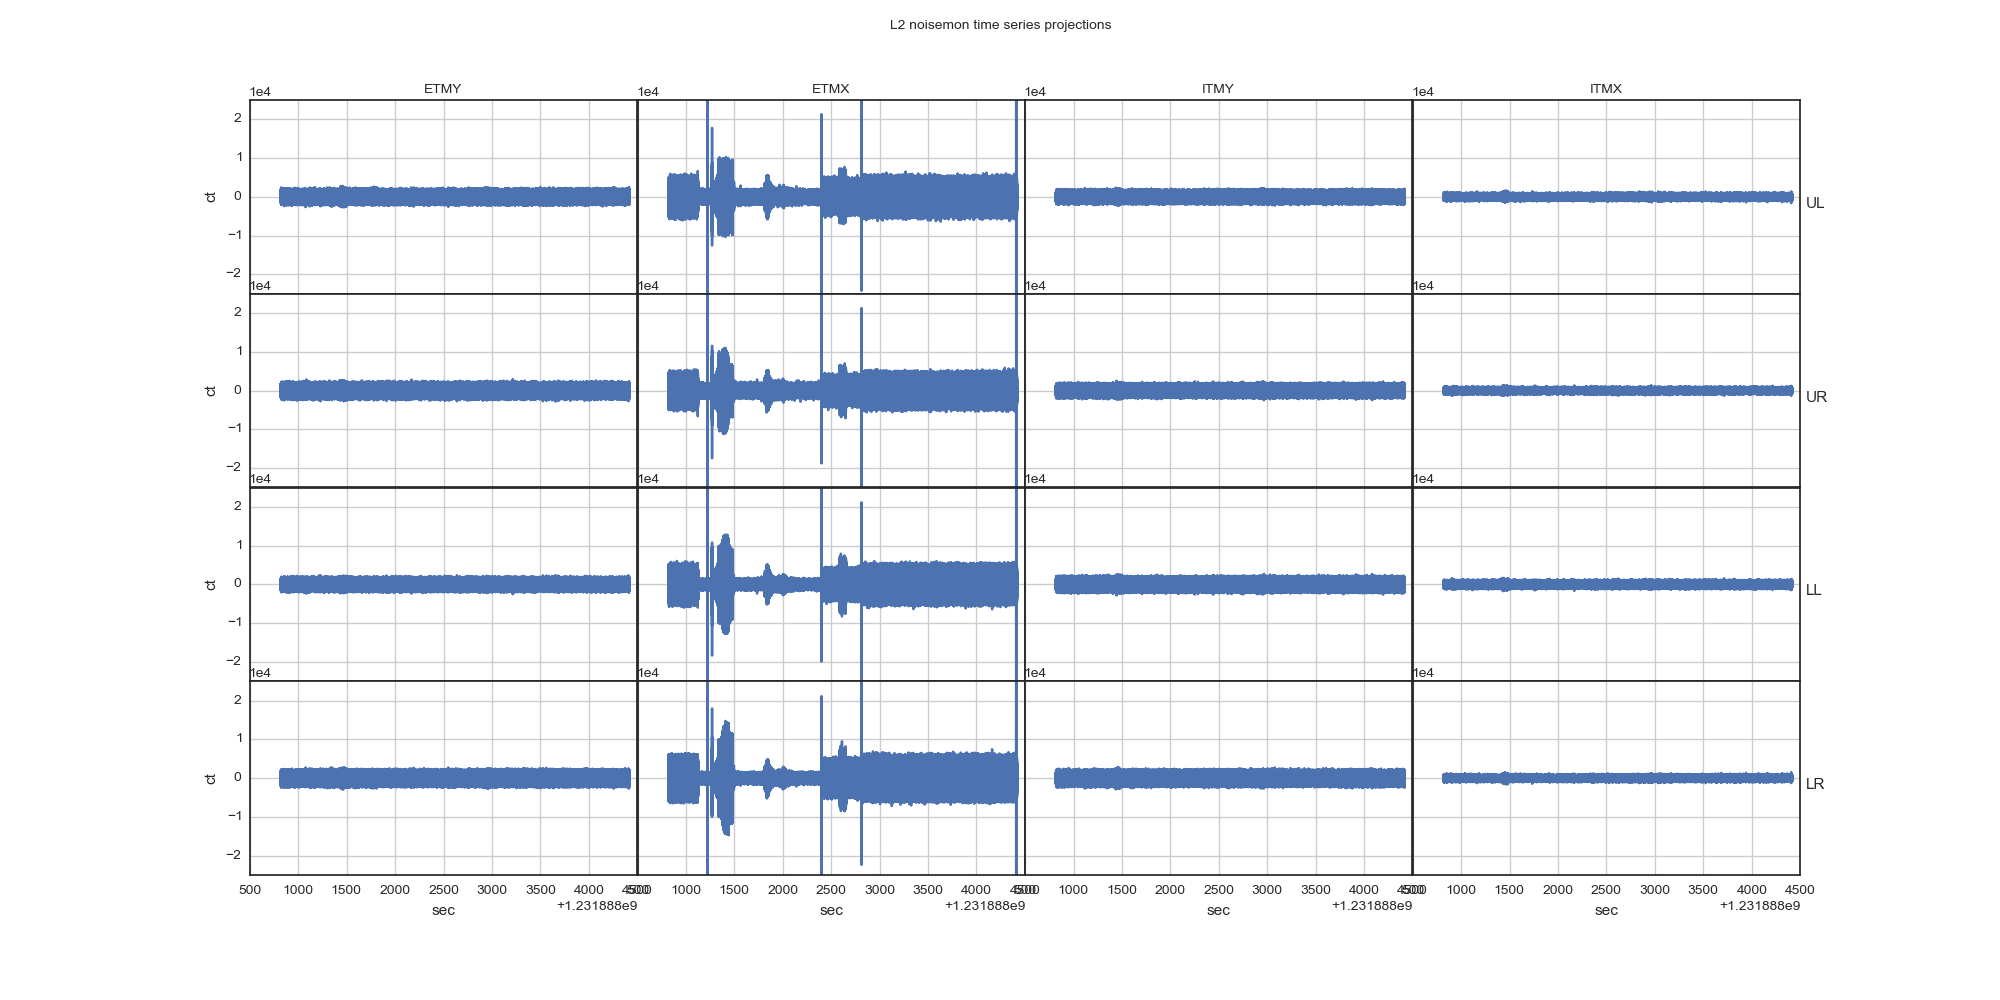
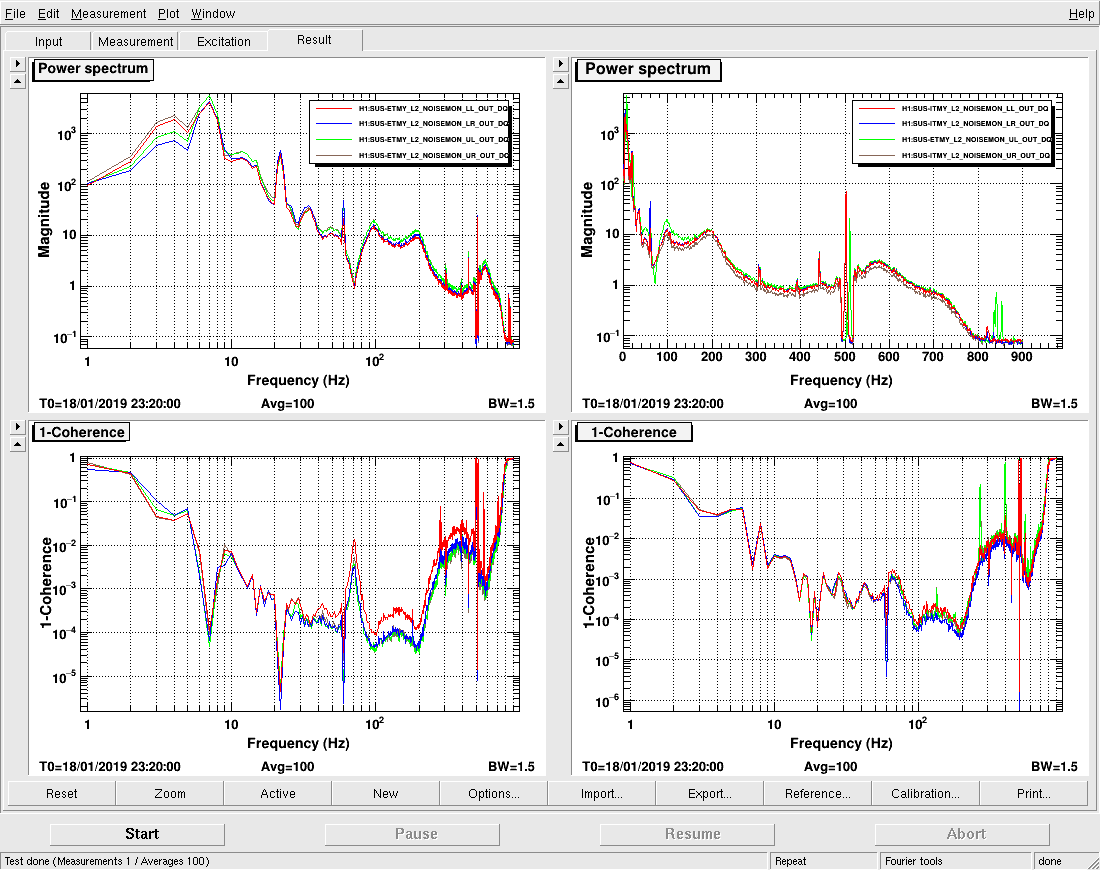
I looked at signals from the suspension noise monitors in the H1 PUM coil drivers, to see if they typically saturate during lock (result: yes they do), and to see if Duo Tao's monitor board redesign would substantially improve the situation (result: yes it would).
Attachment 1: signals from the existing noisemons, recorded during a Jan 18 lock. Not all, but about half of them are exhibiting saturation (which sets in at ~25000 ct).
Attachment 2: projected output of the new board with the same drive signals. The projection was made using the recorded MASTER_OUT data, filtered with the known transfer function through the new board (with the coil driver in state 1), as well as the coil driver's "LP" filter (necessary because the drivers actually run in state 3, which is the most aggressive dewhitening).
Attachment 3: since the noisemons on ETMY and ITMY were not continuously saturating, I ran a quick check of their coherence with the drives. It revealed excess noise in the ETMY L2 LL channel. This is unlikely to be a problem for the H1 DARM sensitivity, due to the state 3 dewhitening. But it lets us improve the estimated fault rate to 2 out of 12 (counting also the L1 ETMY PUM channels previously measured).
TITLE: 02/15 Day Shift: 16:00-00:00 UTC (08:00-16:00 PST), all times posted in UTC
STATE of H1: Commissioning
INCOMING OPERATOR: None
SHIFT SUMMARY:
16:00 (8:00) Start of shift
18:54 (10:54) Nutsinee to ISCT6
18:57 (10:57) Nutsinee out of LVEA
21:22 (13:22) Danny, Sheila to PSL enclosure -- investigate excitations on CM board
21:42 (13:42) Danny, Sheila back from PSL enclosure
21:52 (13:52) Gerardo to MY -- look at ion pump for shipping
22:36 (14:36) Gerardo back from MY
00:00 (16:00) End of shift
TITLE: 02/14 Day Shift: 16:00-00:00 UTC (08:00-16:00 PST), all times posted in UTC
STATE of H1: Commissioning
INCOMING OPERATOR: None
SHIFT SUMMARY:
13:00 (5:00) Peter to PSL enclosure -- refcav tweak
14:06 (6:06) Peter out of PSL enclosure
16:00 (8:00) Start of shift
16:08 (8:08) Richard to MY -- pick up shovel
16:30 (8:30) Peter to PSL enclosure -- turn off make-up air fan
16:40 (8:40) Peter back from PSL enclosure
17:50 (9:50) Corey to refill TCS chillers
18:05 (10:05) Corey back from TCS chillers
18:13 (10:13) Robert to LVEA -- pick up coil
18:21 (10:21) Robert to EX
18:22 (10:22) Nutsinee to ISCT6
18:31 (10:31) Chandra to MY -- VAC work
18:39 (10:39) Nutsinee out of LVEA
19:34 (11:34) Chandra back from MY
20:55 (12:55) Robert back from EX
22:00 (14:00) Leaving early due to weather conditions
Currently displayed chiller operating hours: diode chiller: 8512 hours crystal chiller : 8486 hours The counter was reset to 41 hours for both chillers to coincide with when the laser was brought back online.
Jenne, Sheila, Keita, Jamie, Danny
Before leaving early because of the weather, we did a little bit of interferometer locking.
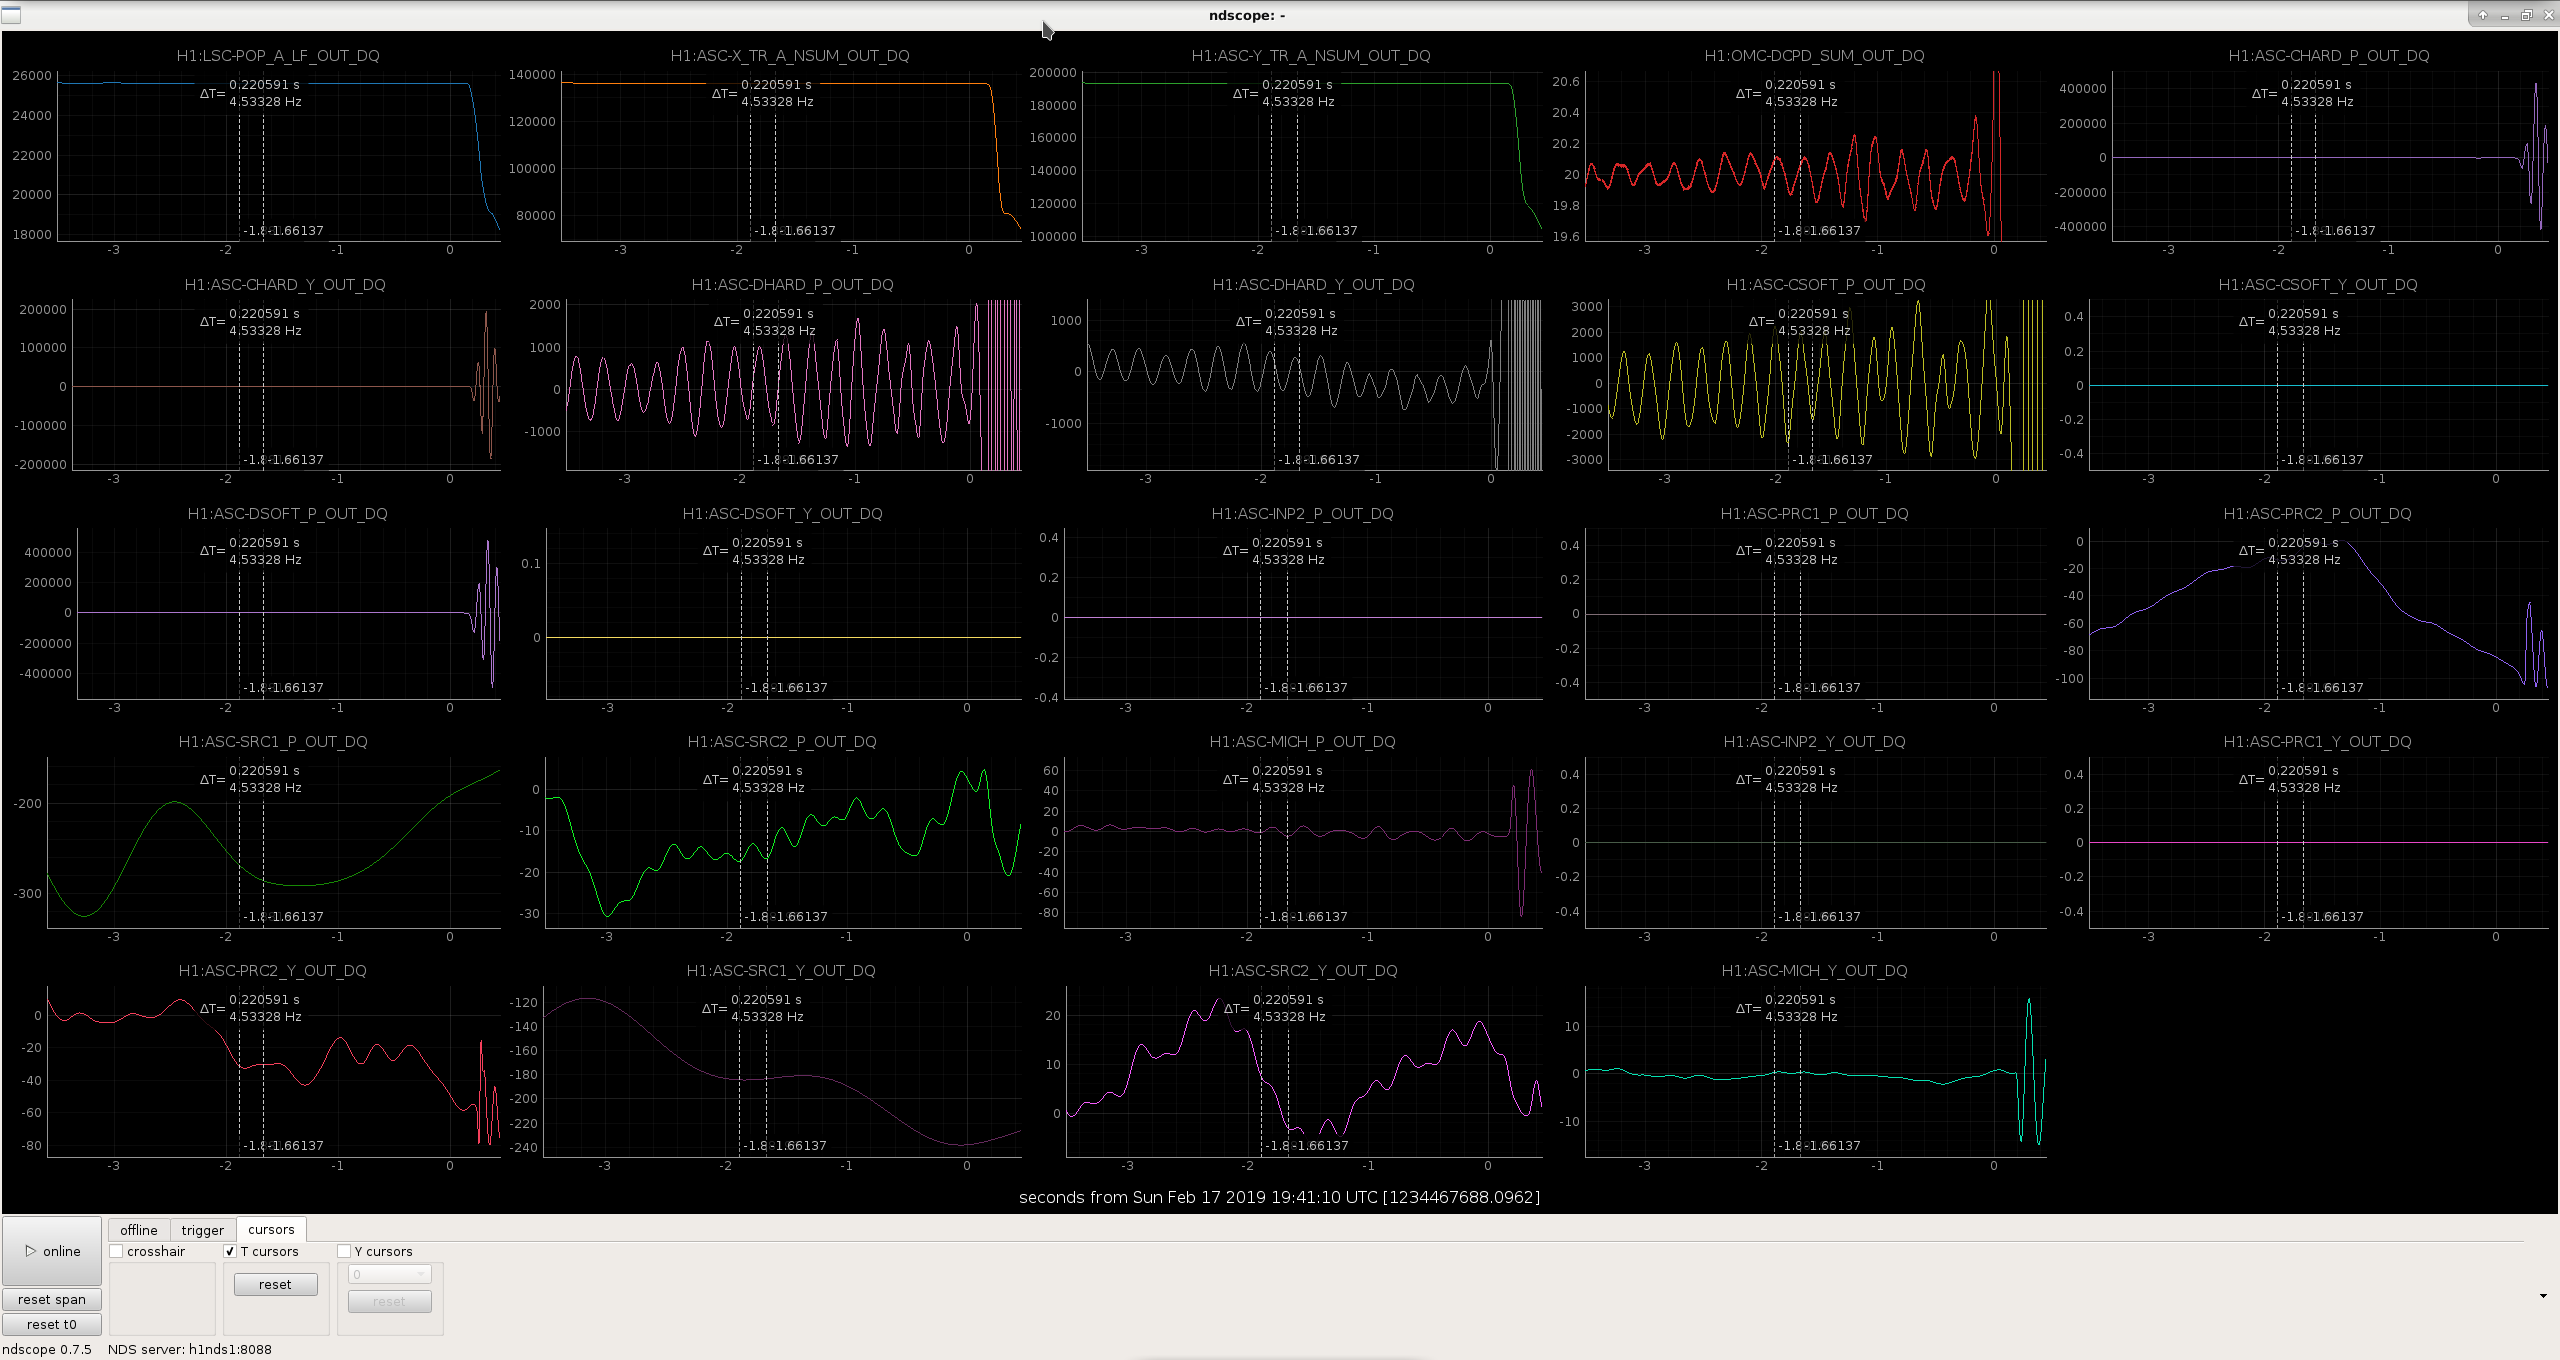
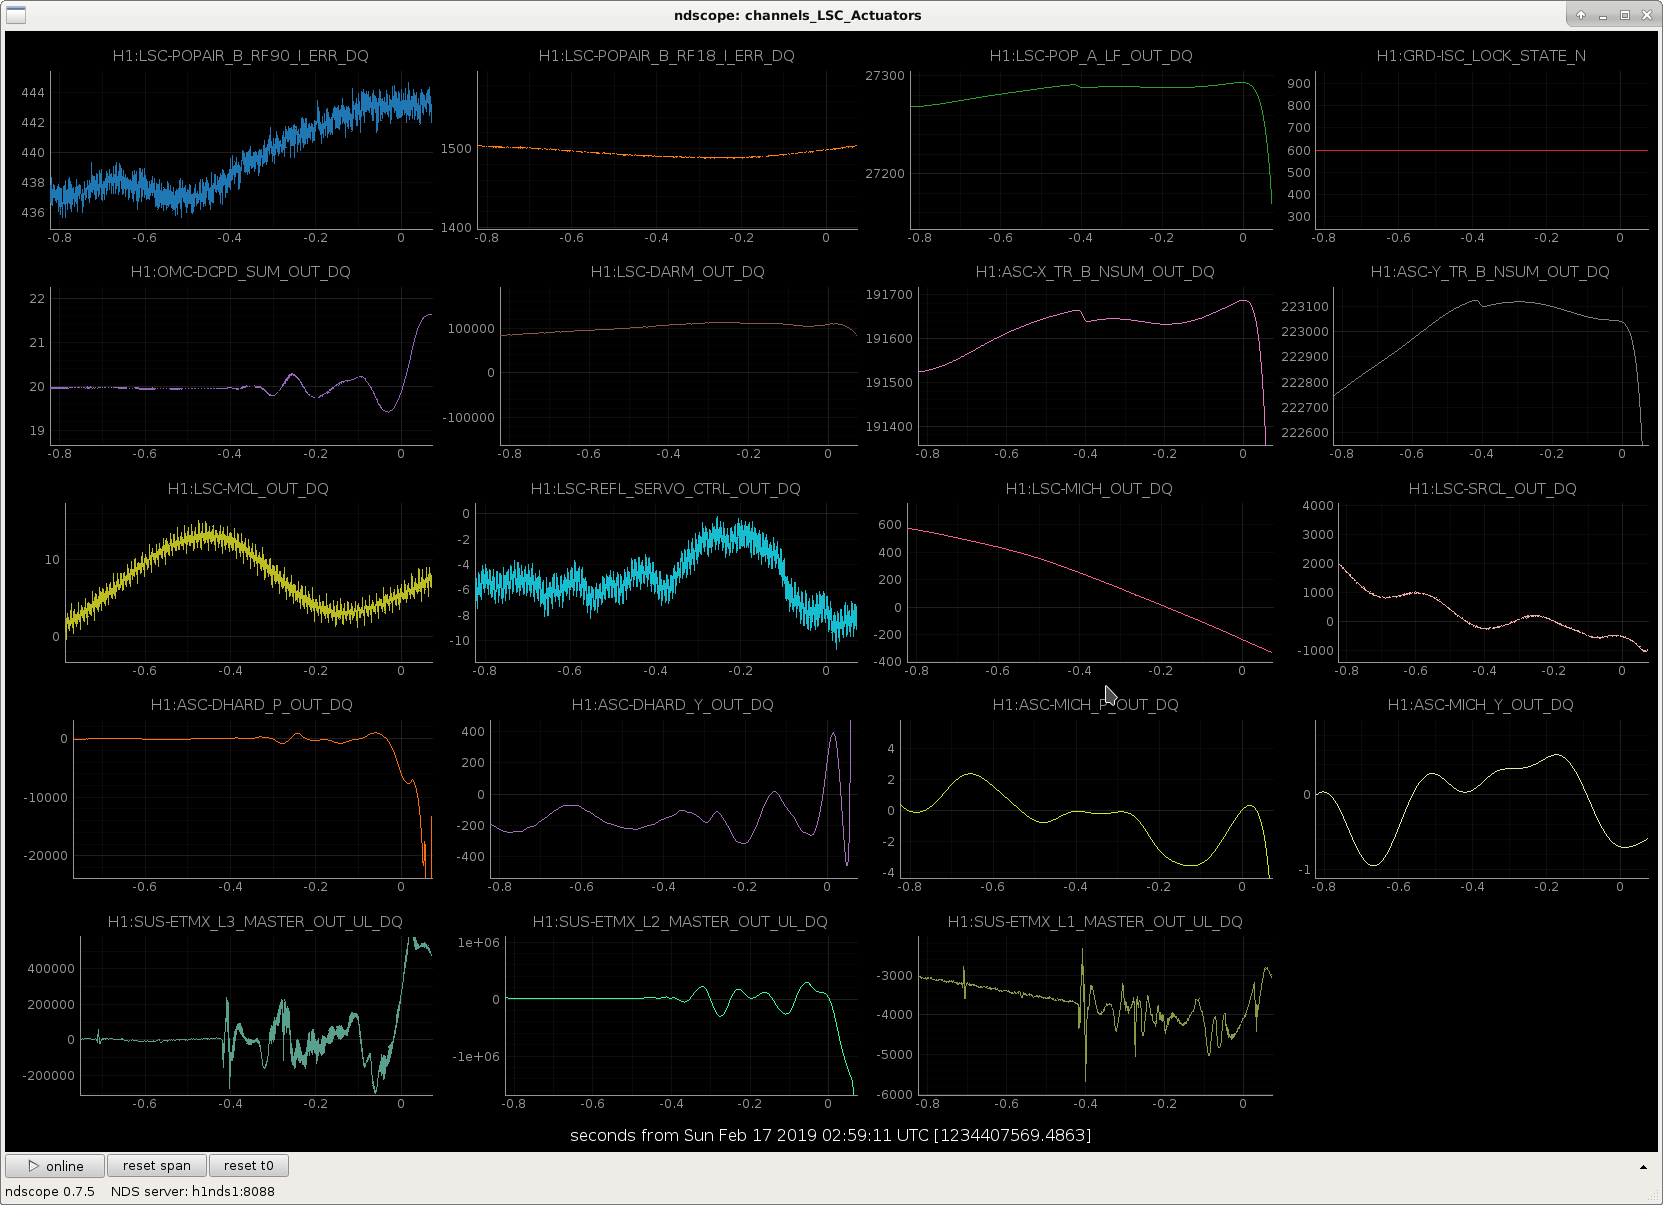
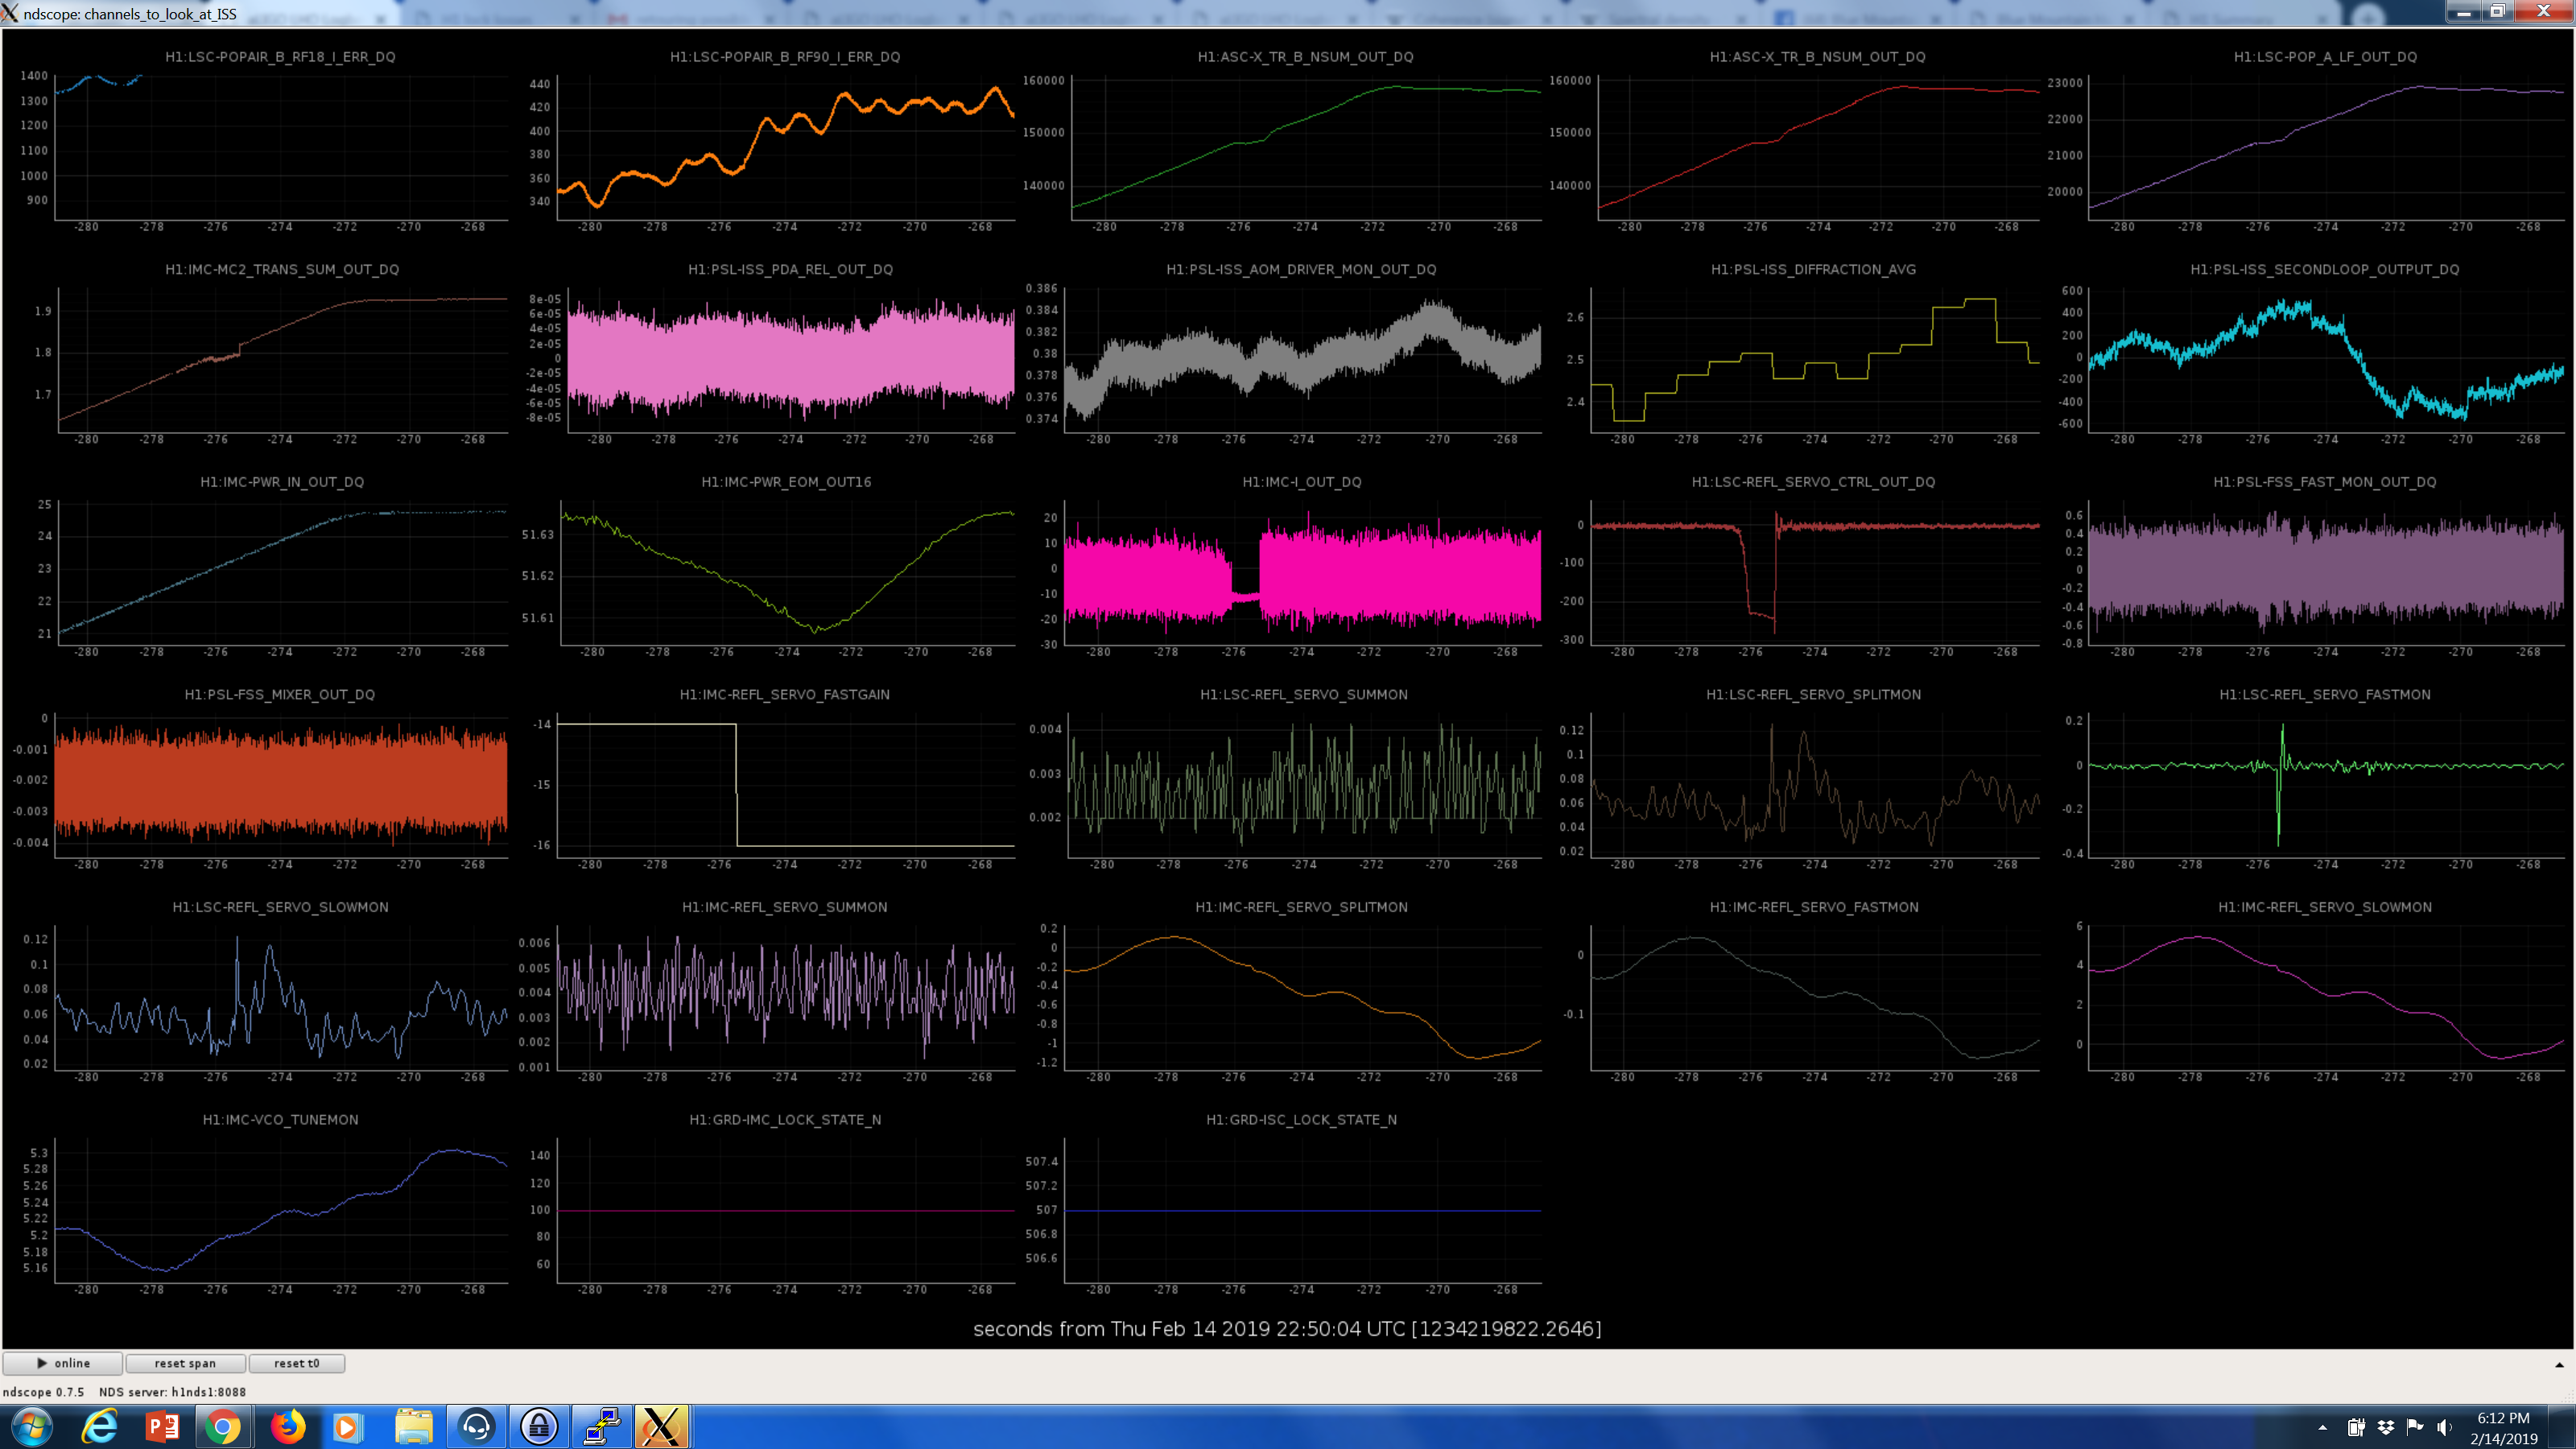
We had one chance to try powering up today before getting off site, we actually did survive the power up but the large glitches were visible. (Attached plot). That lock was lost in the step LOWNOISE_LSC which is engaging the LSC feedforward, although it looks like the large pitch drive which saturated ETMX L2 starts earlier, when we are switching DARM control back to ETMX with the ESD in low noise. 1234219824
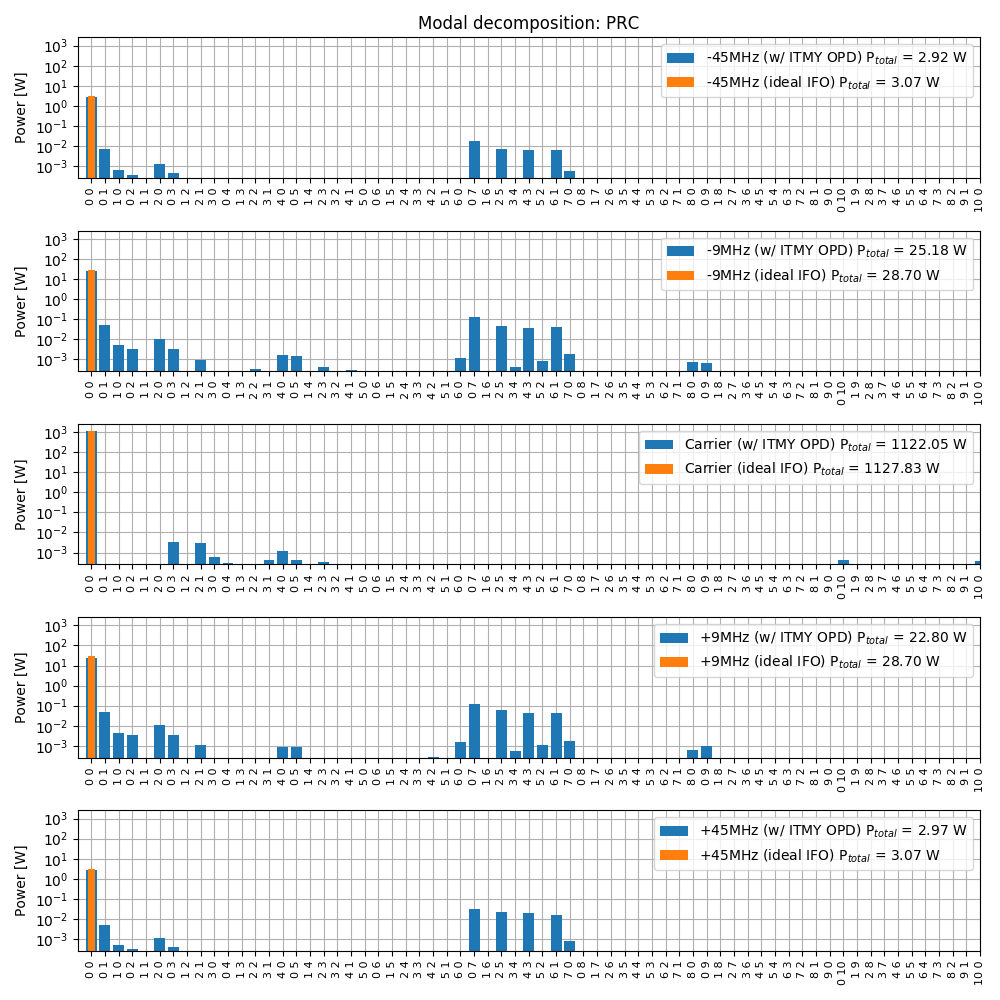
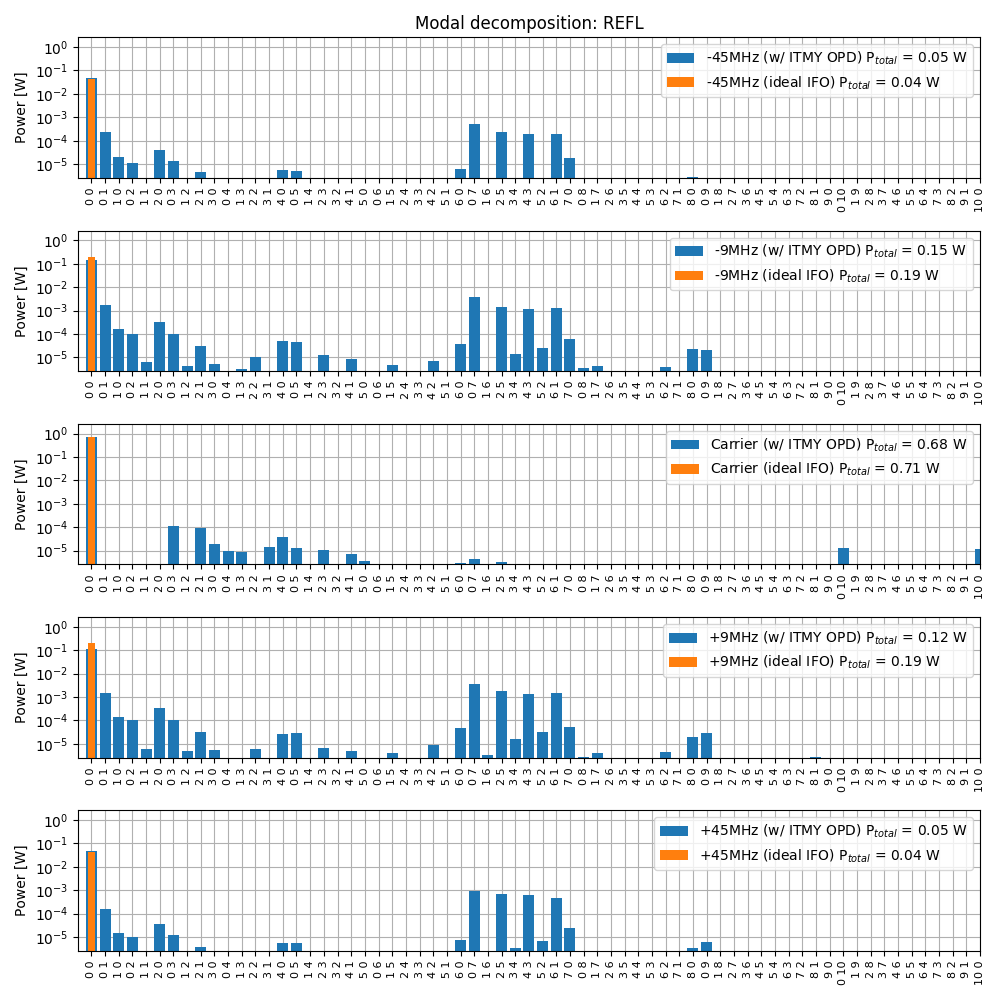
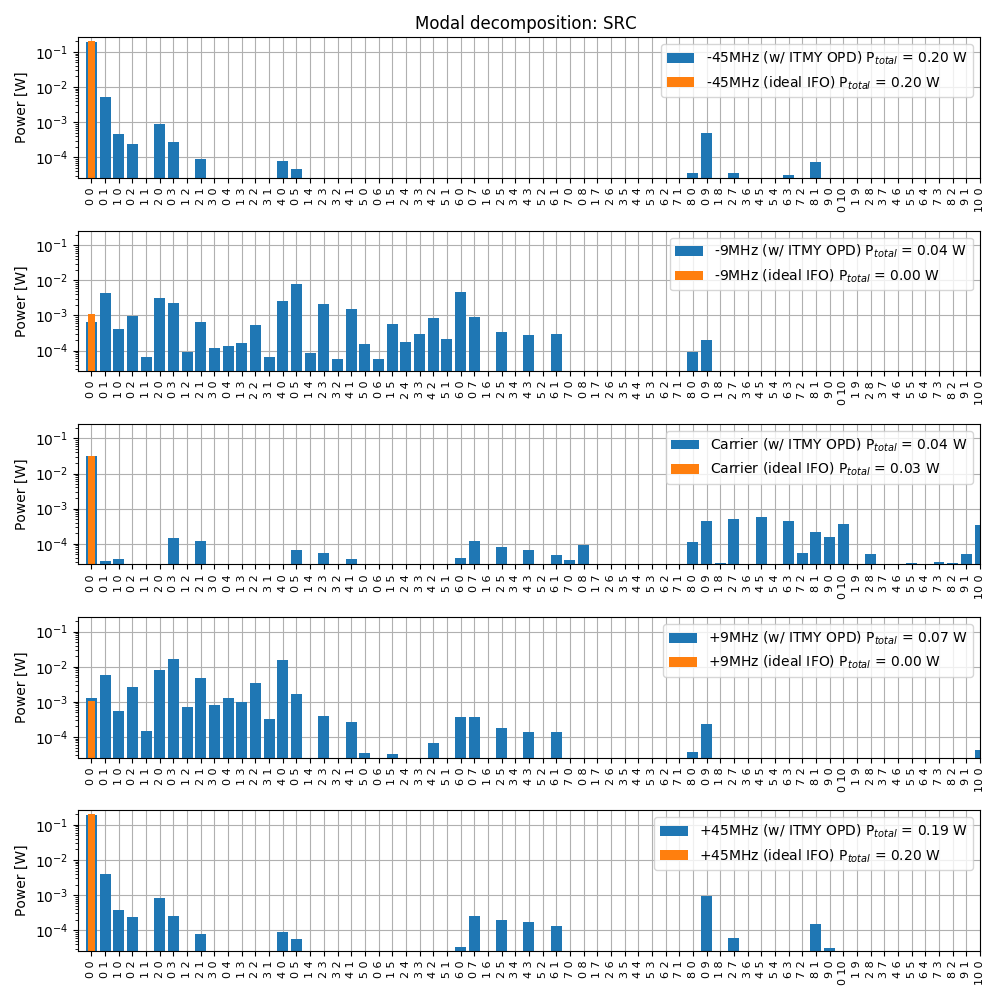
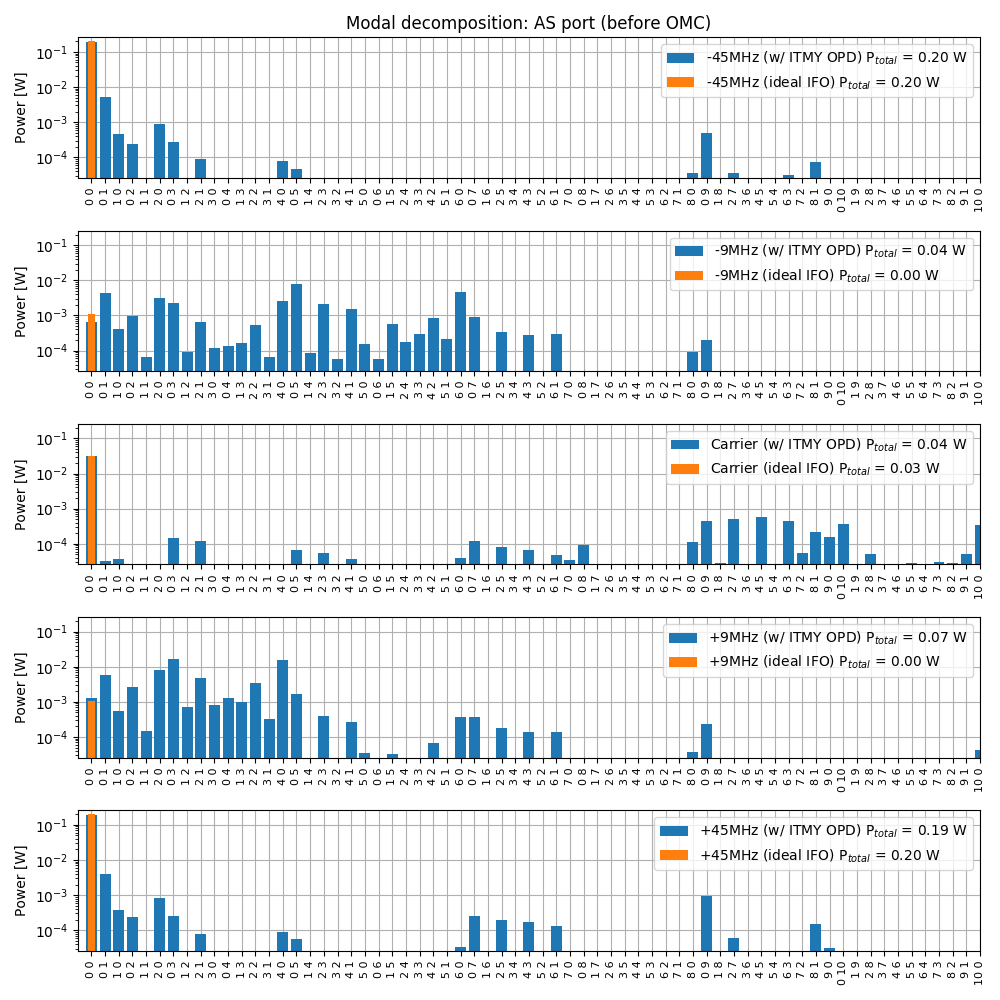
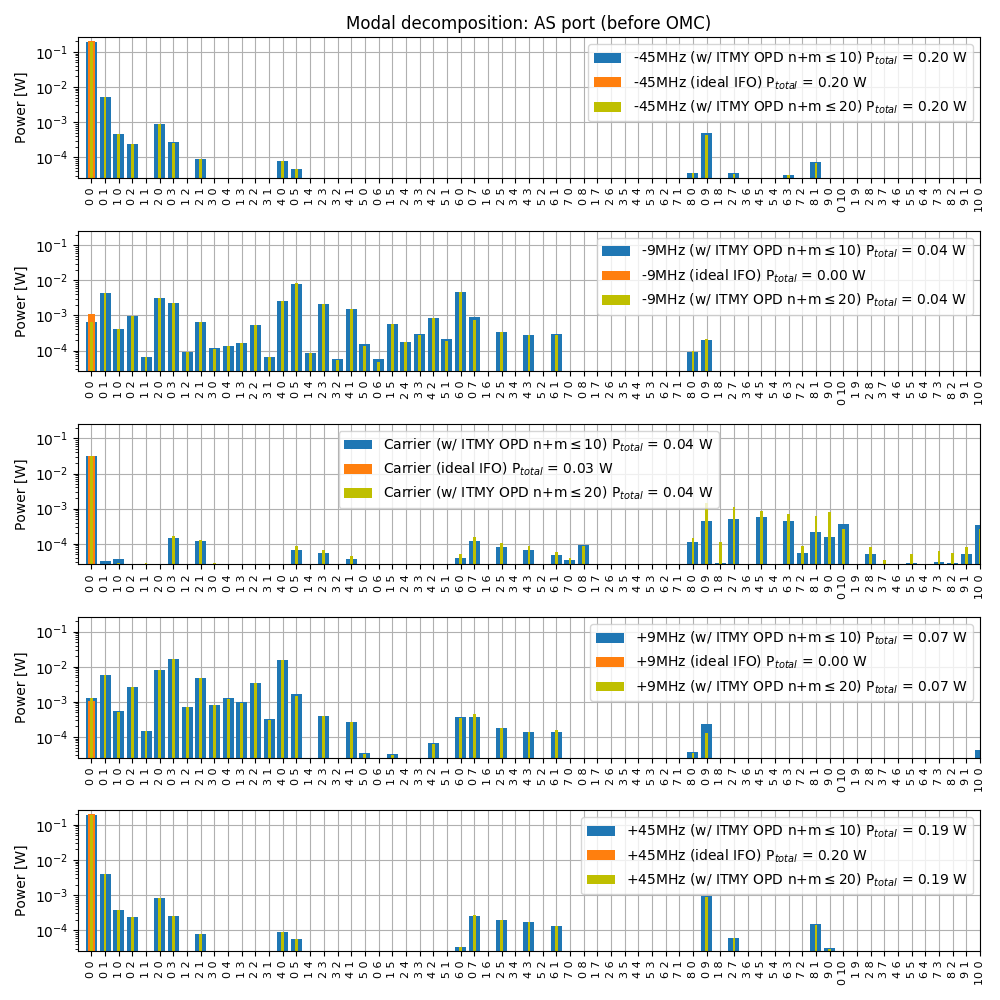
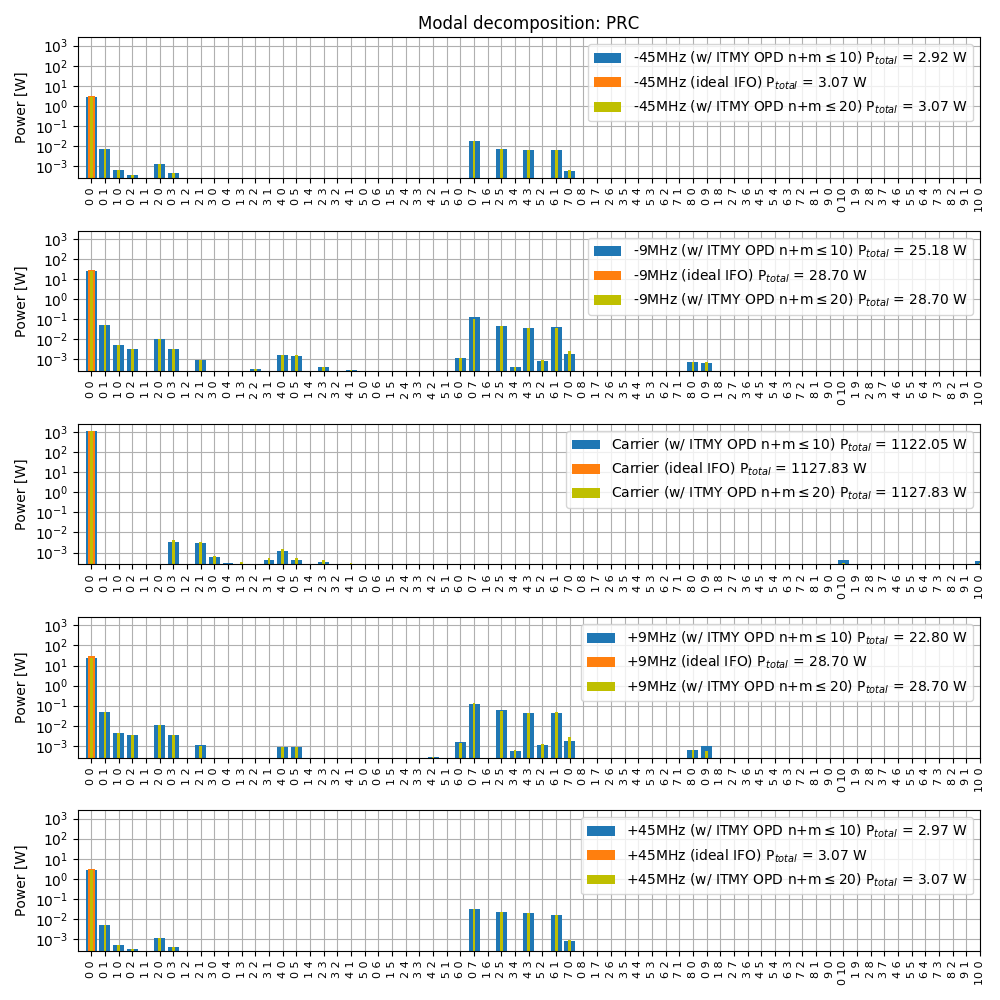
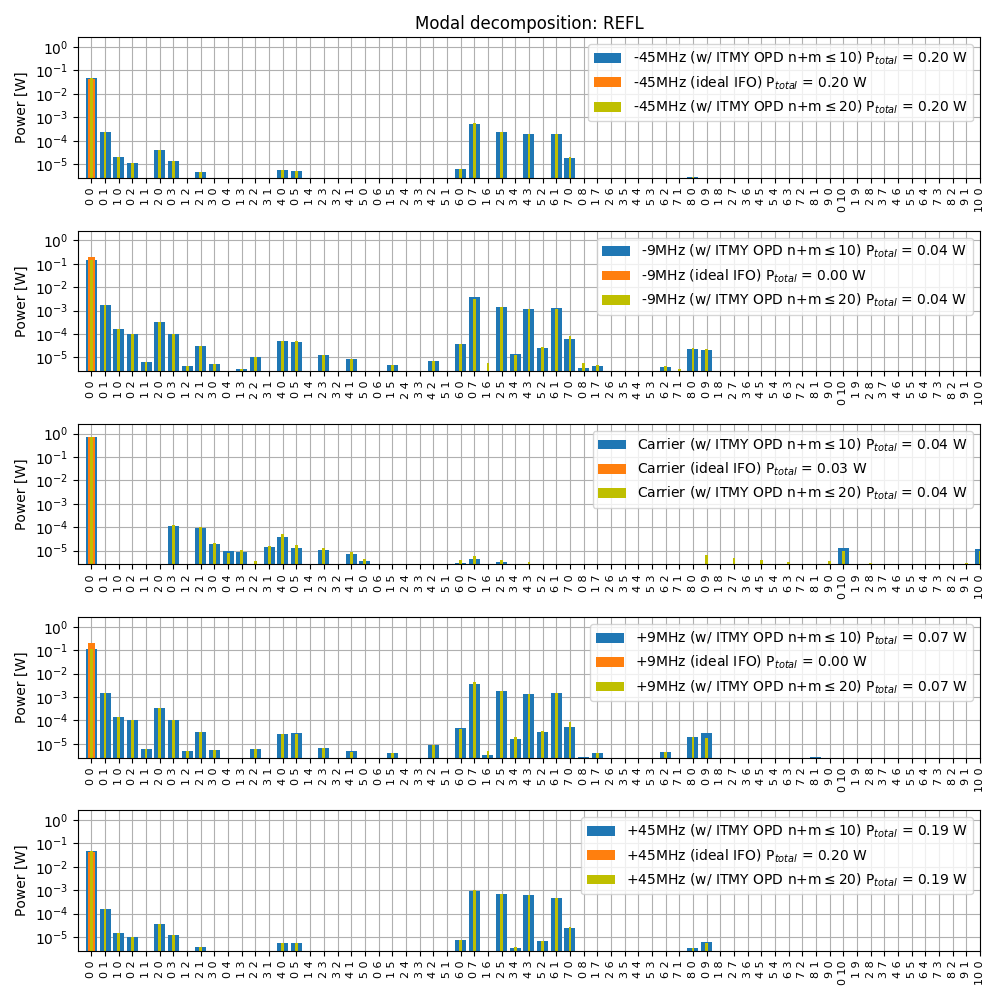
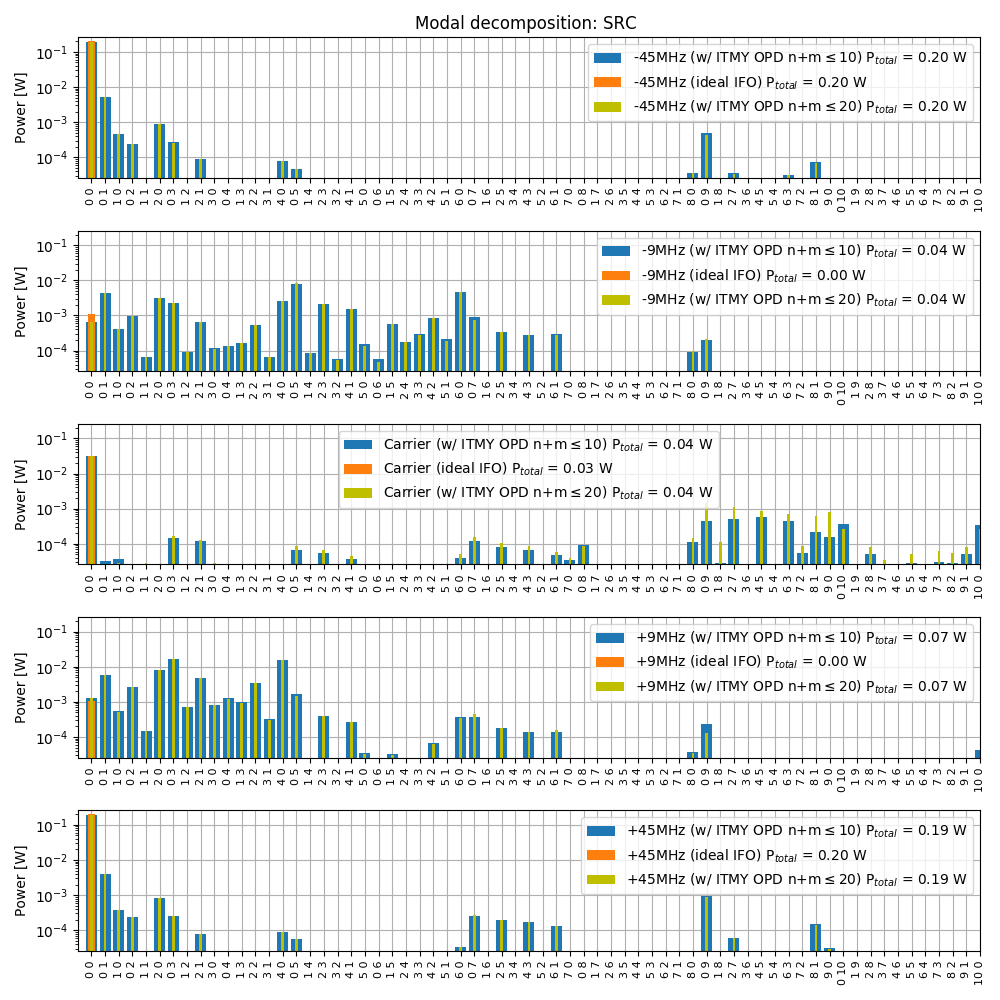
Using the optical path distortion measured by the HWS (provided by Aidan, see also 46127 and 46888) I simulated the mode content at various ports in a dual recycled Fabry-Perot Michelson interferometer. The simulation is done with MIST, using Hermite Gauss modes up to order 10, and locking the interferometer using simulated error signals.
Only the optical path distortion in the ITM is included, there is no deformation of the HR surface.
Each of the attached plots show the distribution of power into each modes, assuming 26 W of input power, 60ppm or round trip losses per arm. The orange traces are there for comparison, to show that in a ideal IFO, all power is in the fundamental TEM00 mode.
Interestingly, the point absorber seems to create some 9MHz sideband power in modes of order 9 at the AS port, which we believe are the culprit for the high RF9 modulation noise coupling.
Nice.
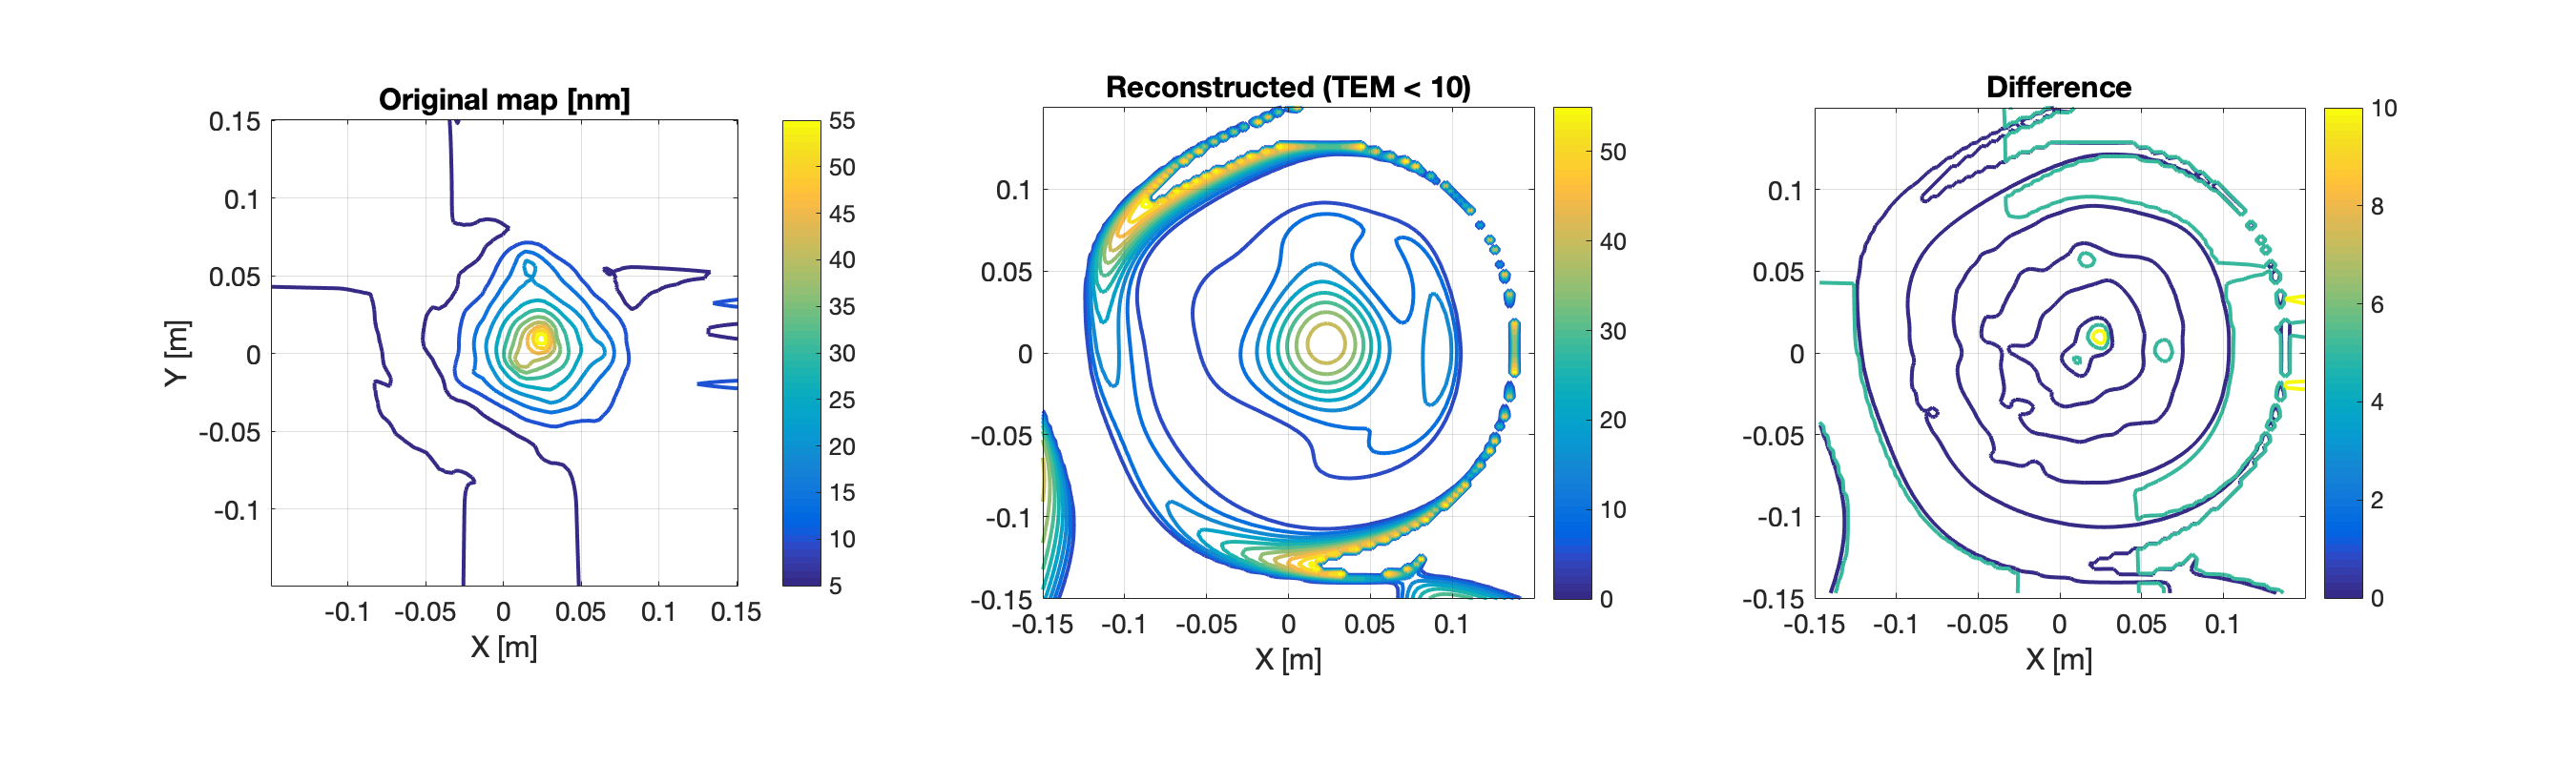
Can you post a comparison of the original wavefront distortion, the 10-th order reconstruction with HG modes and the difference between them?
Aidan, there it is. Left the original single pass map, in nm. Center the map reconstructed from the simulation (take the ratio of the beam transmitted by the substrate over the beam at the input of the substrate, then take the phase, rescale with lambda/2/pi). Right the difference. Clearly the reconstructed map is no good for radii larger than 7-8 cm, since there is no significant laser power there.
The difference shows also that Hermite Gauss modes up to n+m<=10 are not quite enough to really capture the high spatial frequency feature at the absorber (since there's a residual peak there).
FYI.
Wavefront maps are available here: https://ldas-jobs.ligo.caltech.edu/~aidan.brooks/
They're not yet calibrated for the incident power but the general shape is clear and the GPS times are included.
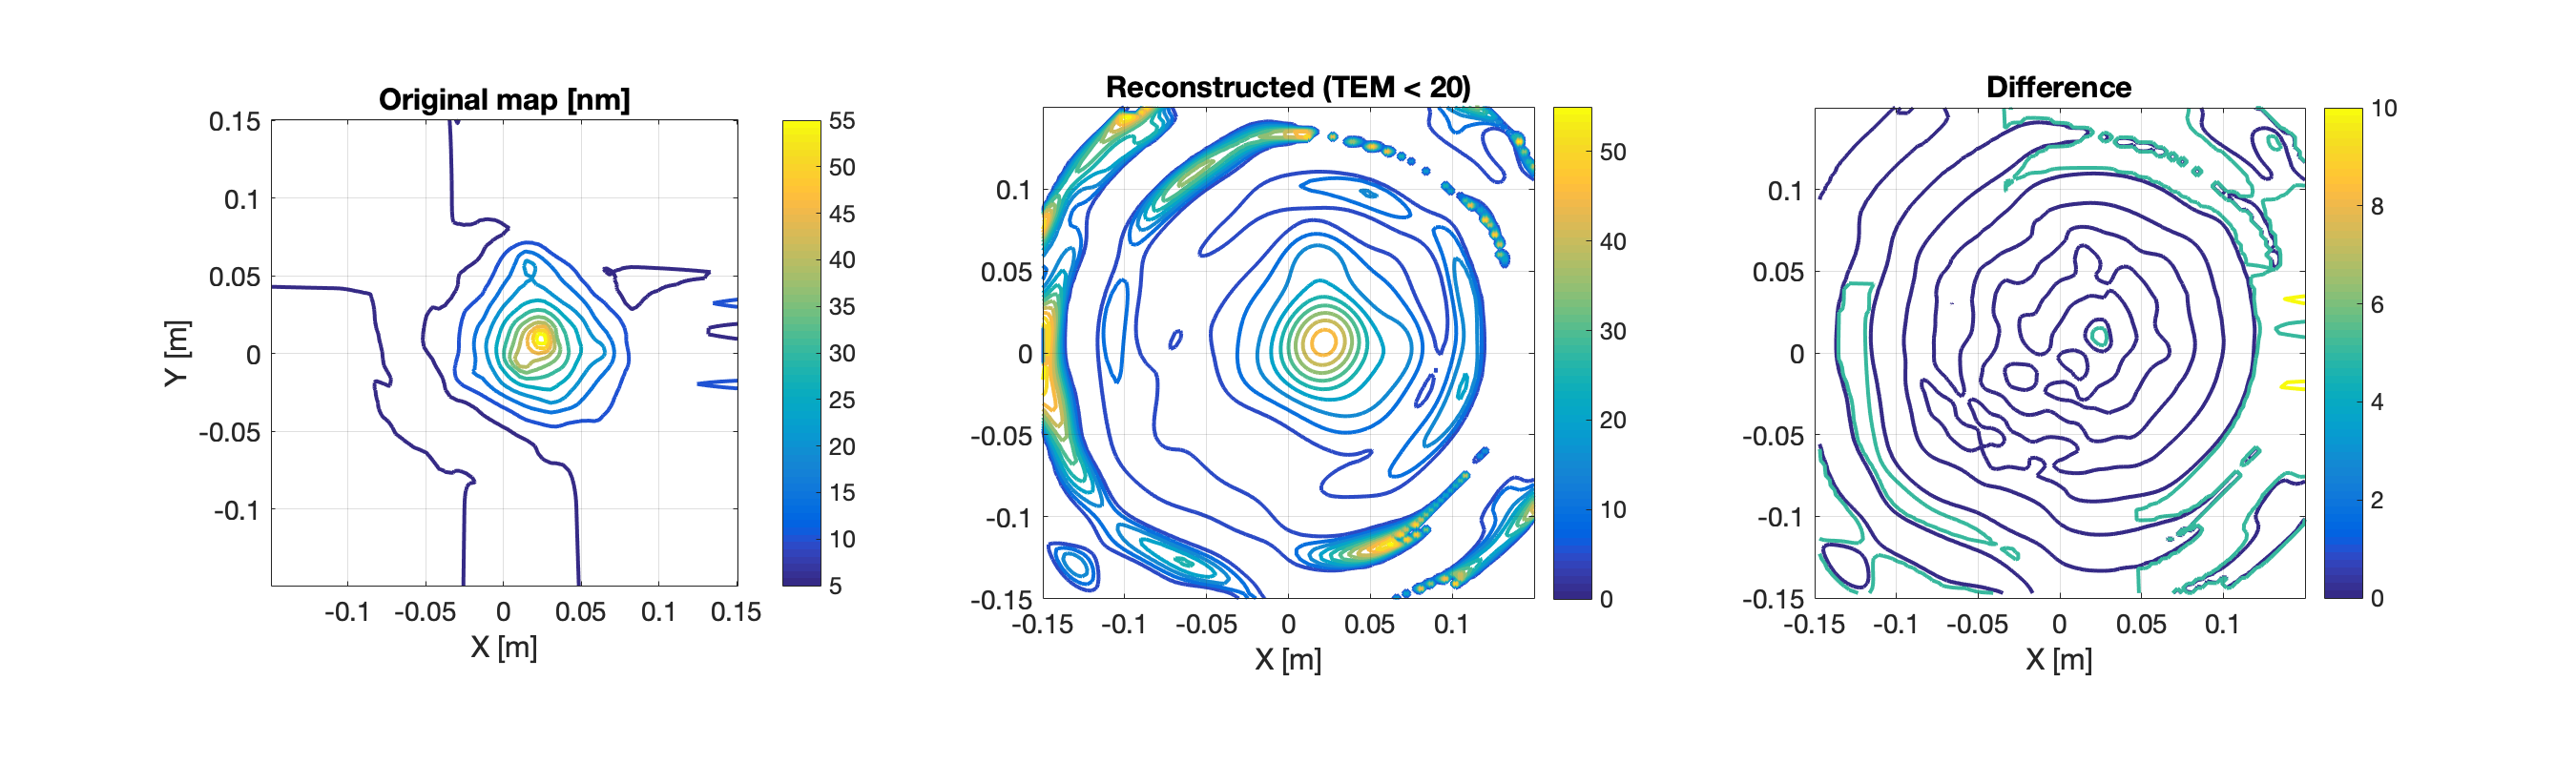
Using Hermite Gauss modes up to n+m<=20 do not change significantly the mode content for the sidebands. There is however a larger amount of carrier power at the AS port for modes of order 8-10.
[Rana, Jamie]
We spent the evening trying to get more measurements of the 9MHz RIN situation, basically redoing what was done in LHO log 46586. We went to ITMY single-bounce and locked OMC on carrier, then went to PRMI and locked OMC on 9MHz. I'll post plots tomorrow.
FYI the OMC and PRMI configurations might be a little bit funky. We didn't get to reset everything yet to get back to low noise, just in case any one tries to brave the snow to get back out here.
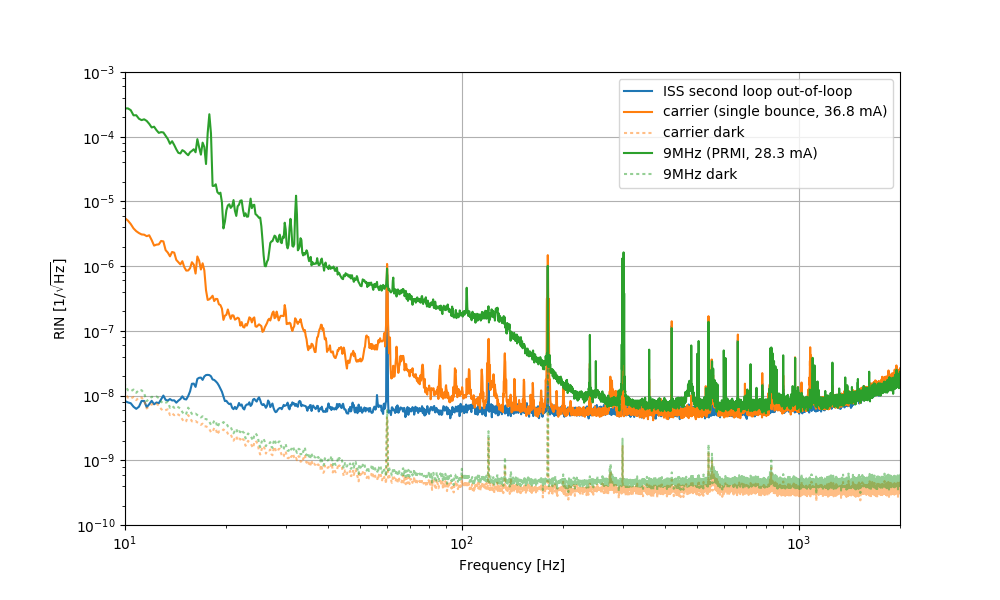
Friday night Rana and I re-measured the relative intensity noise (RIN) in the carrier and 9MHz sideband at the OMC DCPD. We believe we got a lower noise measurement (first attachment) than what Craig and Koji measured previously (LHO 46586) by:
For the carrier measurement used single bounce off of ITMX with 25W input, and for the 9MHz used PRMI (where the 9MHz sideband is largest) with 35W input.
We don't see any excess RIN in the 9MHz above 300 Hz.
1233733816 carrier measurement 1233738050 9MHz measurement 1233738400 dark noise measurement
1) the carrier RIN in your plot at 30 Hz is in the 1e-7 region. Do we believe this excess above the ISS second loop measurement and above the noise floor? Or is it OMC length noise?
I’m asking because a RIN of 2e-7 is what we need to be limiting DARM, see https://alog.ligo-wa.caltech.edu/aLOG/index.php?callRep=46759
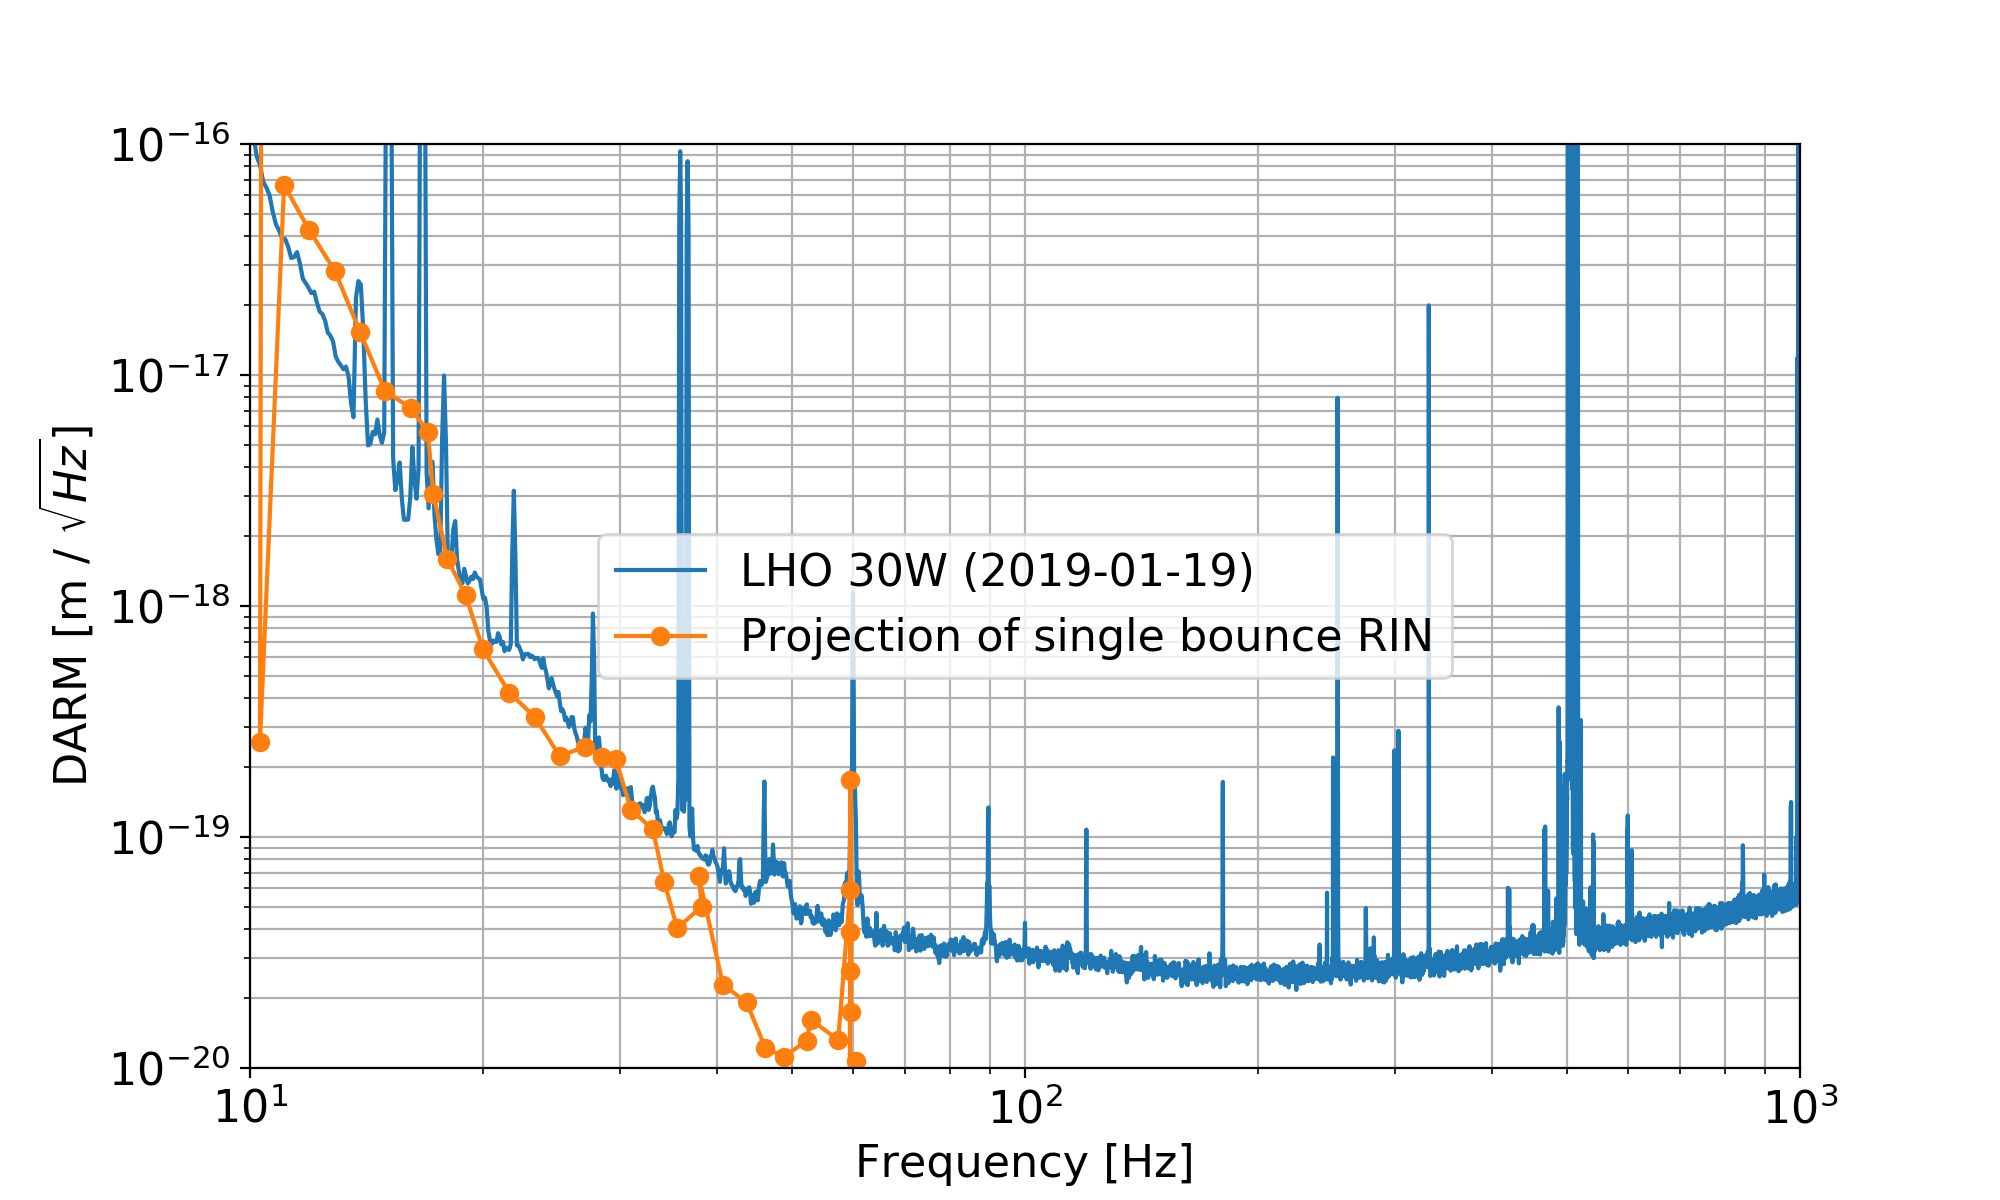
If we believe the carrier single bounce RIN measured by Jamie and Rana, and use the radiation pressure intensity noise coupling (based on 8% power imbalance and matching Craig's measurement in 46817), we get something pretty close to the DARM noise:
2) same question for the excess SB RIN? Is that PRMI control noise?
For 35W input power, the ISS inner PD shows 27.3mA, whereas the outer shows 29.7mA.
Note I think it's possible that we were looking at the 45MHz sideband in the PRMI lock, rather than the 9MHz sideband. We will attempt to retake this measurement once the IFO is recovered.
it seems that the OMC length lock is not strong enough to measure low RIN - this is why the increase of the OMC length dither decreases the RIN.
Most of the low frequency peaks are due to acoustics - we were using the QPDs for OMC-ASC instead of angular dither.