TITLE: 07/01 Day Shift: 15:00-23:00 UTC (08:00-16:00 PST), all times posted in UTC
STATE of H1: Observing at 146Mpc
CURRENT ENVIRONMENT:
SEI_ENV state: CALM
Wind: 8mph Gusts, 5mph 5min avg
Primary useism: 0.01 μm/s
Secondary useism: 0.06 μm/s
QUICK SUMMARY:
Receiving a nicely locked H1 which has been locked 5.75hrs.
Austin gave me a rundown of items to look out for with his lockloss experience:
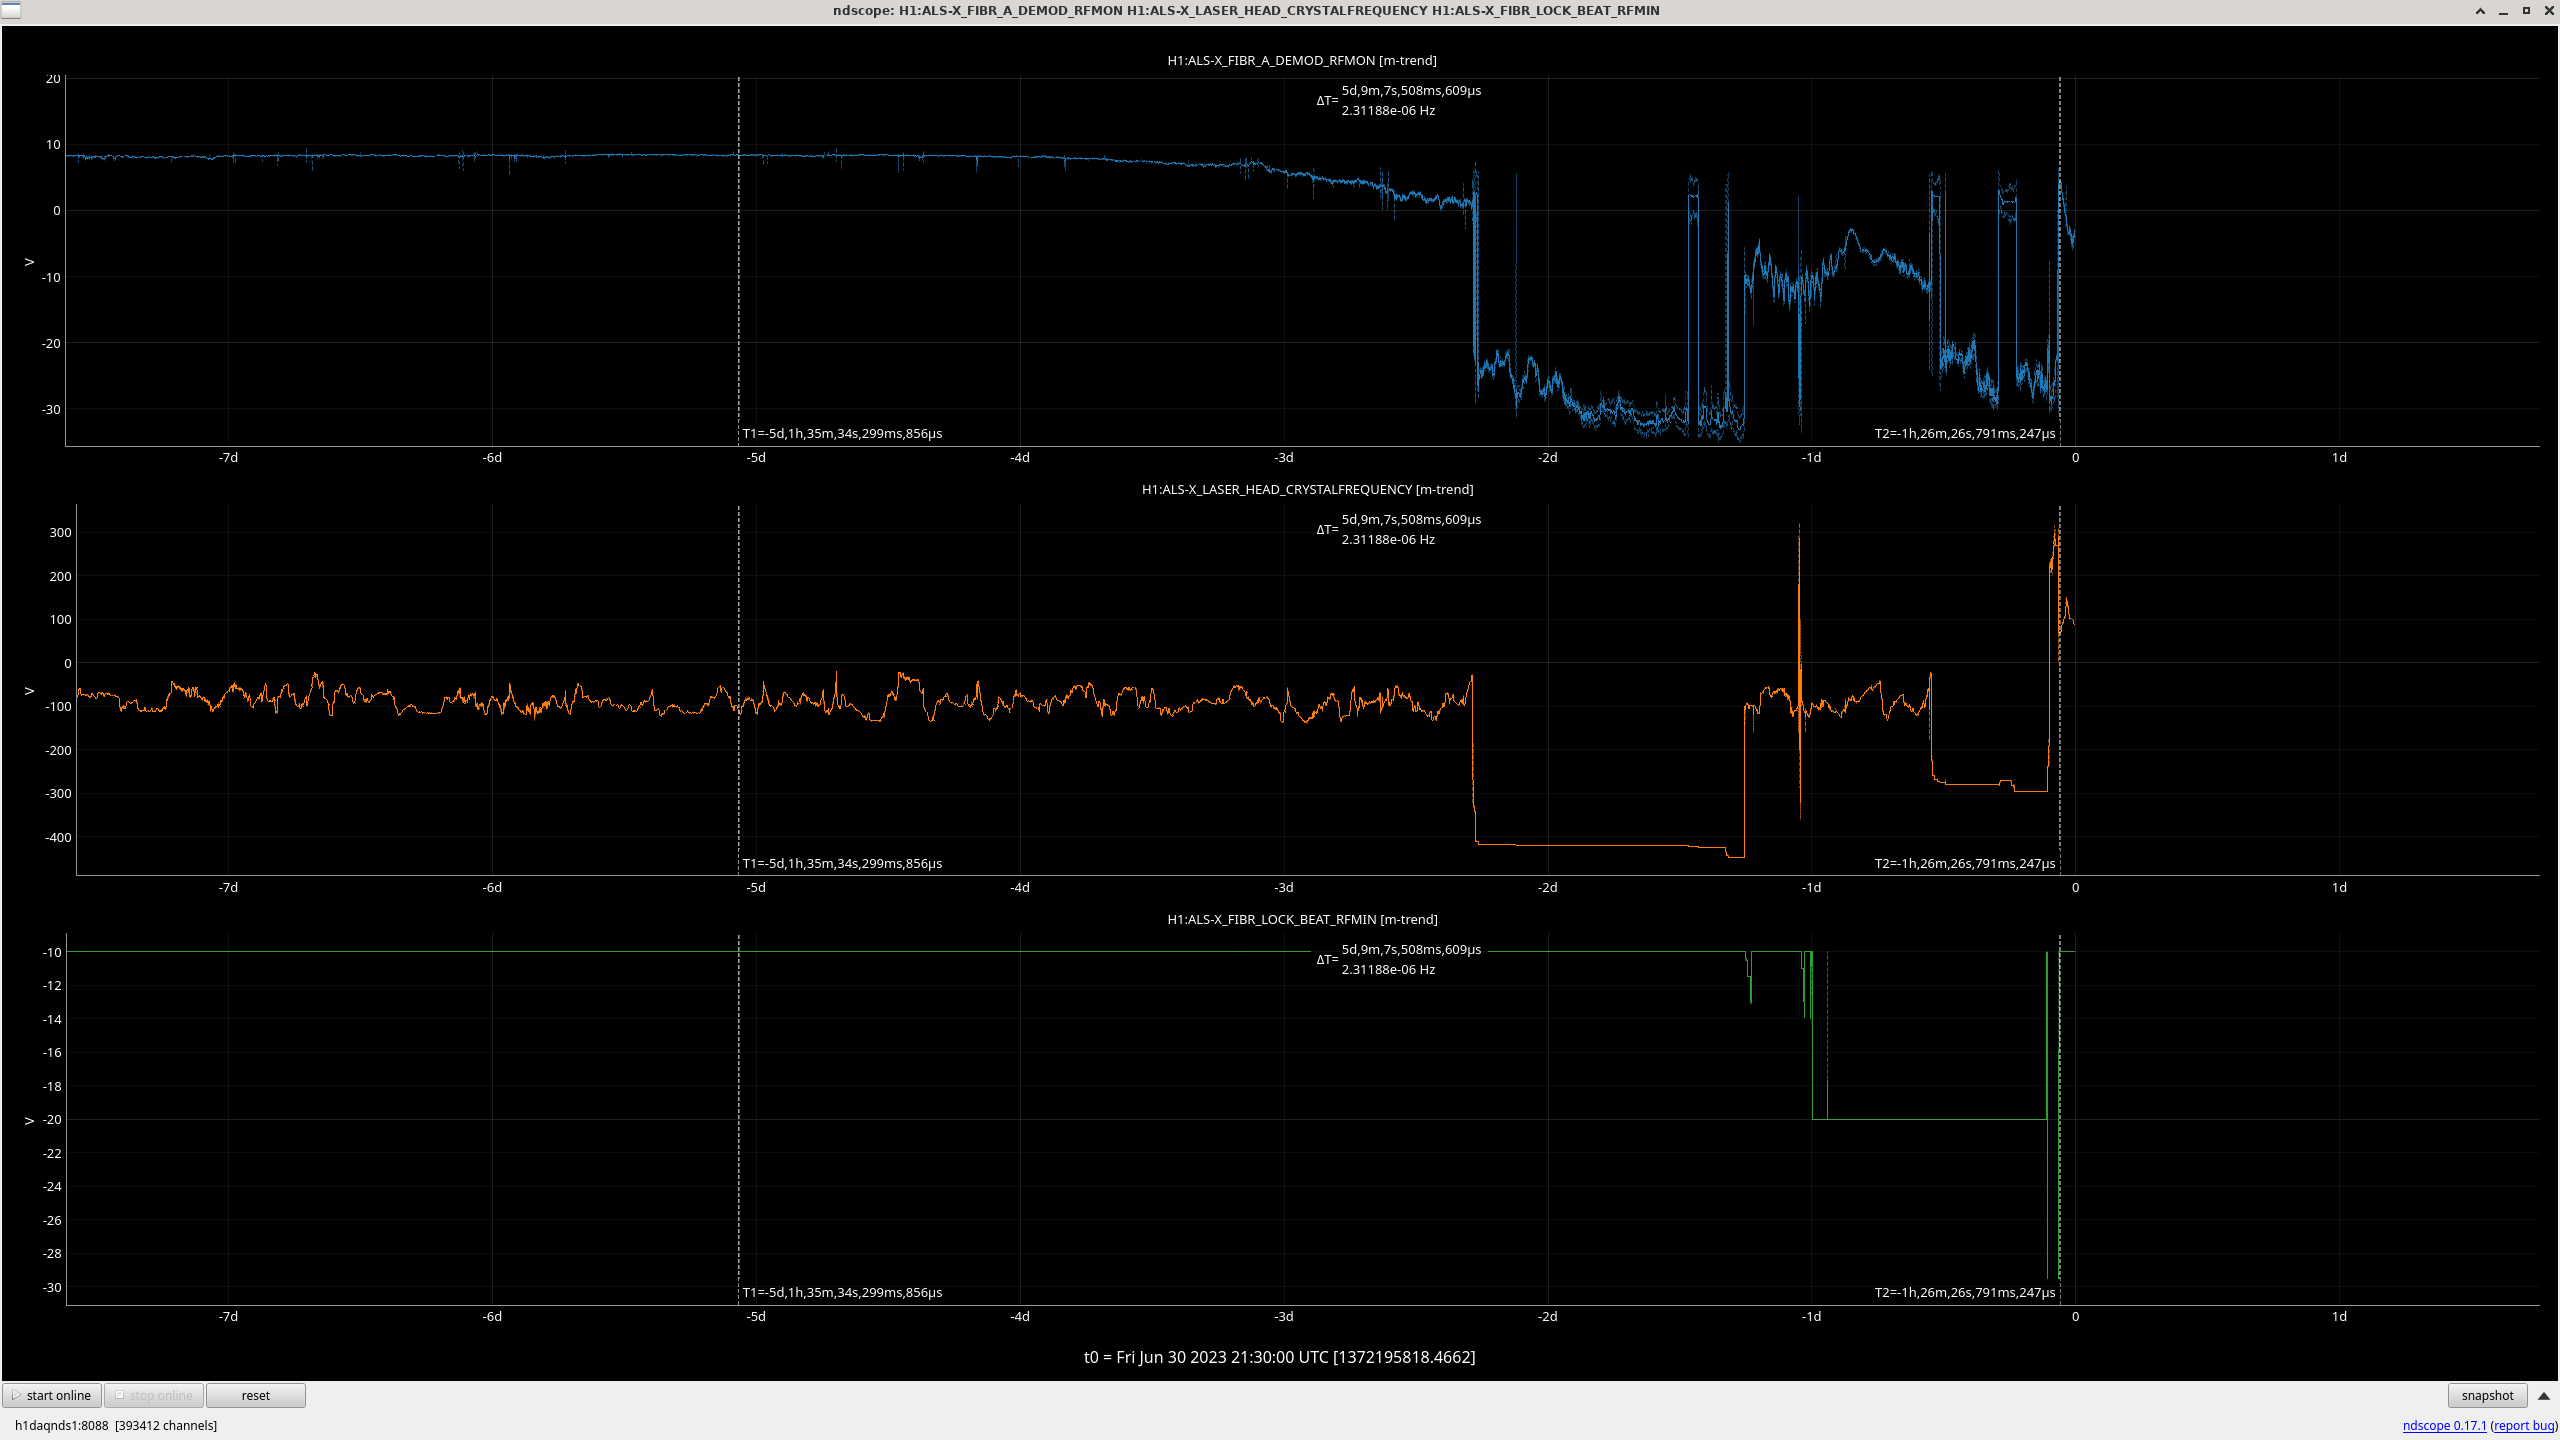
Oh, and the winds have died but the high temperatures continue outside.
TITLE: 07/01 Owl Shift: 07:00-15:00 UTC (00:00-08:00 PST), all times posted in UTC
STATE of H1: Observing at 144Mpc
SHIFT SUMMARY:
- Lockloss @ 7:29
- Relocking - the ALS X PLL issue was still apparent - I set the RF minimum threshold to -30 and set the crystal frequency to 0 to reset the beatnote and that seemed to do the trick
- 7:46 - incoming 5.8 EQ from Sri Lanka
- Rest of locking was automated, but did have to hold in OMC WHITENING to damp violins for just under an hour
- 9:31 - incoming 5.1 EQ from Kuril Islands
- Acquired NLN @ 9:31
- EX saturations @ 10:56/13:03/14:12
- 13:56 - incoming 4.8 EQ from Alaska
Leaving H1 to Corey with H1 in observing, going on 5:30 hours. Ground motion has settled from the EQs and all appears to be stable.
LOG:
No log for this shift.
H1 has been observing for 1:30 hours, following a lockloss, potentially due to local ground motion. There were a couple EQs that we were successfully able to ride out and ground/wind motion as a whole looks to be dwindling back down.
LOCKLOSS @ 7:29 - Potentially ground motion related, EX/EY is ~0.5 ur in the EQ bandwith and wind speeds are hovering around 30-35 mph sitewide.
TITLE: 07/01 Owl Shift: 07:00-15:00 UTC (00:00-08:00 PST), all times posted in UTC
STATE of H1: Observing at 141Mpc
CURRENT ENVIRONMENT:
SEI_ENV state: CALM
Wind: 28mph Gusts, 23mph 5min avg
Primary useism: 0.07 μm/s
Secondary useism: 0.08 μm/s
QUICK SUMMARY:
- H1 has been in observing for 9 hours
- End station ground motion in the EQ bandwith has been on the rise as is wind, will monitor both
- CDS/DMs ok
TITLE: 07/01 Eve Shift: 23:00-07:00 UTC (16:00-00:00 PST), all times posted in UTC
STATE of H1: Observing at 143Mpc
SHIFT SUMMARY:
An Earthquake from Argentina (5.3) rolled through around 4:12
Wind has been picking up even more and further increasing the arm ground motion. Gusts over 30mph from 05:30 and still as of 07:00
IX saturation at 05:17, EX at 06:11
LOG:
| Start Time | System | Name | Location | Lazer_Haz | Task | Time End |
|---|---|---|---|---|---|---|
| 23:06 | VAC | Janos | EndY | N | Take apart pump | 23:37 |
| 23:02 | VAC | Gerardo | MidY | N | Take pictures of Hepta pump setup | 00:50 |
STATE of H1: Observing at 142Mpc
(Jordan V., Gerardo M.)
The instrument air at X-End has been alarming, see entry here. After looking at the trends for this channel, there is some noise/spikes noticeable for this particular channel, while the IFO was recovering from a lockloss, we vented the line but no change was noted on the signal, we will continue to look into this, for now we have raised the alarm level from 5 to 10 via probe, so this is not permanent change. Perhaps a bad sensor or wire.
Looking at intensity noise in reflection of the interferometer allows us to measure the mode matching as well as the reflection coefficient.
The idea is that fluctuations above the cavity pole are promptly reflected by the interferometer, whereas the DC field will be resonant and have a reflectivity smaller than unity. In our case, where we are close to critically matched but still over-coupled, the reflected DC field also picks up a minus sign. Any field that is not mode matched will simply be prompt reflected and not acquire a minus sign. The later is true for both the fluctuations and the DC field.
Including the total reflected power, one can then invert the equation and determine both mod matching and reflectivity. A note detailing the derivation can be found in LIGO-T2300249.
Using the values measured in alog 70982, we get
| 75W | 60W | |
| RIN ratio (REFL/OUTER) | -2.305 | -2.75 |
| Ifo total power reflection coefficient | 7.32% | 6.86% |
| Mode Mismatch (power) | 3.2% | 2.3% |
| Interferometer Reflection TEM00 DC (power) | 4.3% | 4.7% |
For this derivation we neglected to include the RF sidebands. Typically, they are small, but the note details how they can be included if the power is measured as function of the modulation index. The 75W interferometer wasn't thermalized yet, when the measurement was taken and we can expect an additional 1.2% of power increase in reflection. If we attribute all to mode mismatch, we would have a total of ~4.4% of the input power not mode matched.
The mode mismatch power is important for figuring out the impedance matching of the PRM, see alog 68451.
Here are LLO results published in 2017 (P1700010): Demonstration of the Optical AC Coupling Technique at the Advanced LIGO Gravitational Wave Detector
Closes FAMIS 17560, last checked in alog 70032
All plots look normal, as they did last time they were checked.
We are looking at the RIN measured by the reflection port of the interferometer and comparing it to the RIN of the input beam as measured by the ISS second loop detectors. For both 75W and 60W input we are measuring this transfer function using high frequency ISS noise injections.
One thing to notice is that the filter modules for LSC-REFL_A_RIN and LSC-REFL_B_RIN contain a calibration factor of 0.3055, which we removed from the measurements presented here.
We also used the calibration factor from alog 70979 to correct the ISS outer loop detector.
Finally, we derive the power reflection coefficient of the interferometer by dividing the observed power in reflection by the expected prompt reflection value. This is using scaling factors from the above alog.
| 75W | 60W | |
| RIN ratio (REFL/OUTER) | -2.305 | -2.75 |
| Ifo power reflection coeff. | 7.32% | 6.86% |
For the 75W measurement the interferometer was not fully thermalized. We expect more like ~8.5% of the power to be reflected after a couple of hours locked.
Closes FAMIS 25588, previously checked in alog 70776
The outbuilding fans look fine. EY_FAN1_470_1 is the noisiest fan at about 0.3.
The CS fans looks fine, they all saw a glitch 3 days ago. MR_FAN5_170_1 is the noisiest fan at just under 0.4.
TITLE: 06/30 Day Shift: 15:00-23:00 UTC (08:00-16:00 PST), all times posted in UTC
STATE of H1: Observing at 146Mpc
CURRENT ENVIRONMENT:
SEI_ENV state: CALM
Wind: 25mph Gusts, 16mph 5min avg
Primary useism: 0.03 μm/s
Secondary useism: 0.06 μm/s
QUICK SUMMARY:
TITLE: 06/30 Day Shift: 15:00-23:00 UTC (08:00-16:00 PST), all times posted in UTC
STATE of H1: Observing at 143Mpc
SHIFT SUMMARY:
Sheila was able to fix the issue with the EX PLL Beatnote by making adjustments to the ALSx laser.
LOCK #1: 1850-2221utc
LOG:
Sheila, Naoki, Brina,
Took a look at what changed after powering down (alog 70497, alog 70687) and changing the OM2 settings (alog 70849), from the CAMERA_SERVO, it seems that the ETMX and BS were slightly affected by these changes, (shown in the images attached, the YAW/PIT1 refers to BS and YAW/PIT2 refers to ETMX).
When re-locking, ADS is ran until the error signal is small, then CAMERA_SERVO gets set, so we believe that the changes from the power and OM2 changed how ADS moves the setpoint.
Sheila, Corey, Brina, Lance, Genevieve, Oli
After the lockloss, we went to EX to adjust the ALS X laser current and temperature. We found the settings at 1.874A, 25.06C, we left them at 1.889A, 25.17C.
When we first looked at the beatnote on the agilent we could see that there were multiple beatnotes, and that the power was drifting back and forth between them, supporting the idea that the laser was mode hopping. We adjusted the current up and the temperature down until most of the power seemed to be stably in one beatnote, below 100MHz. Then Corey was able to lock the PLL, and saw a beatnote strength of 4dBm and reset the threshold to it's normal value of -10dBm.
The attached trend shows that in the last couple of hours, the beatnote has dropped down. This may mean that we didn't move the current enough to completely avoid mode hopping.
Fri Jun 30 12:47:52 2023 INFO: Fill completed in 2min 52secs
Ran the fill again at 12:45 this afternoon, Gerardo confirmed it was a good fill curbside.
The trip temperatures have been reduced from -120C to -130C to see if this helps with the premature end-of-fills we have seen this week now that the outside temperatures are increasing.
For cross correlation with 60W, hot OM2, we removed squeezing for 1 hour.
start: 1372017274 (2023/6/28 19:54:16 UTC)
end: 1372021147 (2023/6/28 20:58:49 UTC)
Plots for this time are here: 70978
Attached is a cross correlation plot for 20 minutes of no sqz time taken June 21st (70668) after first reducing the input power to 60W (366kW circulating power), this was before the LSC feedforward was retuned improving the sensitivity below 50Hz. The first plot is in loop corrected mA, you can compare the correlated noise estimate by the cross correlation and by subtracting the shot noise. At high frequencies the shot noise subtraction doesn't work well, I believe this is due to imperfections in how the DCPD sum mA channel is calibrated into actual mA. At low frequencies the cross correlation is overestimating the DCPD sum PSD, this isn't due to an error in the OLG measurement. See alog 70453 for some information about checks of the cross correlation and this low frequency problem. In mid frequencies the two methods seem to agree. The second attachment is the same data calibrated into displacement, with a model of quantum raditation pressure noise included and subtracted from the two estimates. For this time the DARM OLG model from pyDARM was underestimating the OLG by 2% at 24Hz, so I've scaled it up by 2%.
The next set of attachments are the same two plots made for 2 hour of no sqz time from June 4th when the HAM7 ISI had a problem (70117), in DCPD mA and in displacement . We don't have a DARM OLG measurement from this time, so we are just using the pyDARM model without any scaling.
Evan H pointed out that the calibration into displacement for the plots above were incorrect. This is because I used pyDARM to get the calibration from DARM err to displacement, but forgot to update my hardcoded scalar to translate mA to DARM err. I also changed the ini file that is pointed to, for 75W I'm using '/ligo/home/jeffrey.kissel/2023-05-10/20230506T182203Z_pydarm_H1.ini' for times after June 22nd (60W) I'm using '/ligo/groups/cal/H1/reports/20230621T211522Z/pydarm_H1_site.ini' When I use pydarm to calibrate mA into meters, I am not applying corrections for the kappas here, which GDS does. In all the attached calibrated plots, GDS_STRAIN shows higher noise from 60-90 Hz, which might be consitent with the fairly large GDS calibration error which has been mostly consistent throughout these configuration changes (see 70907 and 70705)
We also took another set of cross correlation data for 1 hour with the hot om2 on Wed, 70930, those plots are attached here as the last two attachments. It is interesting to open all three of these plots in a browser and look back and forth between them. The most obvious change is the jitter peaks, and the improvement at low frequency from the power reduction. But there also seems to be a broad change in noise from 60-100Hz, which should probably be confirmed by looking at other times and double checking the calibrations.
Plot 1 shows the dark noise in LSC-REFL_A_LF and REFL_B_LF (yellow/black), with 10W laser input with ISS second loop (red/blue) and w/o ISS second loop (magenta/cyan). The photocurrent in REFL_A and REFL_B was about 16mW each for the 10W measurements. It will turn to about 10mW in full lock. So, we are now about a factor 4 above dark noise.
Plot 2 shows the RIN of the 2 REFL PDs and their average, together with the ISS second loop sensors. The ISS inner and outer sensors have about 7-8mW of light each, so the measurements are limited by the shot noise of the inner PD. In full lock these sensors see about 60mW.
Here are 2 plots when the interferometer is locked. The ISS second loop sensors see about 60mW of light, whereas for this time LSC-REFL_A/B see about 8mW each.
The first plot shows a large excess in REFL power fluctuations below ~200Hz. EVen the flat part 300Hz shows some excess. It should be about 70% of the 16mW measurements, but shows a very similar level. Looking at the coherence between REFL_A and B indicates that this is a real signal and not noise.
The second plot shows relative intensity noise. To get the curves calibrated correctly one should match the peak near 4.5kHz since this seems rela intensit noise from the laser. (There is a factor of 0.3 in the calibrations of the RIN of REFL_A/B to acocunt for the interferometer reflectivity at DC. This factor should be 1 when the interferometer isn;t locked.)
Here is comparison between early in the lock and after 4 hours.
The hump in the reflected power is clearly getting larger as time progresses, and is its coherence with PRCL. The input power as measured by the ISS second loop outer sensor doesn't have a large correlection with the reflected power (some is expected due to the shot noise of the inner sensor).
Q1: Why is PRCL coherent with the power in reflection? If theer is a couplinh, shouldn't it be at least second order?
Q2: What's the flat noise above 300Hz that we see in the reflection power?
Here is the power trend during this lock.
And these are the plots more than 7 hours into a 60W lock. The REFL PD now seems to be shot noise limited above 100Hz.
Here is a comparison between the noise measured in reflection at 75W and 60W and against the dark noise. Some observations:
The outer loop RIN is always reported about 8% higher than the innner loop one. This is not real. In the PSL ISS model of the second loop ISS both detector values are divided by the DC value of the inner loop detector. Since the outer loop detector sees about 8% more light, the RIN in the outer loop detector is overestimated by this amount. To get a better value multiply by 0.922. With this correction both RIN spectra agree with each other.
A better calibration of the REFL/ISS PDs measured with 10W input and all TMs misaligned.
| Measured | Calibration | |
| IMC-PWR_IN | 9.855 W | 1 W/W |
| PDSUMINNER | 7.477 mA | 0.7588 mA/W |
| PDSUMOUTER | 8.115 mA | 0.8235 mA/W |
| REFL_A_LF | 16.70 mW | 1.694 mW/W |
| REFL_B_LF | 15.59 mW | 1.582 mW/W |
Here is a 60W trend for completness.